
Abstract
Background
Mitochondrial fusion is vital for cellular function and has been increasingly linked to cancer development. Kidney renal papillary cell carcinoma (KIRP), the second most common renal cell carcinoma, presents diverse prognostic outcomes. Identifying novel biomarkers is critical for improving prognosis and treatment response in KIRP.
Objective
This study aims to explore the gene expression associated with mitochondrial fusion and establish a novel gene signature model to predict KIRP prognosis and cisplatin sensitivity.
Methods
We analyzed RNA sequencing data and clinical records of 285 KIRP patients from The Cancer Genome Atlas (TCGA). LASSO regression identified four key mitochondrial fusion-related genes (BNIP3, GDAP1, MIEF2, PRKN). Multivariate Cox regression evaluated their association with overall survival. Risk stratification was developed based on gene expression. We assessed immunotherapy responses using checkpoint inhibitor scores, tumor mutation burden, TIDE scores, and tumor microenvironment characteristics. Cisplatin sensitivity was evaluated via correlation analysis of gene expression levels and half-maximal inhibitory concentration (IC50). In vitro loss- and gain-of-function experiments in KIRP cell lines (Caki-2, ACHN) assessed MIEF2's role in cisplatin sensitivity.
Results
The gene signature successfully stratified patients into high- and low-risk groups, with significant survival differences. The area under the ROC curve (AUC) for the risk model was 0.782. MIEF2 was notably associated with cisplatin sensitivity, confirmed through functional experiments. Patients in the high-risk group exhibited lower MIEF2 expression and increased cisplatin sensitivity.
Keywords
Introduction
Renal cell carcinoma (RCC) is a common cancerous growth1,2 and holds the sixth place in terms of frequency of diagnosis in men and the tenth place in women. Over 140 000 RCC-related fatalities take place annually. 3 KIRP stands as the second most prevalent variant of renal cell carcinoma, making up around 15% of all such carcinomas.4-6 The prognosis of KIRP patients is highly variable, currently, there is no effective treatment for advanced-stage KIRP.7-10 So effective prognostic biomarkers are urgently needed for personalized treatment and follow-up strategies.
Among the many functions of mitochondria, they are responsible for cellular energy metabolism, free radical generation, and apoptosis.11-13 Mitochondrial fusion, a process that involves the fusion of two or more mitochondria into a single organelle, has been implicated in cancer progression.14-16 Dysregulated mitochondrial fusion has been shown to contribute to cancer initiation, progression, and therapeutic resistance.17-19 Numerous research efforts have explored the relationship between mitochondrial fusion and the prognosis of cancer.20-22
Christina Stengel et al developed FUDGE (Gene Enrichment FUSION Detection) as a fusion gene identification strategy that targets, enriches, and identifies fusion genes, ultimately determining that fusion genes are key determinants of diagnosis, prognosis, and treatment opportunities for various types of cancer. 23 Xinru Kong et al identified genetic biomarkers for evaluating the prognosis of laryngeal squamous cell carcinoma (LSCC) by comprehensively analyzing the differential expression profiles of lncRNA, mRNA, and miRNA in laryngeal squamous cell carcinoma. 24 However, the role of mitochondrial fusion in KIRP remains unclear, few studies have explored the potential of mitochondrial fusion-related genes as prognostic biomarkers for KIRP. Therefore, we develop a mitochondrial fusion RNA signature for predicting the prognosis of KIRP patients. By analyzing publicly available RNA sequencing data and using bioinformatics analysis, we identified differentially expressed genes related to mitochondrial fusion and developed a risk score model for predicting patient outcomes.
Methods
Data Collection
The data related to KIRP and the related clinical details of ovarian cancer patients were obtained from The Cancer Genome Atlas (TCGA) repository (https://cancergenome.nih.gov/).
Selection of Genes Associated with Mitochondrial Fusion
In the initial phase of our study, we meticulously selected genes associated with mitochondrial fusion by querying the Molecular Signatures Database (MSigDB, version V2022.1.HS). The selection criteria were based on a combination of bioinformatics approaches, including gene set enrichment analysis, literature reviews, and correlation with established mitochondrial functions. Specifically, we identified genes showing significant involvement in mitochondrial fusion processes, as evidenced by their presence in curated gene sets within the database and supported by peer-reviewed publications. The initial list was refined using statistical significance thresholds from gene expression profiles in KIRP samples, ensuring that the genes included were empirically relevant to our study's focus. This approach yielded a list of 31 genes recognized for their roles in mitochondrial dynamics and their potential implications in the pathophysiology of KIRP.
Creation of a Risk-Predictive Model and Survival Analysis
In order to examine the prognostic significance of genes associated with mitochondrial fusion in KIRP, we conducted a LASSO regression analysis. The genes linked to prognosis were identified through multivariate Cox regression analysis, which was used to create a risk prediction signature. The risk score was determined as follows:

To comprehensively evaluate the diagnostic capability of our risk score model, which is based on the expression levels of genes associated with mitochondrial fusion, ROC curve analysis was employed. The ROC curve compares the true positive rate (TPR) against the false positive rate (FPR) across various threshold settings, with the area under the curve (AUC) serving as a quantitative measure of the overall model performance. In cancer prognosis studies, a model with a high AUC value can more accurately differentiate between patients with varying risk levels, thereby aiding clinical decision-making. In this study, the ROC analysis not only provides a method to assess the predictive accuracy of biomarkers but also enables us to compare the newly developed gene signature with existing prognostic models, demonstrating its added predictive value.
The Predictive Value of KIRP in Determining Benefits from Immunotherapy and Other Treatments
To forecast the potential immunotherapeutic reactions to KIRP in cancerous growths, we employed a series of prognostic metrics associated with checkpoint inhibitor immunotherapy. These metrics comprised of the tumor mutation burden (TMB) score, the TIDE score, and the TME score. TMB, known widely for its predictive power in determining immunotherapy efficacy, was computed for each KIRP patient within the TCGA cohort, drawing from the available somatic mutation data. The TIDE score, a recently introduced method for assessing ICB effectiveness, can be accessed through the TIDE website (http://tide.dfci.harvard.edu/). We employed the ‘TMEscore’ R packages to compute the TME score, which gauges patients’ ICB response. The Kruskal-Wallis test was utilized to probe the differences between the checkpoint expression, TMB score, TIDE score, and TME score, while the Pearson correlation was used to determine the association between TMB and the risk score.
Establishing a Predictive Model for Chemotherapeutic Response and Its Correlation Analysis
Using the TCGA dataset, we downloaded RNA-sequencing expression profiles and relevant clinical data for KIRP. Employing the R package “prophetic,” we predicted each sample's chemotherapeutic response based on the Genomics of Drug Sensitivity in Cancer (GDSC) database, estimating the half-maximal inhibitory concentration (IC50) through ridge regression. Spearman correlation analysis was performed to assess the relationship between IC50 scores and KIRP gene expression, with visual representations displaying sample groups and IC50 score distributions. Density curves reflected the trends in both IC50 scores and gene expression distribution. Differences in statistical significance across groups were highlighted using asterisks, with a Wilcox test for pairwise comparisons, following the guidelines of the R foundation for statistical computing (2020) version 4.0.3.
RNA Extraction and RT-qRCR
Total RNA was extracted from Caki-2 and ACHN cell lines using the FastPure Cell/Tissue Total RNA Isolation Kit V2 (Vazyme, Catalog: RC112-01) according to the manufacturer's protocol. The cDNA was synthesized from RNA samples using the HiScript® II Q RT SuperMix for qPCR (+gDNA wiper) (Vazyme, Catalog: R223). The qPCR method was conducted using ChamQ SYBR qPCR Master Mix (Vazyme, Catalog: Q311-02). The final volume of 10 μl was then subjected to quantitative real-time PCR using a QuantStudioTM 6 Flex Realtime PCR System (Applied Biosystems, Catalog: 6Flex, USA). The relative mRNA levels of genes were then quantified using the comparative ΔΔCT method.
Western Blotting Analysis
Total protein was extracted from Caki-2 and ACHN cell lines using radioimmunoprecipitation assay (RIPA) buffer (Beyotime, Shanghai, China) with phenylmethanesulfonyl fluoride (PMSF). The whole cell lysates were centrifuged and the supernatant was collected. Subsequently, the protein samples were diluted with 5×loading buffer and boiled for 5 min at 95 °C until dissolved. About 20 μg of cleared lysate was separated on 10% sodium dodecyl sulfate-polyacrylamide gel electrophoresis (SDS-PAGE) gels by electrophoresis and then transferred onto polyvinylidene fluoride (PVDF) membranes (Millipore, USA). After being blocked with 5% bovine serum albumin (BSA) in TBST for 2 h at room temperature, the membranes were incubated overnight at 4 °C with primary antibodies (Beta Actin antibody, 60008-1-Ig, Proteintech, ptgcn.com, 1:5000-1:50 000), and (SMCR7/MID49 antibody, 28718-1-AP, Proteintech, ptgcn.com, 1:500-1:2000). Data were then quantified using the Image Lab software (Bio-Rad, CA, USA).
CCK-8 Proliferation Assay
The cells (Caki-1 (L-Luc2) (CTCC-0494-Luc2), ACHN (CTCC-400-0029)) were seeded in 96-well plates at a density of 105/ml for each well. After treatment with Cisplatin in different concentrations, cells in each well were incubated with 20 μl CCK-8 assay reagent (Beyotime, Shanghai, China) for 1 h following the manufacturer's instructions. A microplate reader was used to measure the Optical density (OD) at 450 nm. Then inhibition rate (%) was calcaulated compared to the control group.
Statistical Analysis
All Statistical Analysis were carried out using R software (version 4.0.2). On the basis of the median risk score cutoff, high-risk and low-risk patients were categorized. In order to evaluate the differences in Overall Survival (OS) between the groups, Kaplan-Meier was used. The Chi-square test was used to assess the association between risk score and clinicopathological factors. Furthermore, a multivariate and univariate Cox analysis was performed to investigate the link between risk score and clinicopathological variables.
Results
Identifying Mitochondrial Fusion-Related Genes that are Associated with Survival
We acquired a total of 31 mitochondrial fusion-related genes from the Molecular Signatures Database (Figure 1).We conducted an examination of the LASSO regression model the association between these mitochondrial fusion-related genes and survival outcomes. As a result,these nine genes(BNIP3, FIS1, GDAP1, MFF, MIEF2, MIGA2, PRKN, TFRC, THG1L) were further analyzed in the following studies (Figure 2).
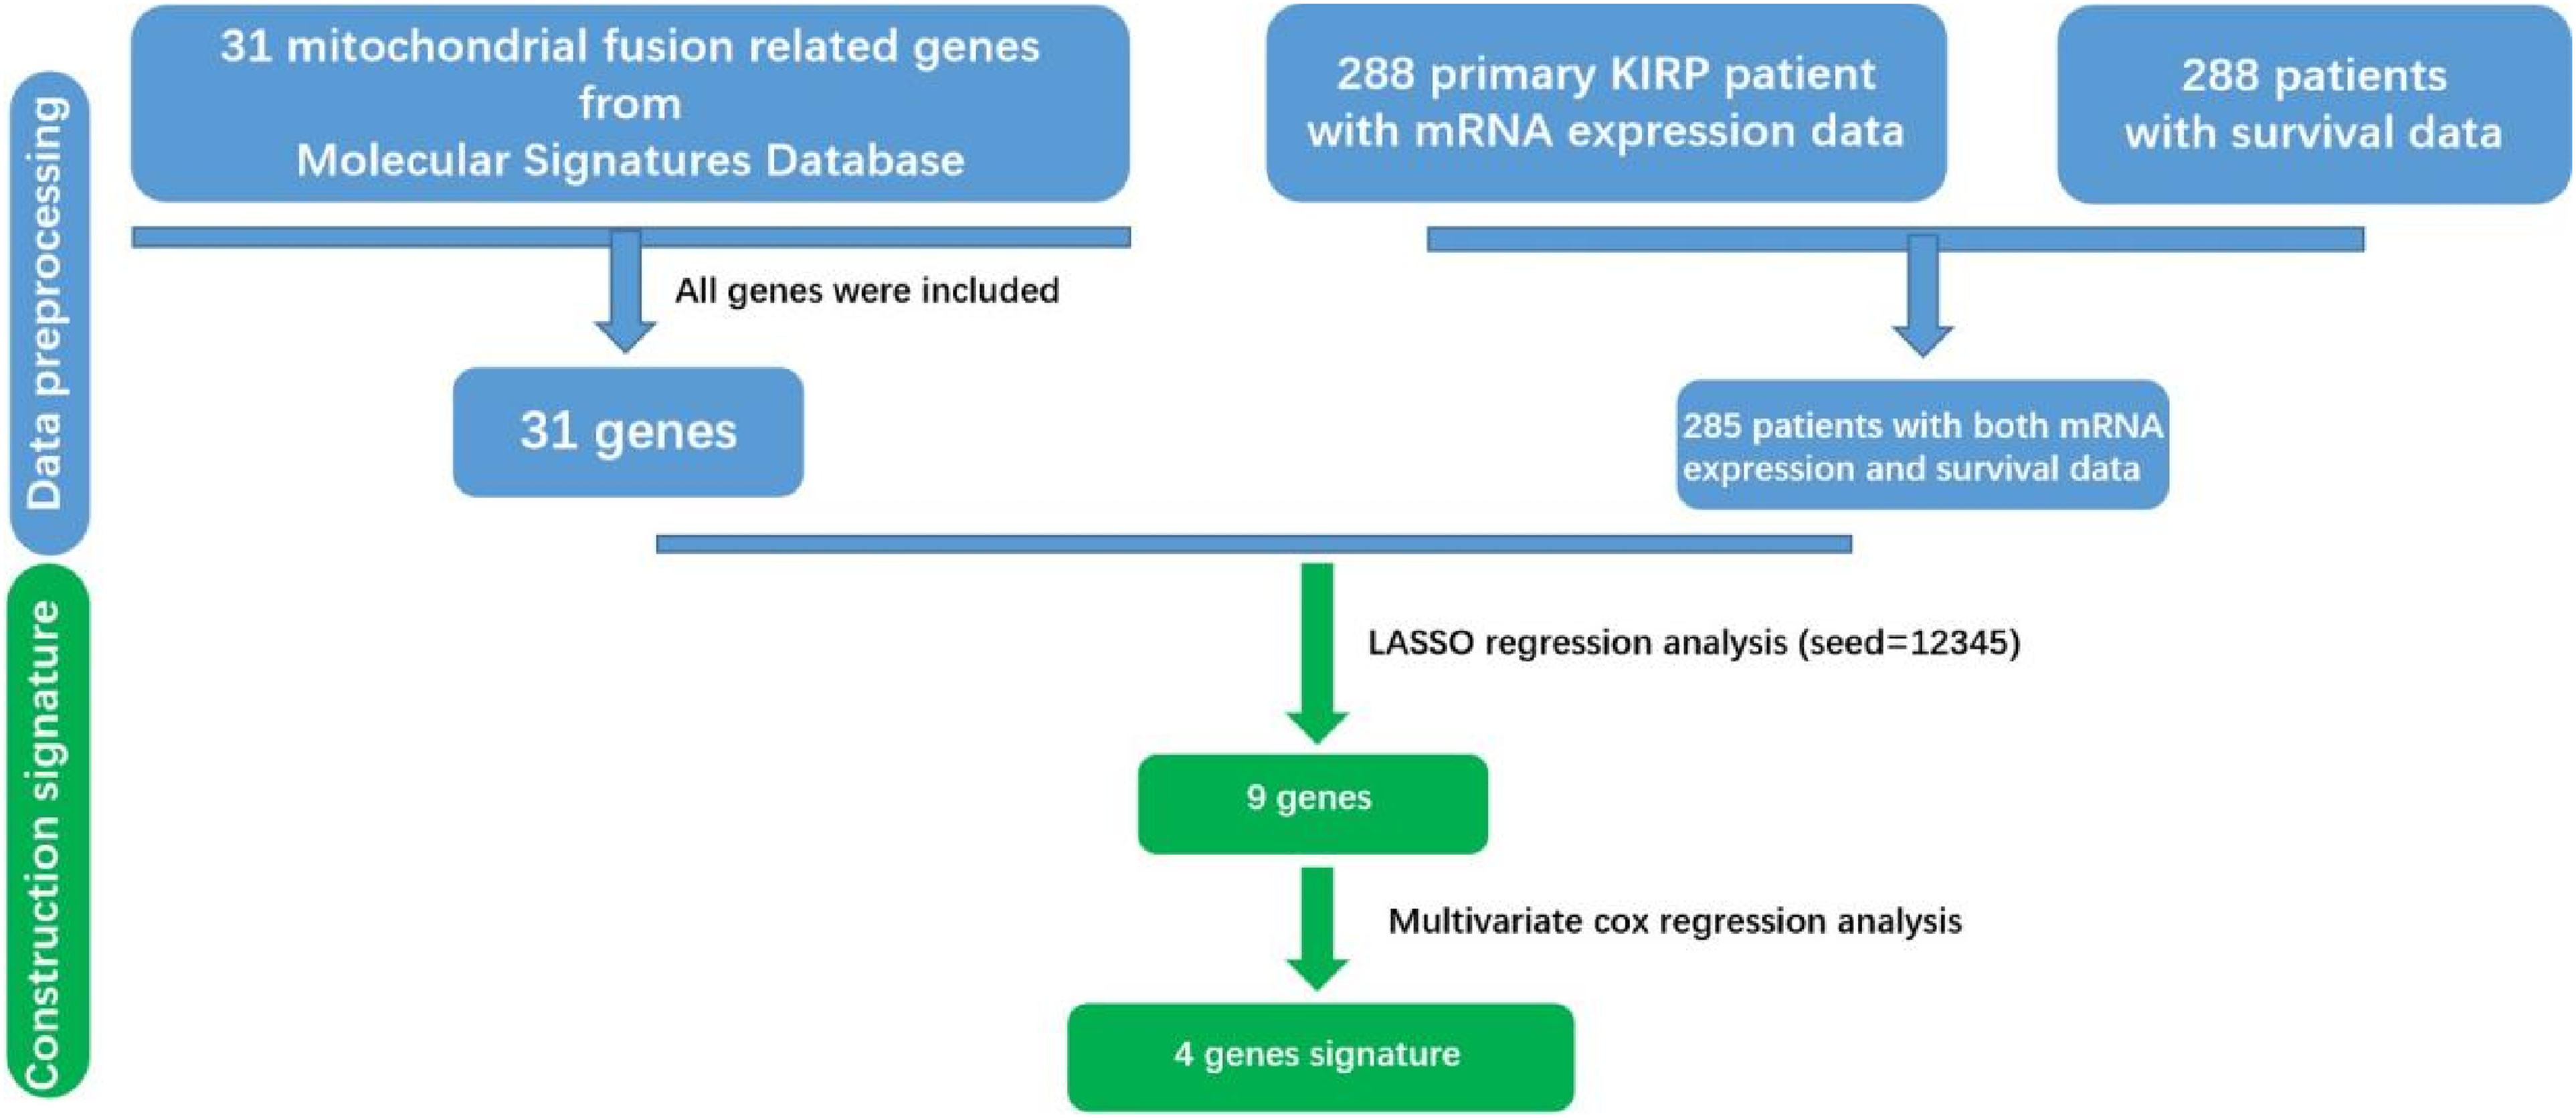
Flow chart of finding 4 genes signature in KIRP.

These mitochondrial fusion-related genes associated with survival of KIRP patients.
Development of a 4-gene Signature Panel to Predict Patient Survival Outcomes
A multivariate survival analysis was performed using the survival package in R software, examining the impact of these nine mitochondrial fusion-related genes on the prognosis of KIRP patients.
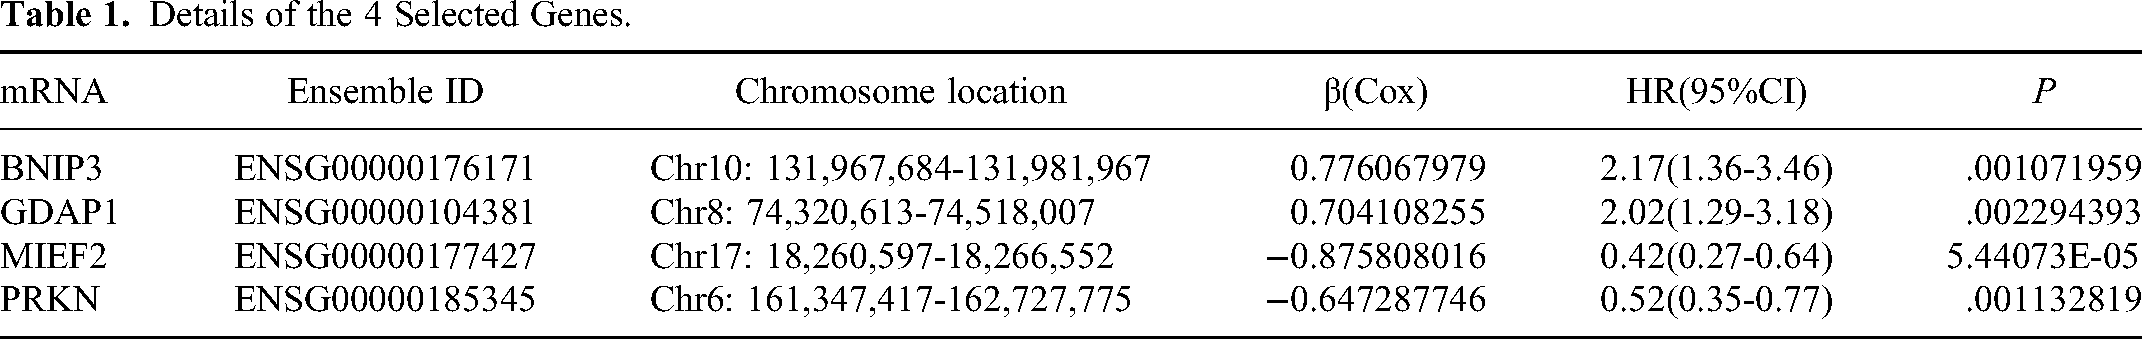
Ultimately, we selected 4 genes (BNIP3, GDAP1, MIEF2, and PRKN) to create a panel of genes with signatures. Here is the formula: Risk score =(0.776067979×BNIP3) + (0.704108255×GDAP1) + (−0.875808016×MIEF2) +(−0.647287746×PRKN) (Table 1). Employing this equation, we determined the risk score for every patient and separated them into a high-risk group (143) and a low-risk group (143) by dividing the data by the median (see Figure 3A and B).

Mitochondrial Fusion RNA Signature predicts OS in patients with KIRP. (A) Distribution of risk scores of each patient, (B) Relationship between survival years and survival status of each patient, (C) K-M curve to verify the predictive effect of the 4 genes signature,(D) ROC curve analysis to evaluate the 5 years diagnostic efficacy of the 4 genes signature.
Details of the 4 Selected Genes.
Kaplan-Meier analysis demonstrated a significant difference in prognosis between the high-risk and low-risk groups, with patients in the high-risk group exhibiting notably lower survival rates (Figure 3C). To assess the diagnostic role of these four genes, we performed ROC curve analysis, which yielded an AUC of 0.774 (Figure 3D). This result indicates that the 4-gene signature holds considerable prognostic value for survival prediction across the entire dataset.
In our analysis, we utilized specific clinical metadata from The Cancer Genome Atlas (TCGA) dataset to correlate with our gene expression findings. The choice of this metadata, including ‘New-Event-Type’ and ‘Cancer-Status,’ was driven by their potential to provide insights into the clinical progression and current status of the disease in KIRP patients. ‘New-Event-Type’ refers to the classification of any new tumor events that occurred during the patient's follow-up, such as recurrence or metastasis, which are critical for understanding the aggressive nature of the cancer. ‘Cancer-Status,’ on the other hand, represents the patient's disease status at the last follow-up, providing a snapshot of the treatment effectiveness and disease progression. These clinical parameters were chosen as they are closely aligned with the objectives of our study to understand the prognostic implications of mitochondrial fusion-related gene expression in KIRP. This approach is supported by previous studies that have demonstrated the significance of these clinical factors in predicting cancer outcomes.
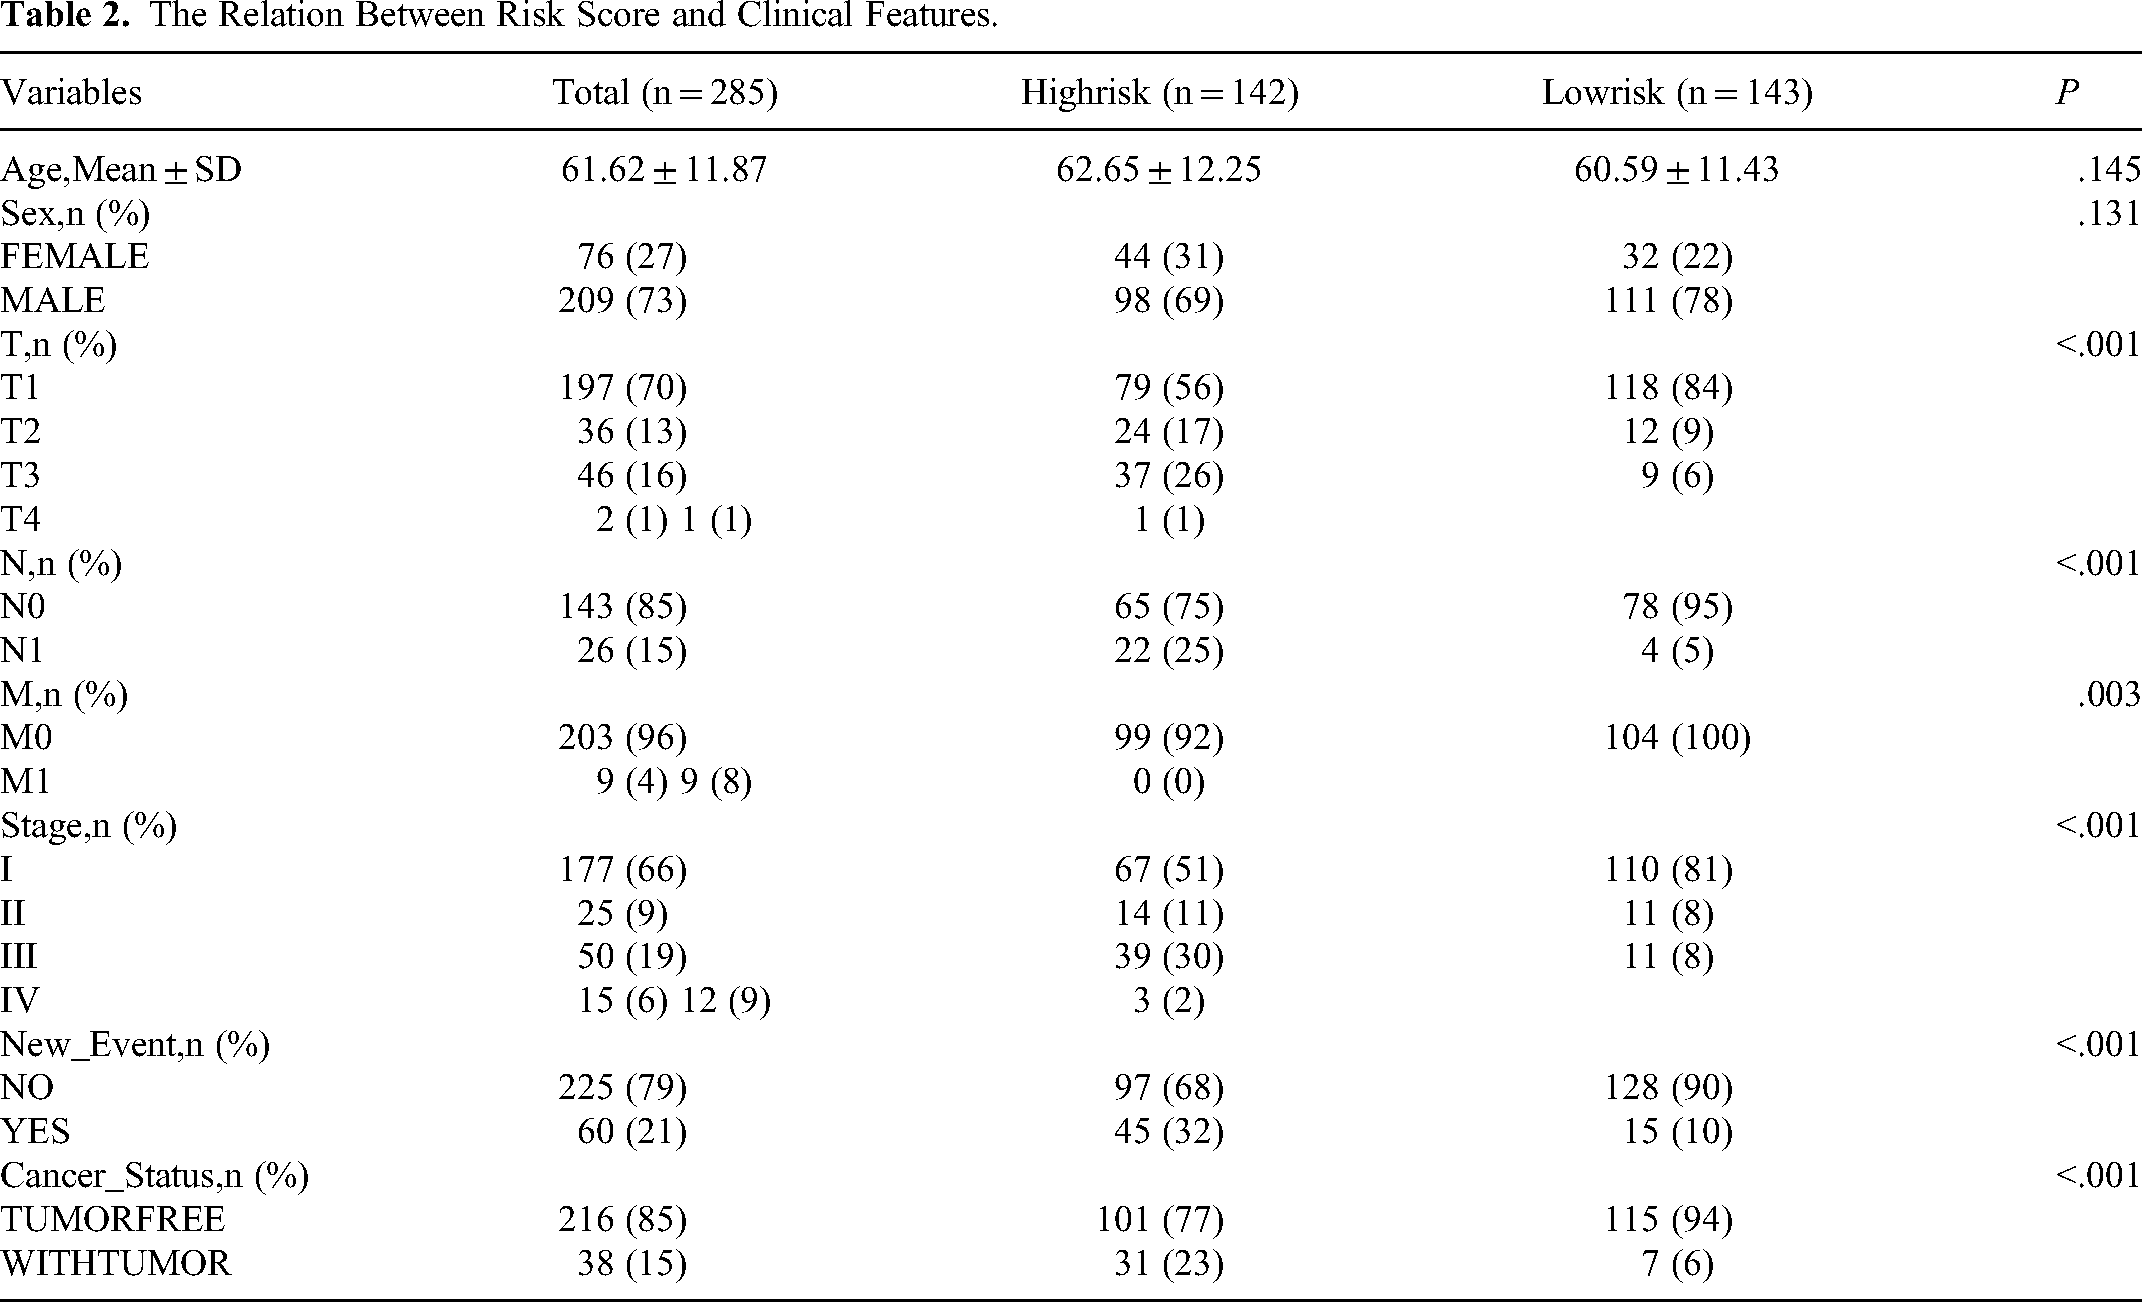
An analysis of the relationship between risk score and clinical features was conducted using a chi-square test (Table 2). Our findings unveiled that a correlation was found between New-Event-Type and Cancer-Status and KIRP risk scores.
The Relation Between Risk Score and Clinical Features.
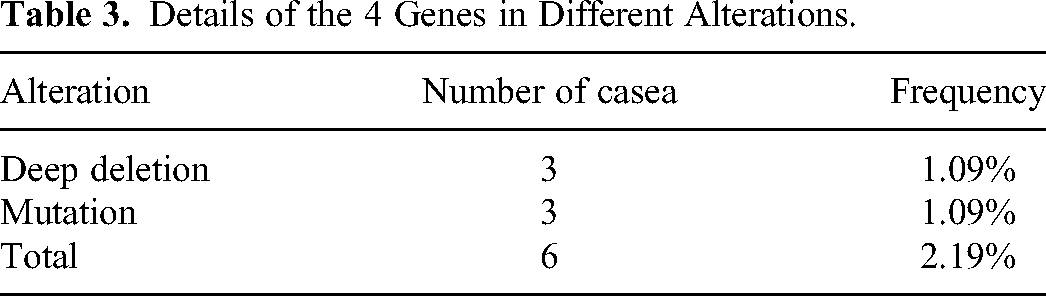
We probed into the genetic changes of the selected four genes in KIRP by utilizing the cBioPortal database. Out of the 285 patients, mutations were found in 274. In 6 out of 274 cases (2.19%), alterations were observed in all the genes examined, which included 3 cases (1.09%) of mutation and 3 cases (1.09%) of HOMDEL. The modification heatmap of these four genes is shown in (Figure 4). The alterations were as follows: BNIP3 at 0.36%, GDAP1 at 0.36%, MIEF2 at 0.36%, and PRKN at 1.09%. The BNIP3 gene included 1 case of mutation. The GDAP1 gene included 1 case of mutation. The MIEF2 gene included 1 case of HOMDEL. The PRKN gene included 1 case of mutation and 2 cases of HOMDEL (Tables 3 and 4).

The mutation landscape of the 4 genes in KIRP.
Details of the 4 Genes in Different Alterations.
Different Genetic Alteration Patterns of the 4 Genes in KIRP Samples (n = 274).

Simultaneously, we assessed the expression patterns of these four genes in individuals with high and low risk of kidney renal papillary cell carcinoma (Figure 5A). The results demonstrated a notable disparity in the expression of the four genes between the high-risk group and the low-risk group.In the high-risk group, the expression levels of BNIP3 and GDAP1 were elevated compared to the low-risk group, while the expression levels of MIEF2 and PRKN were reduced in comparison to the low-risk group (Figure 5B).

The expression of the 4 genes in KIRP. (A) the heat map for the expression of the KIRP patients, (B) the expression of the KIRP patients in low and high risk group.
Independent Prognostic Significance of the 4-Gene Signature Amidst Other Clinical Parameters
To assess whether the prognostic potential of the 4-gene signature can stand alone from other clinical parameters like age, tumor stage, and tumor grade, we executed both univariate and multivariate Cox regression analyses on the entire dataset. The outcomes highlighted a significant correlation between the 4-gene signature risk score and patient overall survival. Notably, despite adjusting for other clinical factors in the dataset, the 4-gene signature maintained its standing as an independent prognostic indicator (P = .011, HR = 1.063, 95% CI = 1.014-1.114). In addition, age of the patient also surfaced as an independent prognostic element, demonstrating its importance not only in the univariate analysis but also in the multivariate analysis (P = .032, HR = 1.049, 95% CI = 1.004-1.096, refer to Supplementary Figures 1 & 2).
Infiltration Patterns and Therapeutic Response in Coagulation Subtype Immune Landscapes
Coagulation subtypes refer to distinct classifications or categories within the coagulation system, differentiated based on specific factors or pathological conditions involved in the clotting process. Coagulation is a complex biological process involving a multitude of clotting factors, cell types, and biochemical reactions. In pathology, different coagulation subtypes play a pivotal role in diagnosing and treating coagulation-related disorders, such as thrombosis and bleeding disorders. There is a profound relationship between coagulation subtypes and the tumor microenvironment (TME). The TME refers to the non-cancerous cells and tissues surrounding tumor cells, including immune cells, stromal cells, blood vessels, and the extracellular matrix. The coagulation system plays multiple roles in the TME, influencing tumor growth, invasion, metastasis, and immune evasion.
In our study, the ESTIMATE score was utilized to assess the tumor microenvironment (TME) of KIRP samples, specifically focusing on the infiltration of stromal and immune cells. This score, derived from gene expression data, provides an indirect measure of the non-tumor cell components within the tumor tissue. The Stromal Score, a component of the ESTIMATE score, reflects the presence of stromal cells in the tumor, while the Immune Score represents the infiltration of immune cells. These scores are particularly relevant in our study as they can influence the tumor behavior and patient's response to treatments, including chemotherapy. Contrary to our previous statement, the ESTIMATE score is not used as an inference of tumor purity but rather as an indicator of the cellular composition of the TME, which can have implications for tumor progression and response to therapy.
Considering the close relationship between coagulation subtypes and immune activity, we used two computational tools, CIBERSORT and quanTIseq, to study the immune infiltration level of two clusters based on the TCGA queue (Figure 6A and B). Through these two different calculation methods, we can conclude that the low-risk group subtype was characterized by the high infiltration of B cell, Macrophage M1, NK cell, T cell CD8+, and Myelold dendritic cell, whereas the high-risk group was characterized by the high infiltration of T cell memory resting, Monocyte and Neutrophil. We computed the Stromal Score, Immune Score, and ESTIMATE Score for malignant tumor tissues using the TCGA expression profiles and the ESTIMATE algorithm. This method gives a stromal score indicating the presence of tumor-associated stroma and an immune score signifying immune cell infiltration levels. By combining these two, an ‘ESTIMATE Score’ is generated, which offers a comprehensive inference of tumor purity. In this ESTIMATE Score, there is no significant difference between the low-risk group and the high-risk group (Figure 6C).
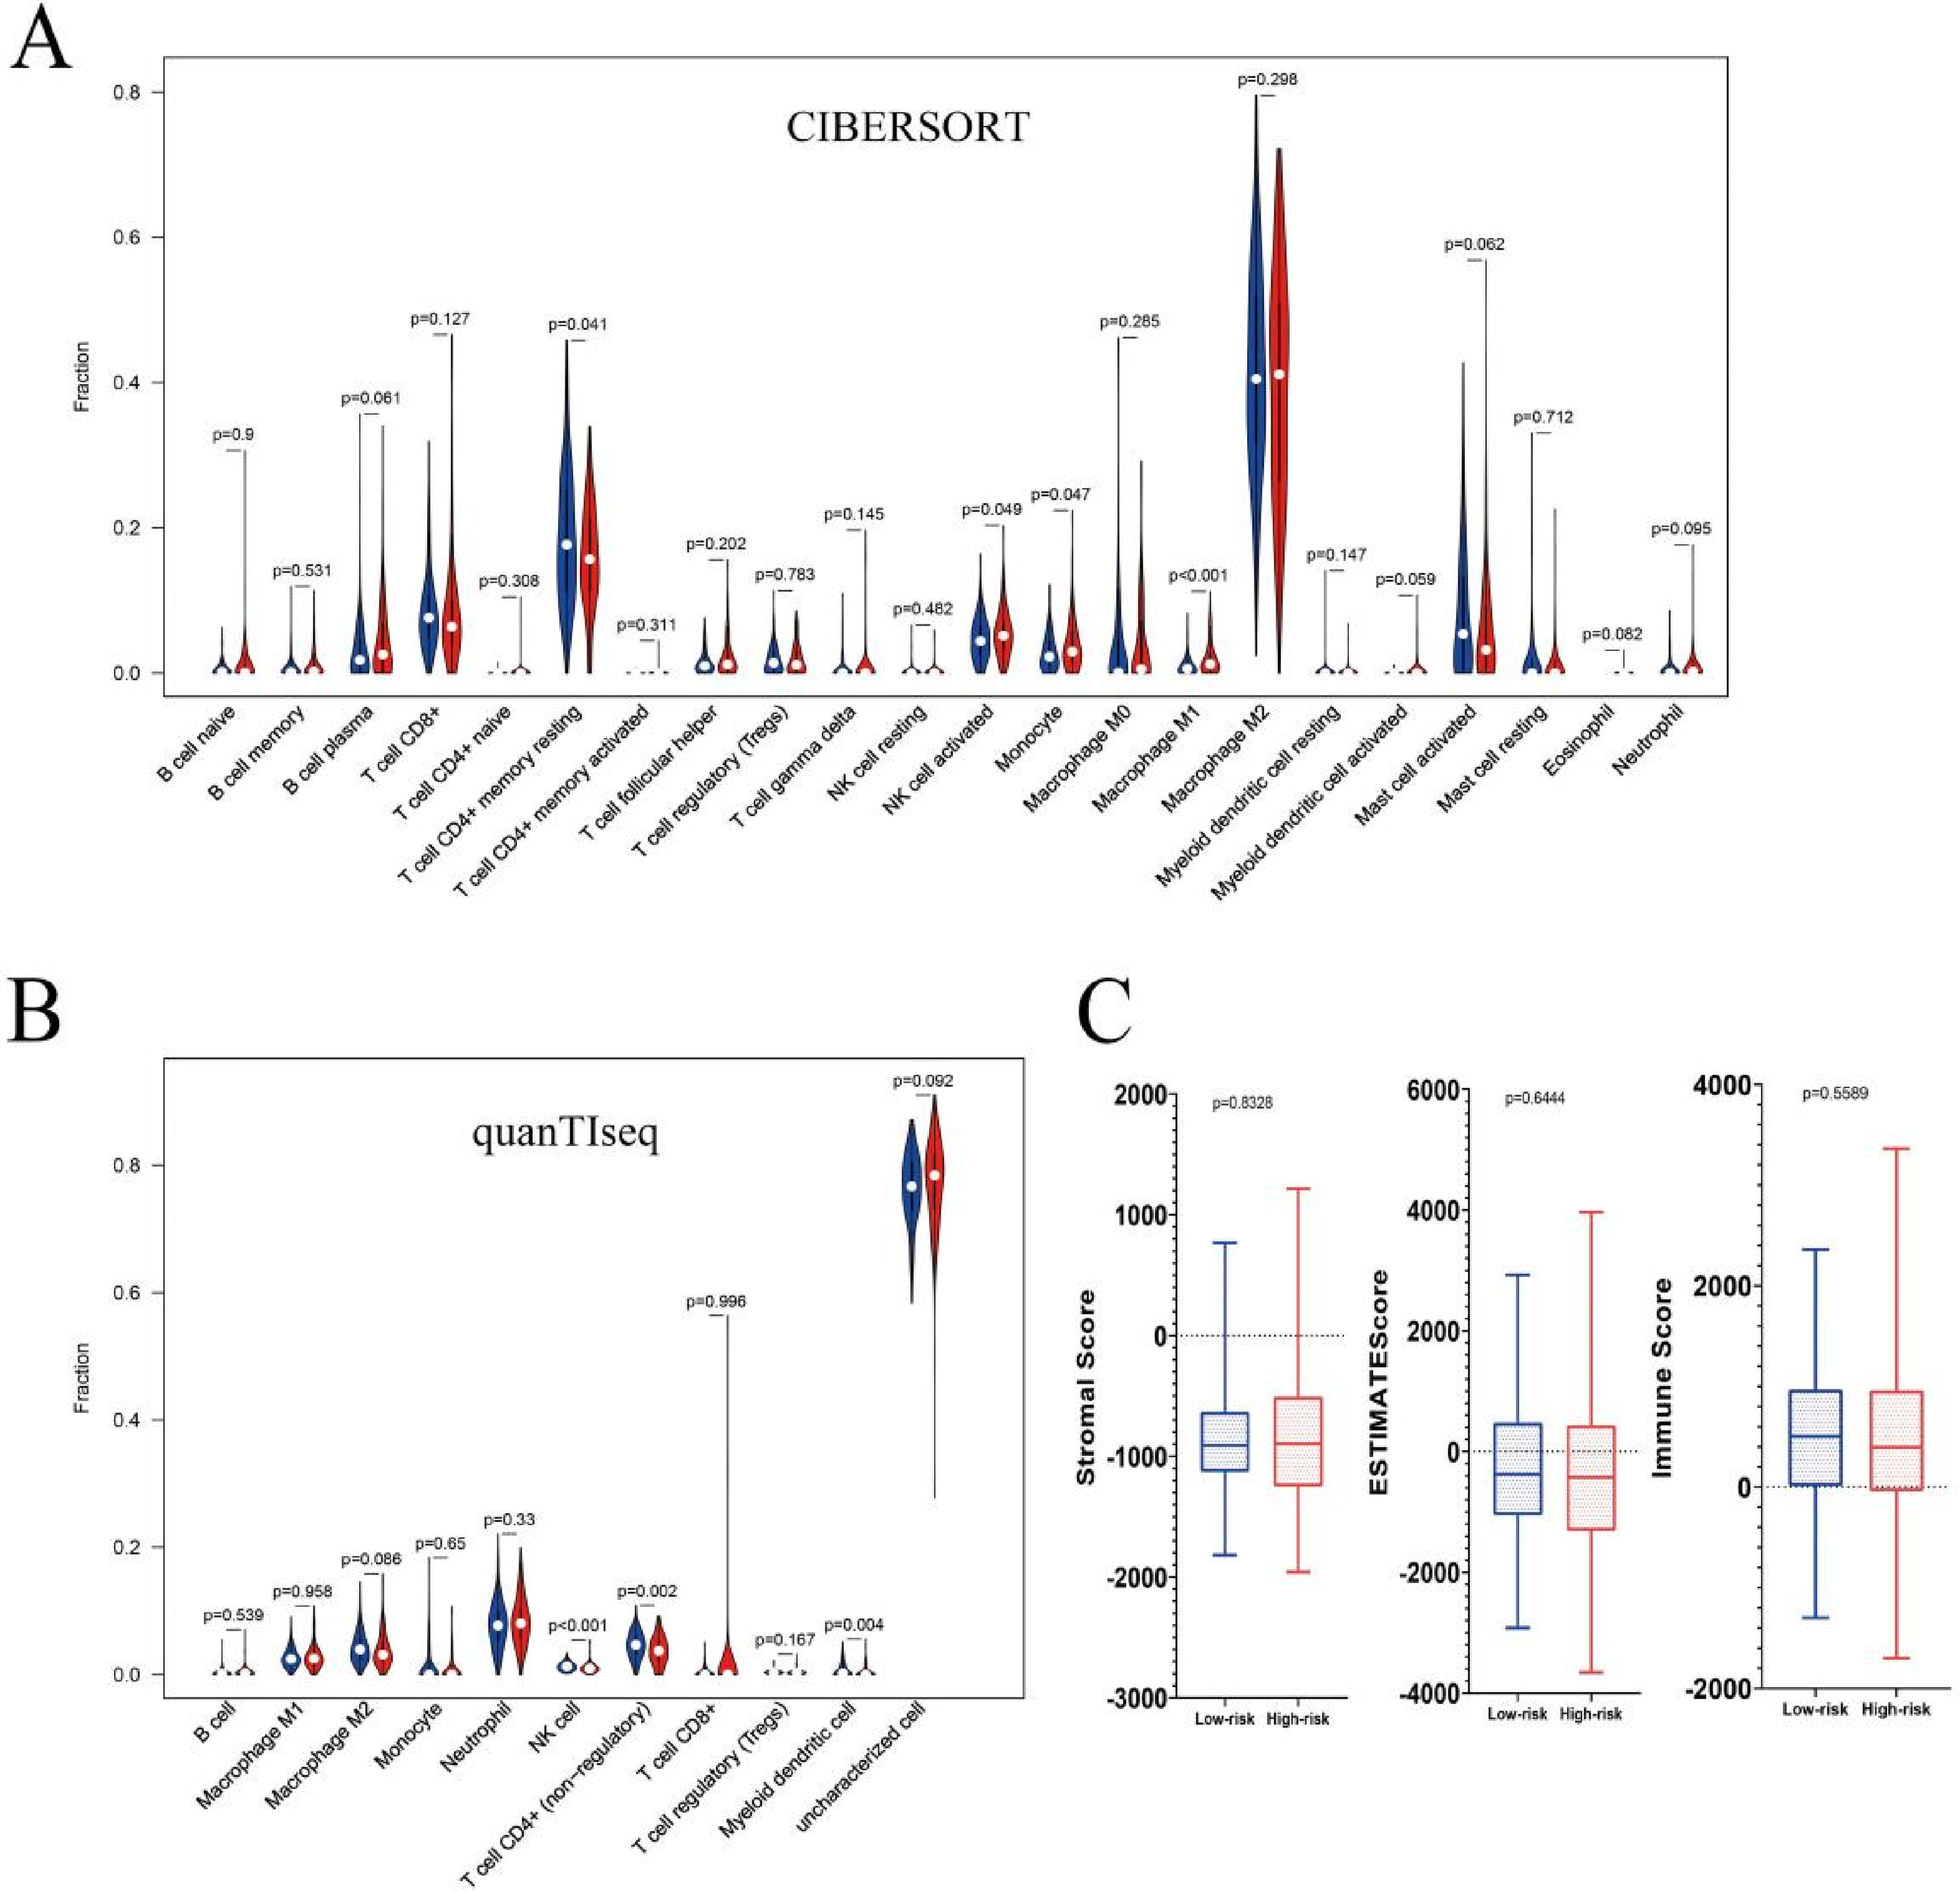
Clinical significance and immune landscape of coagulation subtypes in the TCGA queue. (A) Immune infiltration level obtained based on CIBERSORT algorithm, (B) Immune infiltration level obtained based on quanTIseq algorithm, (C) Stromal score, immune score and estimate score between two coagulation subtypes.
In order to discern the relationship between different coagulation subtypes and the efficacy of immunotherapy, we initiated a comprehensive analysis. The responsiveness to immune checkpoint inhibitors was gauged using multiple criteria, encompassing TMB and TIDE scores, along with the expression levels of immune checkpoint molecules (Figure 7A). In Figure 7B, the IC50 values for Sorafenib, Gemcitabine, Temsirolimus, Sunitinib, 17-AAG, and Cisplatin are presented, with the semi-inhibitory concentration of Cisplatin being notably higher in the low-risk group compared to the high-risk group, indicating that patients in the high-risk group seemed to be more sensitive to the chemotherapeutic regimens containing Cisplatin.

The estimation of two coagulation subtypes in immunotherapy and chemotherapy response. (A) The TIDE score, TME score and TMB score in two prognostic subtypes, (B) The chemotherapy response of two coagulation subtypes for six common chemotherapy drugs.
The Causal Effect of MIEF2 on Therapeutic Response to Cisplatin
To further investigate the relationship between the drug sensitivity of Cisplatin and the 4-gene signature, we performed correlation analysis between them and found that IC50 values for Cisplatin exhibited a markedly positive correlation with the expression of MIEF2 (Figure 8). To verify our findings in vitro, two cell lines for KIRP research were selected, with the Caki-2 cell line modeling the primary tumor and the ACHN cell line modeling the metastatic disease. 25 The effect of Cisplatin treatment on these two cell lines was evaluated by cell proliferation using CCK-8 assay. The IC50 values for Cisplatin treatment on Caki-2 and ACHN cell lines were comparable, presenting 22.90 nM and 24.18 nM, respectively (Figure 9A and C). We then questioned whether MIEF2 had an impact on the therapeutic response for patients to Cisplatin treatment. To address this, we transfected KIRP cell line Caki-2 and ACHN with a small interference RNA (siRNA) for MIEF2 knockdown or a MIEF2-overexpressing plasmid. The efficiency of overexpression and knockdown on both mRNA and protein levels was confirmed by reverse transcription polymerase chain reaction (RT-qRCR) and Western blotting, respectively (Figures 10 and 11). Intriguingly, IC50 values declined after MIEF2 overexpression while increased after MIEF2 knockdown compared to the negative control (NC) in both Caki-2 and ACHN cell lines (Figure 9B and D). These results demonstrated that reduced expression of MIEF2 contributed to improving the drug sensitivity of Cisplatin in vitro, which was consistent with our findings that patients in the high-risk group showed a lower expression of MIEF2 but a stronger response to Cisplatin.
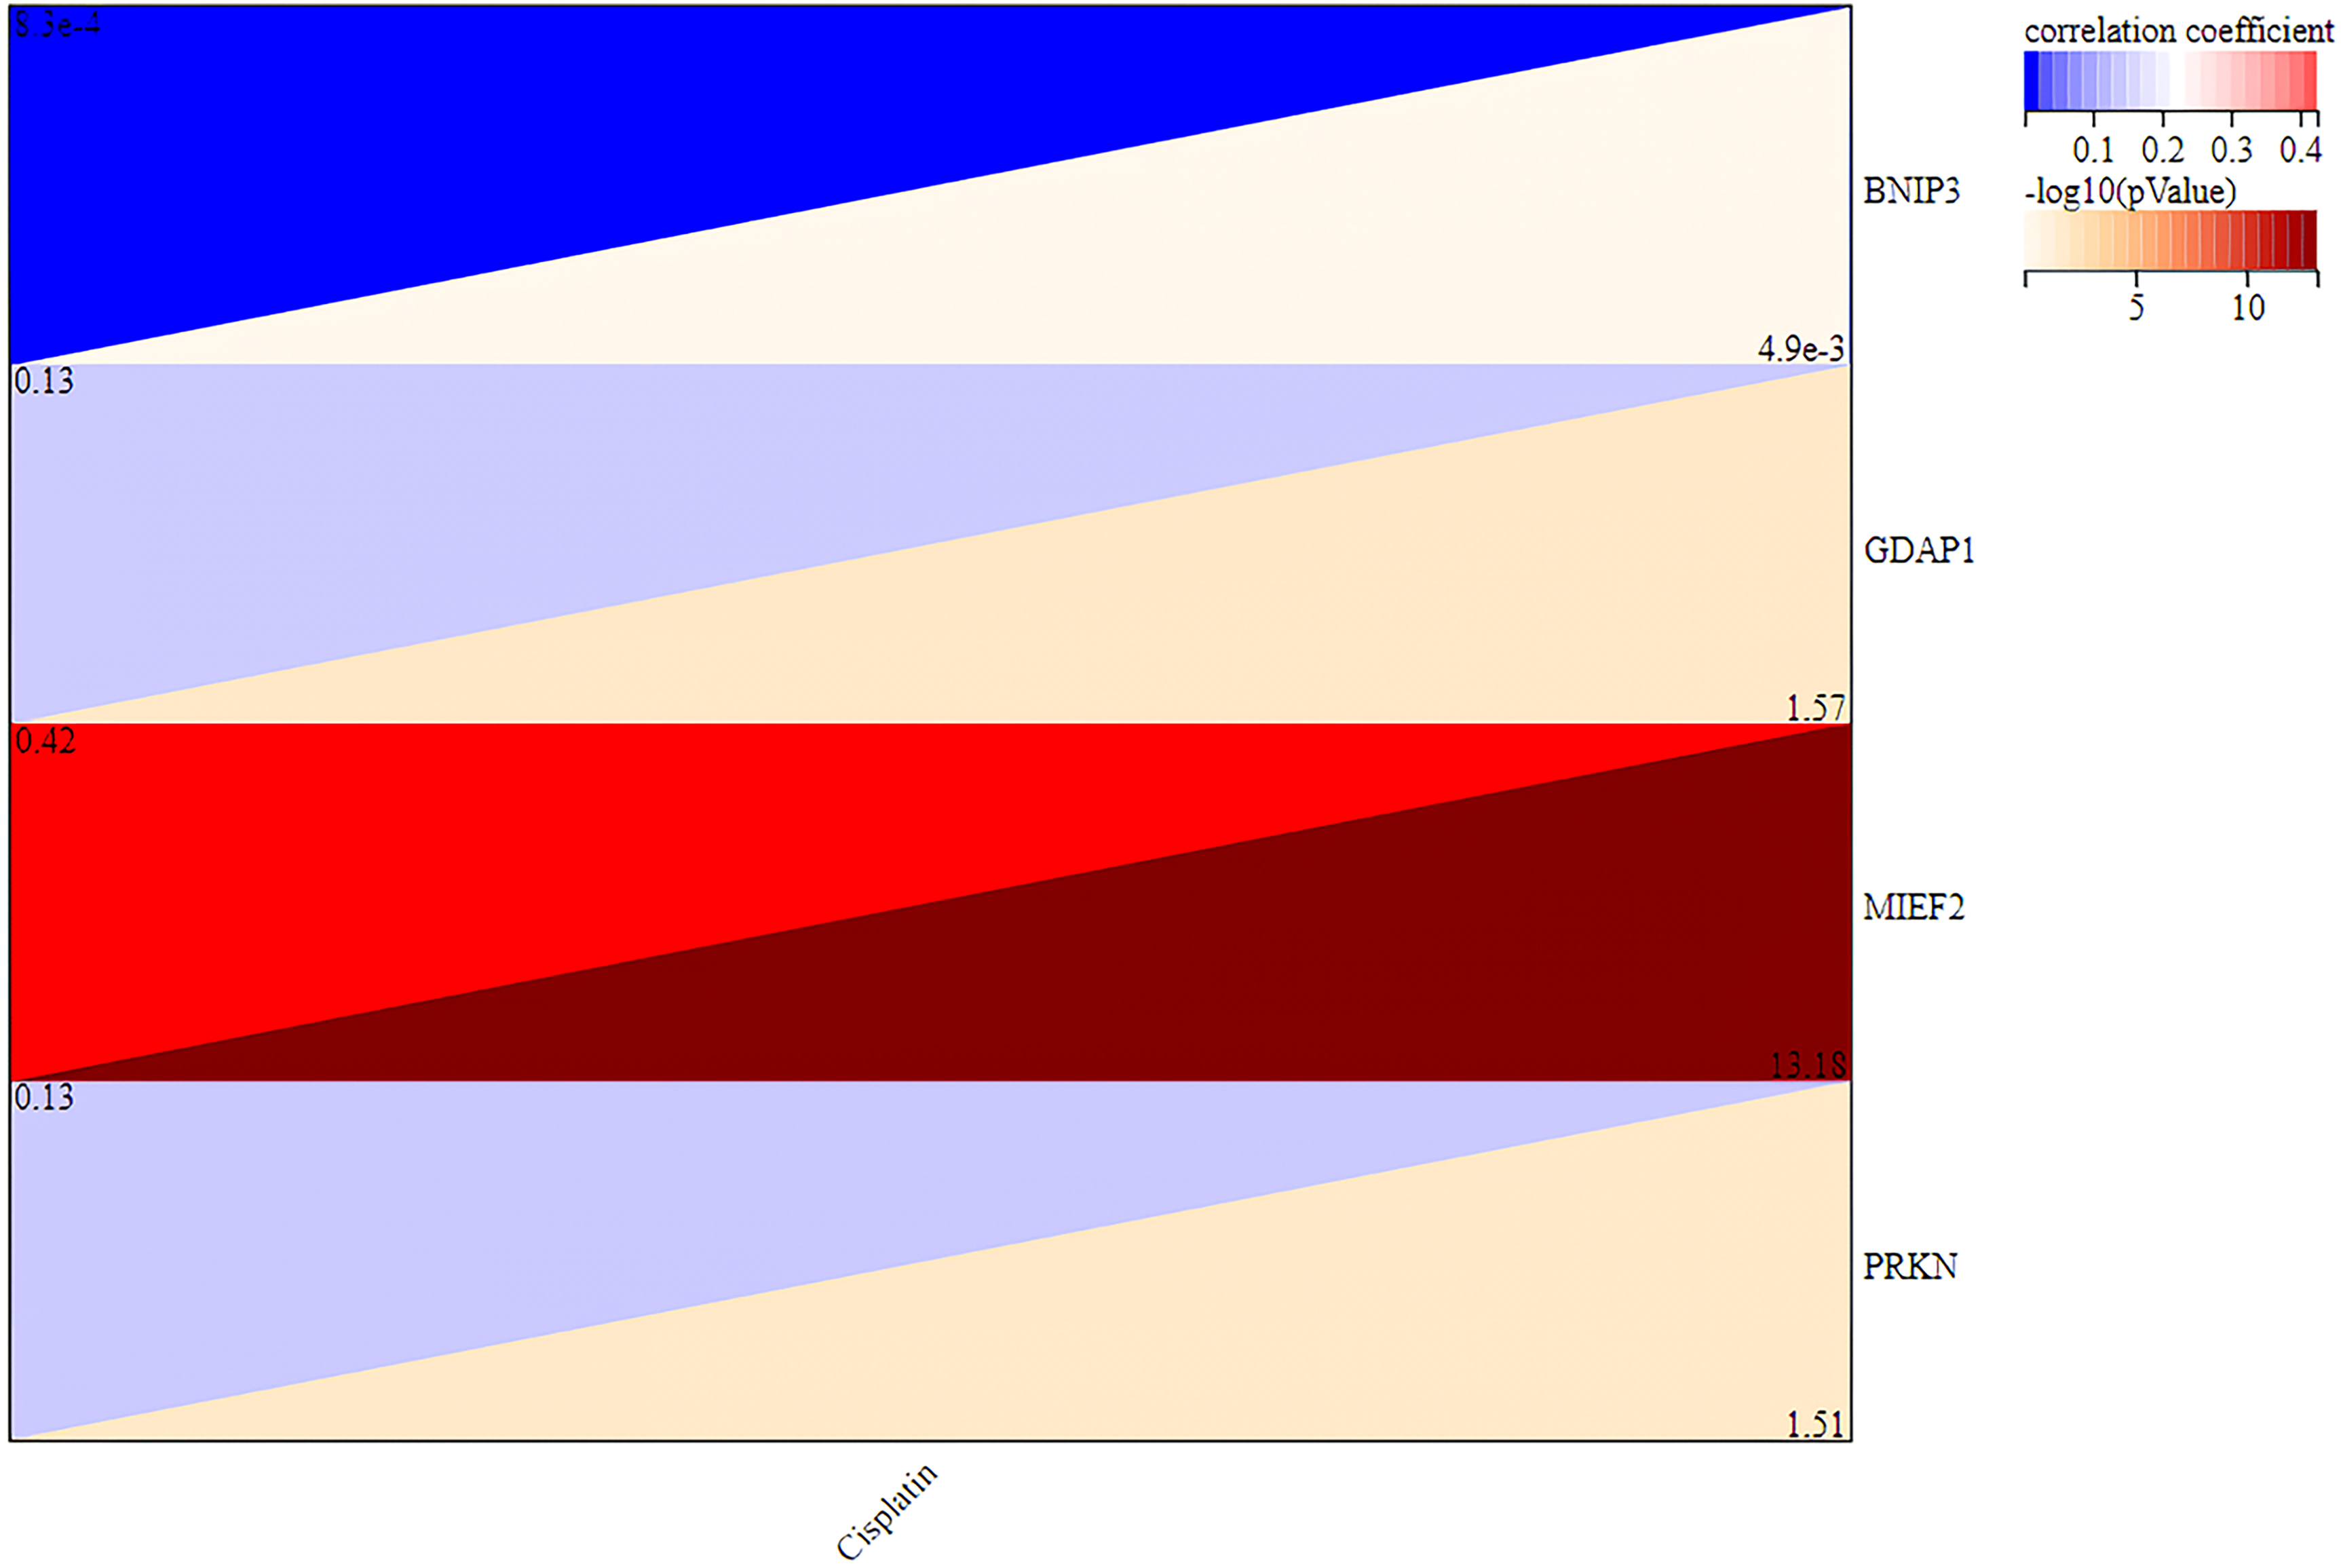
The correlation analysis between the drug sensitivity of Cisplatin and the 4-gene signature.
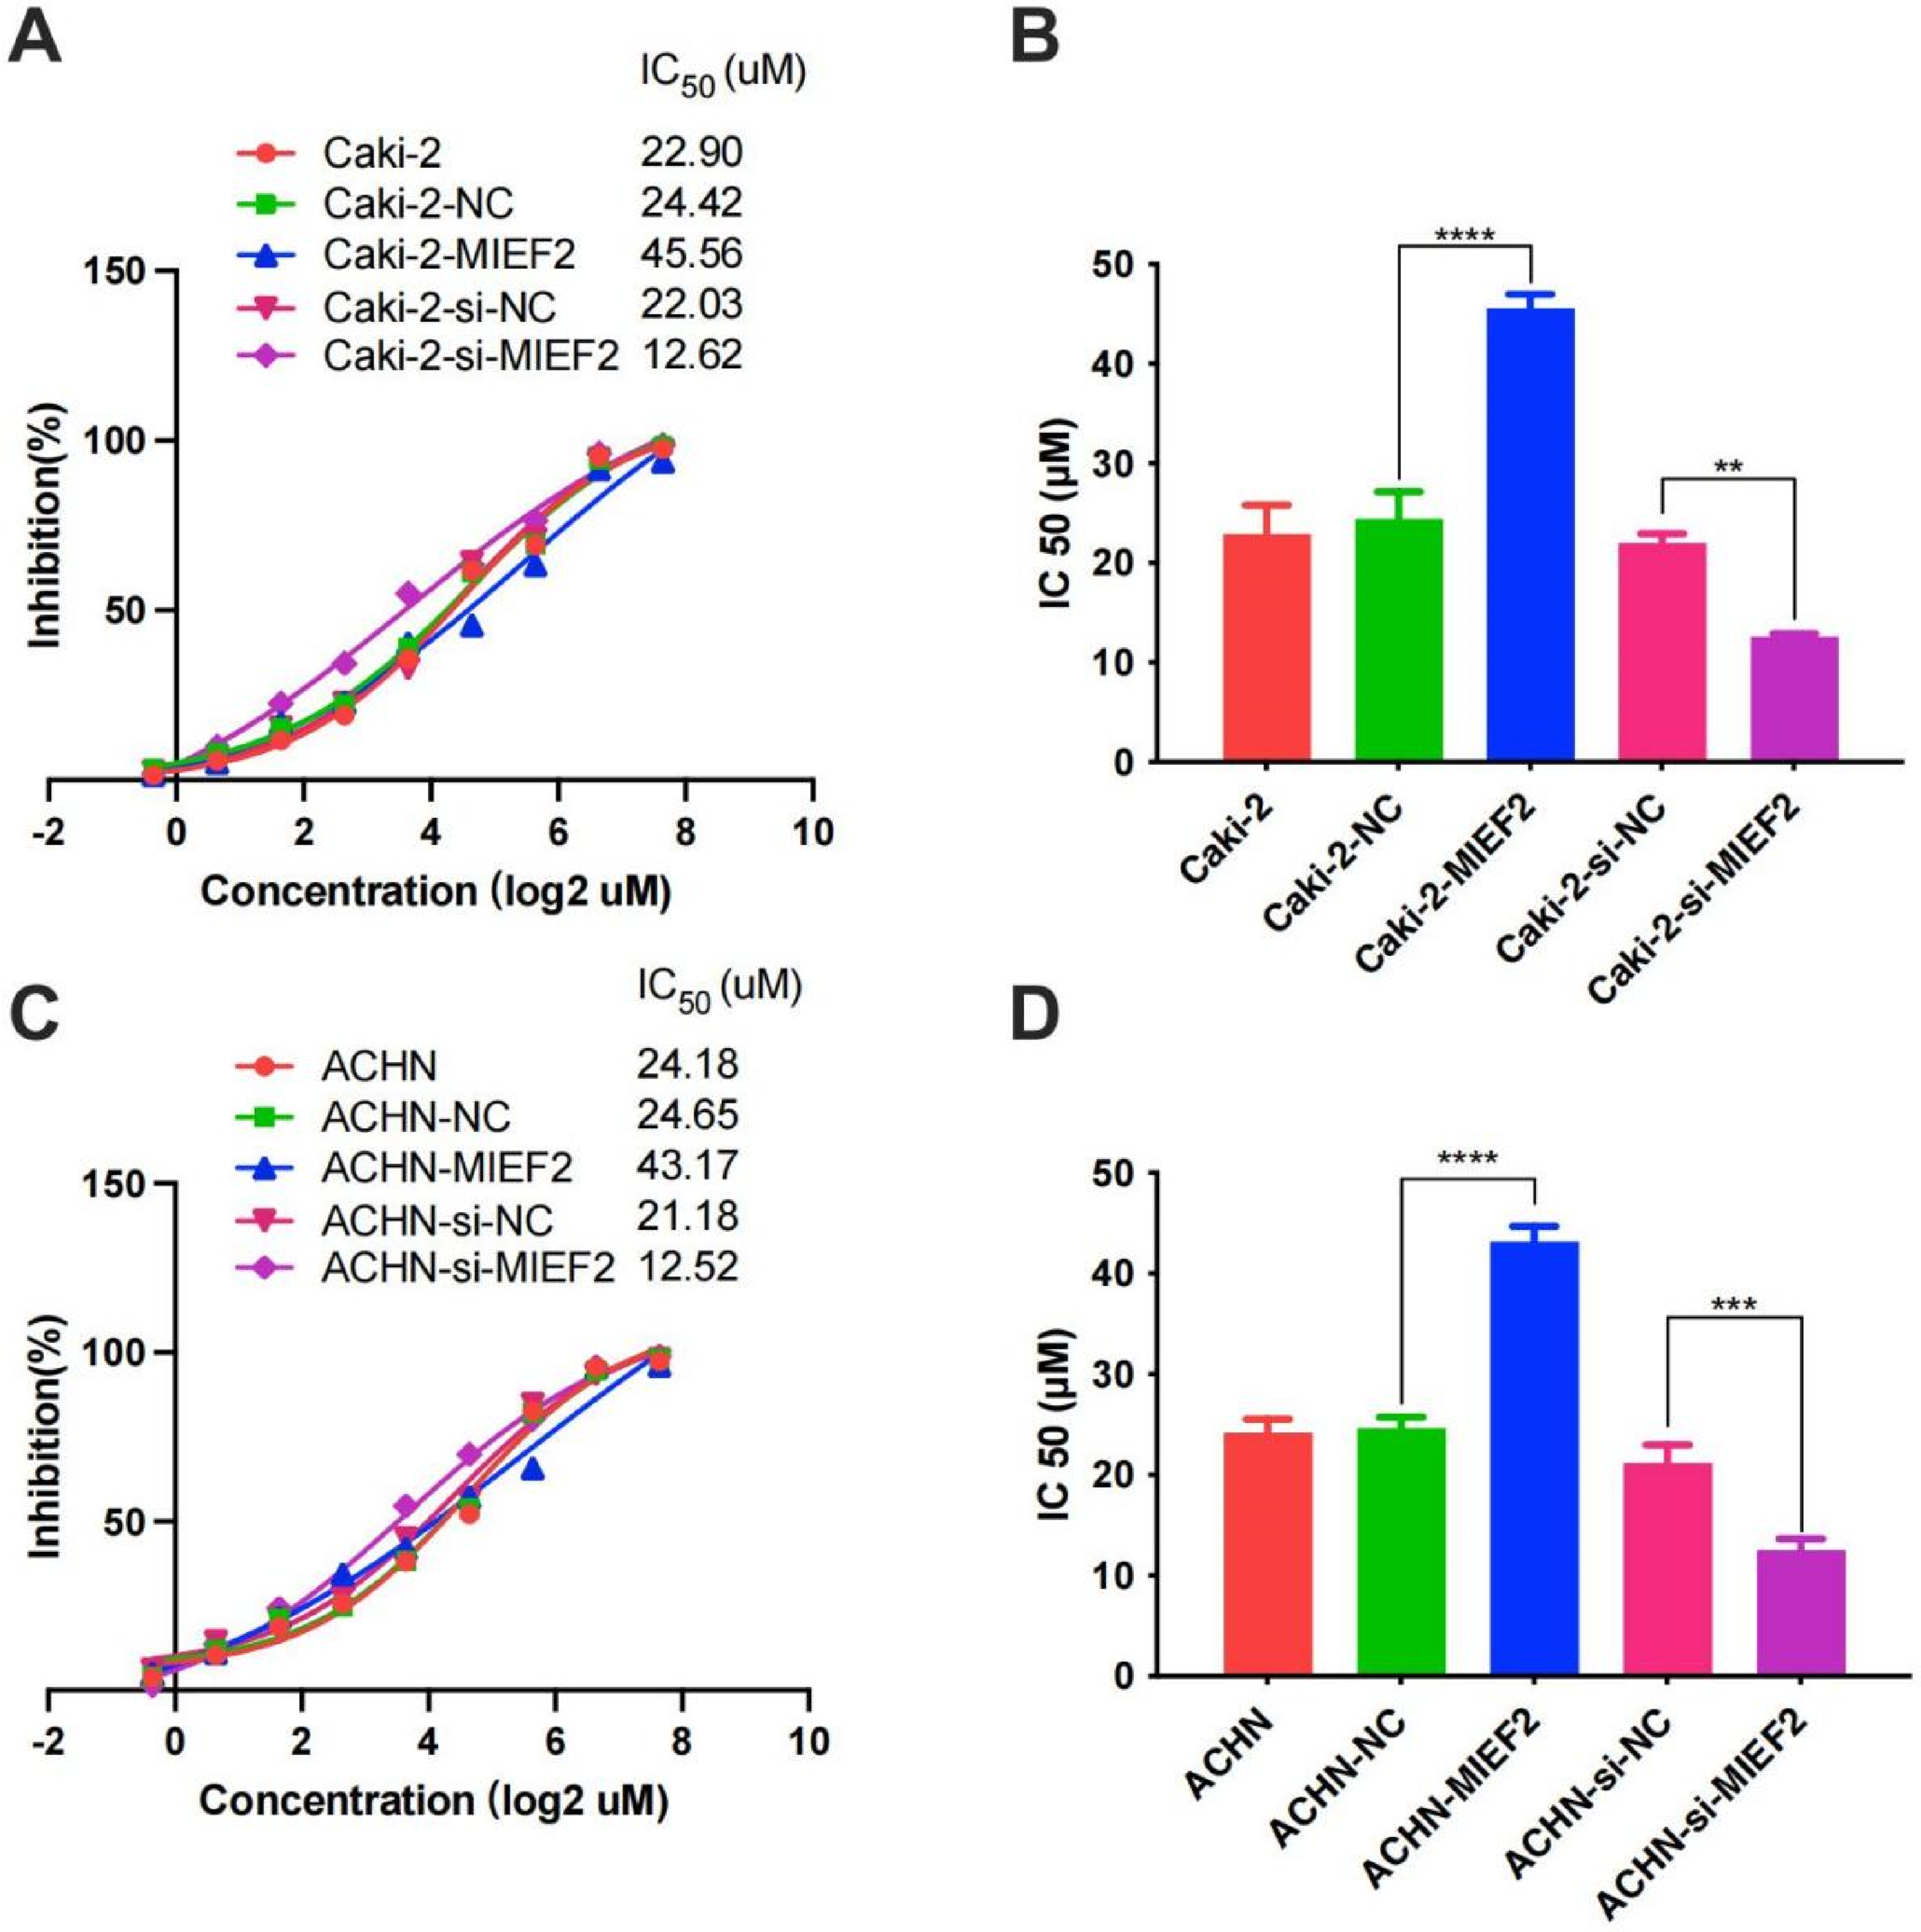
Cellular viability studys. IC50 values for MIEF2 overexpression and interferon in cytotoxicity assays with Caki-2 (A, B) and ACHN (C, D) cells. The cells were transferred with a range of plasmid or small interfering RNA as indicated to assess the cytotoxic activity. (A, C) Cytotoxicity curves of different treatment. All values are averages of replicates expressed relative to cell viability values in untreated cells normalized to 100%. (B, D) The IC50 value of different treatment. Data were presented as mean values ± SD. **indicates P < .01; ***indicates P < .001; ****indicates P < .0001.

The mRNA levels of MIEF2 in Caki-2 (A, B) and ACHN (C, D) cells overexpressed or interfered MIEF2 proteins. Relative mRNA levels of MIEF2 in Caki-2 (A, B) and ACHN (C, D) cells treated as indicated. Data were presented as mean values ± SD. **indicates P < .01; ***indicates P < .001.

The protein expression of MIEF2 in Caki-2 (A, C) and ACHN (B, D) cells overexpressed or interfered MIEF2 proteins. Relative protein levels of MIEF2 (left panel); Western blot of MIEF2 and β-actin (right panel) in Caki-2 (A, C) and ACHN (B, D) cells treated as indicated. Data were presented as mean values ± SD. **indicates P < .01; ***indicates P < .001.
Discussion
KIRP, a major subtype of RCC, is a challenging malignancy to treat using existing therapeutic options. 26 The absence of effective diagnostic and prognostic markers further exacerbates the situation for patients with KIRP.27,28 Consequently, to enhance outcomes for patients with KIRP, it is imperative to investigate the mechanisms underlying KIRP progression and to identify prognostic biomarkers associated with KIRP. While some studies have linked mitochondrial function to drug sensitivity, such research remains underexplored in the context of KIRP. 29 While Cisplatin is a widely used chemotherapeutic agent, its efficacy varies significantly among different cancer types and even among patients within the same cancer type. In the context of Kidney Renal Papillary Cell Carcinoma (KIRP), exploring the sensitivity to Cisplatin is particularly crucial due to the heterogeneous nature of the disease and the lack of effective treatment options for advanced stages. Our study focused on the mitochondrial fusion-related gene expression and its potential impact on Cisplatin sensitivity. We hypothesized that alterations in mitochondrial dynamics, as reflected by changes in the expression of these genes, could influence the cellular response to Cisplatin. This is grounded in the understanding that mitochondrial dysfunction plays a pivotal role in cancer cell metabolism and can affect the cell's ability to cope with the DNA damage induced by Cisplatin. Therefore, by examining the relationship between the gene signature and Cisplatin sensitivity, our aim was to identify potential biomarkers that could predict the response to Cisplatin treatment in KIRP patients. This would not only contribute to a more personalized approach in the management of KIRP but also aid in understanding the molecular mechanisms underlying drug resistance in this cancer subtype.There is an increase in mitochondrial fission and a decrease in mitochondrial fusion events with cancer. Abnormal gene profiling can lead to defects in mitochondrial function that underlie cancer growth. 30 At the same time, these defects can alter gene expression and genomic stability. 31 There is a growing body of evidence suggesting that an imbalance in mitochondrial fission and fusion is linked to cancer.32,33
Several pieces of literature have unveiled the connection between mitochondrial dynamics and cancer 14 ; Chen, et al demonstrated that the biological effects and prognostic significance of abnormal overexpression of Human MTP18 (mitochondrial protein 18 kDa) in hepatocellular carcinoma (HCC). 34 Zhao, J. et al found that managing unregulated Drp1-dependent mitochondrial fission might offer a fresh approach to curbing the spread of breast cancer. 35 Rehman, J. et al have observed an imbalance in the Drp-1/Mfn-2 expression within human lung cancer cell lines, which appears to encourage the condition of mitochondrial fission. 36 These previous studies have identified the correlation between mitochondrial fusion and cancer,but there is not much research on its role in KIRP. BNIP3 was found to exist as a dimer in the cytoplasm and outer membrane of cardiac mitochondria. 37 Niemann, A. et al found that Gdap1 affects the morphology of mitochondria. 38 When expressed at similar levels, both MIEF1 and MIEF2 cause extensive mitochondrial fusion. 39 Regarding PRKN, some studies have shown that PRKN recruits itself to mitochondria through self-association.40,41 Concerning the link between mitochondrial fusion and drug resistance, research by Yaming Du et al has highlighted that overexpression of TRIM32 can enhance drug resistance in non-small cell lung cancer through the regulation of mitochondrial function. 29 Due to the heterogeneity of KIRP, the sensitivity of the chemotherapeutic drugs vary for different patients, understanding the differences in the sensitivity of antineoplastic drugs in KIRP patients can provide new insights for personalized treatment. According to the 4-gene signature we developed, the Cisplatin sensitivity differed significantly between high- and low-risk groups. Furthermore, MIEF2, a gene of our gene signature panel, was found to enhance Cisplatin resistance in vitro. MIEF2 has been reported to promote tumor growth and metastasis in ovarian cancer. 2 This evidence corroborates the dependability of the gene signature panel. Moreover, when considering the risk score derived from the four-gene signatures, the survival rate for the group at lower risk outpaced that of the higher-risk group. The ROC curve shows that this feature has predictive ability (AUC = 0.774). In summary, all data demonstrate the significance of the signatures of these 4 genes in KIRP.
Conclusion
In conclusion, our study has identified a robust gene signature panel composed of four mitochondrial fusion-related genes. This panel is capable of predicting the prognosis of KIRP patients, with elevated risk scores signifying unfavorable survival outcomes. Our findings shed light on the intricate connection between mitochondrial fusion and KIRP, suggesting that the four-gene signature panel holds promise as a valuable prognostic tool in clinical settings. This may aid in the early identification of patients facing poor prognoses.Moreover, we discovered that this panel could potentially forecast cisplatin sensitivity in KIRP, thus paving the way for more targeted and individualized cisplatin treatment approaches in the future. To verify the panel's prognostic relevance in clinical practice, further practical validation studies are warranted.
Current & Future Developments
In our research, by analyzing clinical samples obtained from the TGGA database and Molecular Signatures Database, we uncovered a 4-gene signature panel with the ability to forecast the prognosis of Kidney Renal Papillary Cell Carcinoma. This gene panel exhibits a positive impact on predicting outcomes for KIRP patients. Presently, a vast array of novel anti-tumor drug targets has emerged, with some being derived through data analysis and screening processes. Consequently, the genes identified in our study may serve as prospective targets for the development of innovative therapeutic agents in the future.
Supplemental Material
sj-docx-1-tct-10.1177_15330338241299467 - Supplemental material for The Role of MIEF2 in Cisplatin Sensitivity in KIRP Patients: Insights from Four-gene Mitochondrial Fusion RNA Markers
Supplemental material, sj-docx-1-tct-10.1177_15330338241299467 for The Role of MIEF2 in Cisplatin Sensitivity in KIRP Patients: Insights from Four-gene Mitochondrial Fusion RNA Markers by Yusong Hou, MM, Longyang Jiang, MD, Jing Liu, MM, Dan Wang, MM, and Hongli Luo, MD in Technology in Cancer Research & Treatment
Supplemental Material
sj-docx-2-tct-10.1177_15330338241299467 - Supplemental material for The Role of MIEF2 in Cisplatin Sensitivity in KIRP Patients: Insights from Four-gene Mitochondrial Fusion RNA Markers
Supplemental material, sj-docx-2-tct-10.1177_15330338241299467 for The Role of MIEF2 in Cisplatin Sensitivity in KIRP Patients: Insights from Four-gene Mitochondrial Fusion RNA Markers by Yusong Hou, MM, Longyang Jiang, MD, Jing Liu, MM, Dan Wang, MM, and Hongli Luo, MD in Technology in Cancer Research & Treatment
Footnotes
Abbreviations
Acknowledgments
Consent to Participate
Not applicable.
Consent for Publication
Not applicable.
Data Availability
The data that support the findings of this study are available from the corresponding author, [YSH], upon reasonable request.
Declaration of Conflicting Interests
The authors declared no potential conflicts of interest with respect to the research, authorship, and/or publication of this article.
Ethical Considerations
Not applicable.
Funding
The authors disclosed receipt of the following financial support for the research, authorship, and/or publication of this article: This work was supported by Science & Technology Department Sichuan Province Foundation of China (Grant No. 2023JDKP0040) and Doctoral Research Initiation Fund of Affiliated Hospital of Southwest Medical University.
Supplemental Material
Supplemental material for this article is available online.
References
Supplementary Material
Please find the following supplemental material available below.
For Open Access articles published under a Creative Commons License, all supplemental material carries the same license as the article it is associated with.
For non-Open Access articles published, all supplemental material carries a non-exclusive license, and permission requests for re-use of supplemental material or any part of supplemental material shall be sent directly to the copyright owner as specified in the copyright notice associated with the article.