
Abstract
IGFBP6, a member of the IGF binding protein (IGFBP) family, is a specific inhibitor of insulin-like growth factor II (IGF-II) and can inhibit the growth of malignant tumors overexpressing IGF-II. Type 2 diabetes (T2D) is a basic disorder of glucose metabolism that can be regulated by IGF-related pathways. We performed bioinformatics analysis of the TCGA database to explore the possible mechanism of IGFBP6 in breast cancer (BC) metabolism and prognosis and collected clinical samples from BC patients with and without T2D to compare and verify the prognostic effect of IGFBP6. In our study, the levels of IGFBP1–6 were positively correlated with overall survival (OS) in patients with breast cancer. IGFBP6 was upregulated in estrogen receptor (ER)-positive BC, and ER-positive and progesterone receptor (PR) positive patients had a higher expression level of IGFBP6 than ER-negative and PR-negative patients. IGFBP6 could be used as an independent prognostic factor in BC. The expression of IGFBP6 was decreased in BC tissue, and BC tissue from patients with T2D had lower IGFBP6 expression levels than BC tissue from patients without T2D. IGFBP6 is mainly involved in the PI3K–Akt and TGF-β signaling pathways and tumor microenvironment regulation. In terms of metabolism, the expression of IGFBP6 was negatively correlated with that of most glucose metabolism-related genes. IGFBP6 expression was mainly correlated with mutations in TP53, PIK3CA, CDH1, and MAP3K1. In addition, the upregulation of IGFBP6 in BC increased the drug sensitivity to docetaxel, paclitaxel and gemcitabine. Overall, these results indicated that high expression of IGFBP6 is associated with a good prognosis in BC patients, especially in those without T2D. It is not only involved in the maintenance of the tumor microenvironment in BC but also inhibits the energy metabolism of cancer cells through glucose metabolism-related pathways. These findings may provide a new perspective on IGFBP6 as a potential prognostic marker for BC.
Introduction
Insulin-like growth factors (IGF-I and IGF-II) are crucial cytokines that modulate cell growth and metabolism.1,2 Dysregulation of the IGF system drives the development and progression of many diseases, such as cancer and diabetes.3-8 Six types of IGF-binding proteins (IGFBPs 1-6) can directly bind to IGF outside the cell to form a complex, thereby reducing the binding of IGF to IGF receptors (IGFRs) or indirectly regulating IGFs through other extracellular pathways. In addition to the regulation of IGFs, some IGFBPs can activate intracellular signaling pathways by entering the nucleus and regulating transcription by binding to nuclear receptors, leading to a chain of cellular outcomes, including the suppression of cell growth and the regulation of cell migration and apoptosis.9-11
IGFBP6, a specific IGF-II inhibitor, has a much greater affinity for IGF-II than for IGF-I and can inhibit the growth of malignancies overexpressing IGF-II, such as rhabdomyosarcoma and neuroblastoma.12,13 Additionally, IGFBP6 can regulate cancer cells independently of the IGF pathway, like other IGFBPs. For instance, IGFBP6 can inhibit VEGF-induced angiogenesis in vitro. 14 Thus, the effects of IGFBP6 on cancer are twofold and need to be further investigated.
Type 2 diabetes mellitus (T2D) is a basic disorder of glucose metabolism. Patients who have T2D usually have an obviously increased risk of various cancers, and their prognosis is worse than that of those without T2D. 15 The pathogenesis of T2D mainly involves insulin resistance and IGF-related pathways. 16 In addition, the serum levels of the IGF-I and IGF-IR mRNAs were increased in colorectal cancer patients with T2D, while the IGFBP6 levels were decreased in both serum and cancer tissues. 17 This evidence suggested that IGFBP6 might play a role in diabetes-related carcinogenesis.
As the most common malignancy in women, breast cancer (BC) threatens the health and quality of life of women worldwide. The expression of IGFBP6 in breast cancer is related to hormones 18 and is involved in remodeling of the tumor microenvironment (TME) in BC. 19 A recent study revealed that IGFBP6 is involved in the lactic acid signaling pathway in glucose metabolism and plays a role in regulating lactic acid metabolism and oxidative stress. 20 Therefore, we explored the possible mechanisms of IGFBP6 in the metabolism and prognosis of breast cancer via bioinformatics analysis of an online database, and clinical samples from BC patients with or without T2D were also collected to compare and verify the prognostic value of IGFBP-6. Thus, new insights into the role of IGFBP6 in BC were obtained from the perspective of glucose metabolism.
Materials and Methods
Patients and Specimens
TCGA-breast invasive carcinoma (BRCA) cohort: Clinical baseline and gene expression data were collected from the UCSC Xena Gene Bank (https:///xenabrowser.net\/hub\/). This cohort contained both normal breast tissue (n = 113) and BC tissue (n = 1091). Data conversion was performed via the “IlluminaHumanv4.db” (version 1.26.0) R package.
Validation cohort: From January 2015 to October 2017, 71 formalin-fixed paraffin-embedded specimens from BC patients, including 25 BC patients with T2D and 46 BC patients without T2D, were collected from a local hospital. All patients had at least 5 years of follow-up data. The end point of the follow-up investigation was distant metastasis or recurrence. The clinical baseline data of this cohort are shown in Table 1. The patients provided their written informed consent to participate in this study and subsequent publication for the retrospective study. The study was reviewed and approved by The Ethics Committee of Renmin Hospital of Wuhan University (No. WDRY2021-KS009, Date: 2021.7.26). The reporting of this study conforms to REMARK guidelines. 21
Baseline of Clinical Patient Cohort

Abbreviations: ER, estrogen receptor; PR, Progesterone receptor; AJCC, American Joint Committee on Cancer; T2D, Type II diabetes.
Kaplan-Meier Plotter Webtool
The Kaplan–Meier (KM) Plotter website (https://kmplot.com) (including the TCGA, GEO and EGA databases) was used to evaluate the relationship between IGFBP6 mRNA expression and prognosis in BC patients. High and low expression were distinguished in accordance with the best cutoff value.
Functional Exploration
Differential gene analysis was performed for the high and low IGFBP6 expression groups using the “limma” R package. Genes with FC > 1.5 or FC < 2/3 were considered upregulated or downregulated genes, respectively. A heatmap was generated to visualize the differentially expressed genes. The R software package (clusterProfiler, version 4.2.2) was used for Kyoto Encyclopedia of Genes and Genomes (KEGG) and Gene Ontology (GO) pathway enrichment analyses.
Profiling of Immune Status
The Tumor Immune Estimation Resource (TIMER) (https://cistrome.shinyapps.io/timer/) and the CIBERSORT (version 0.1.0) algorithm were used to analyze the correlation between immune cells and IGFBP6.
Mutation Analysis
The “maftools” package (version 2.10.05) was utilized to analyze and visualize the association between IGFBP6 expression and gene mutations according to the somatic mutation data in BC samples.
Oncogenic Pathway Analysis
The “pROGENY” package (version 0.99.0), an R package, was used to analyze the enrichment of IGFBP6-related genes in 14 cancer-related pathways based on transcriptome data.
Chemotherapy Drug Therapeutic Response
The “pRRophetic” package (version 0.5) was used to determine the IC50 of common chemotherapeutic agents using RNA-seq data from the TCGA-BRCA cohort. IC50 comparisons between the low- and high-IGFBP6 groups were performed via the Wilcoxon rank test.
Immunohistochemistry
For immunohistochemistry (IHC), stained images were evaluated using ImageJ IHC profiler software. The percentage of positively stained cells was determined, and the staining intensity score was evaluated as 0 (negative staining) or 1 (positive staining). The following formula was used to determine protein staining scores: total score = percentage score × intensity score. The median expression score was used to classify expression as negative or positive.
Statistical Analysis
One-way ANOVA and Student's t test were performed to compare the mean values of IGFBP6 expression in each group. The associations between IGFBP6 expression and baseline clinical features were assessed by the chi-square test. Spearman correlation analysis was used to assess the associations between IGFBP6 expression and clinical characteristics. The above analysis was performed using R version 4.0.0. P < 0.05 was considered to indicate statistical significance. All experiments were performed in accordance with relevant guidelines and regulations.
Results
Transcriptional Profile of IGFBP6 in Breast Cancer Subgroups
A flowchart of the study is presented in Figure 1. First, we analyzed the transcript level of IGFBP6 in carcinoma tissues compared with that in normal tissues for 26 malignant tumor types in the TCGA (Figure 2A). IGFBP6 expression was upregulated in 5 cancers and downregulated in 16 cancers, including BC. Second, subgroup analysis of BC (TCGA-BRCA cohort) was performed to investigate the expression characteristics of IGFBP6. The results showed that the ER-positive and progesterone receptor (PR) positive patients had greater expression levels of IGFBP6 than did the ER-negative and PR-negative patients (Figure 2C, E). According to the subtypes of BC, the expression of IGFBP6 in normal-like and luminal A patients was greater than that in HER2+, basal-like and luminal B patients (Figure 2D). In addition, HER2 expression status and stage were correlated with IGFBP6 expression (Figure 2F, G). However, IGFBP6 was not significantly correlated with age (Figure 2B).

Flowchart of the study.

IGFBP6 transcriptional expression in breast cancer subgroups. (A) IGFBP6 transcriptional expression in 26 cancer types as compared to normal tissues in TCGA data. (B-G) IGFBP6 transcriptional expression according to different subgroup analysis in breast cancer, (B) age, (C) ER status, (D) molecular subtype, (E) PR status, (F) HER2 + status, (G) stage. The statistical difference was compared through the one-way ANOVA and student t-test. GBM, glioblastoma multiforme; GBMLGG, glioma; LGG, brain lower grade glioma; CESC, cervical squamous cell carcinoma and endocervical adenocarcinoma; LUAD, lung adenocarcinoma; COAD, colon adenocarcinoma; COADREAD, colon adenocarcinoma/rectum adenocarcinoma; BRCA, breast invasive carcinoma; ESCA, esophageal carcinoma; STES, stomach and esophageal carcinoma; KIRP, kidney renal papillary cell carcinoma; KIPAN, pan-kidney cohort; STAD, stomach adenocarcinoma; PRAD, prostate adenocarcinoma; UCEC, uterine corpus endometrial carcinoma; HNSC, head and neck squamous cell carcinoma; KIRC, kidney renal clear cell carcinoma; LUSC, lung squamous cell carcinoma; LIHC, liver hepatocellular carcinoma; THCA, thyroid carcinoma; READ, rectum adenocarcinoma; PAAD, pancreatic adenocarcinoma; PCPG, pheochromocytoma and paraganglioma; BLCA, bladder urothelial carcinoma; KICH, kidney chromophobe; CHOL, cholangiocarcinoma; ER, estrogen receptor; PR, progesterone receptor. *p < 0.05; **p < 0.01; ***p < 0.001; ****p < 0.0001.
Prognostic Analysis of IGFBP6 in BC
We used the KM Plotter online database to analyze the prognostic value of the protein levels of IGFBP1–6 in all breast cancer RNA-seq datasets, including the TCGA datasets, and the results showed that all these proteins were positively correlated with overall survival (OS) in patients with breast cancer (
Supplementary Figure 1
). We selected IGFBP6 for further analysis. In the TCGA-BRCA cohort, overall survival (OS) and recurrence-free survival (RFS) data were used to construct Kaplan–Meier (KM) curves to analyze the role of IGFBP6 in the prognosis of BC. In general, a high expression level of IGFBP6 was correlated with a good prognosis in BC patients according to OS (P < 0.001) (Figure 3A, G). According to the subgroup analysis, patients with high IGFBP6 expression had better OS in the luminal A BC subgroup (P = 0.0044) (Figure 3D
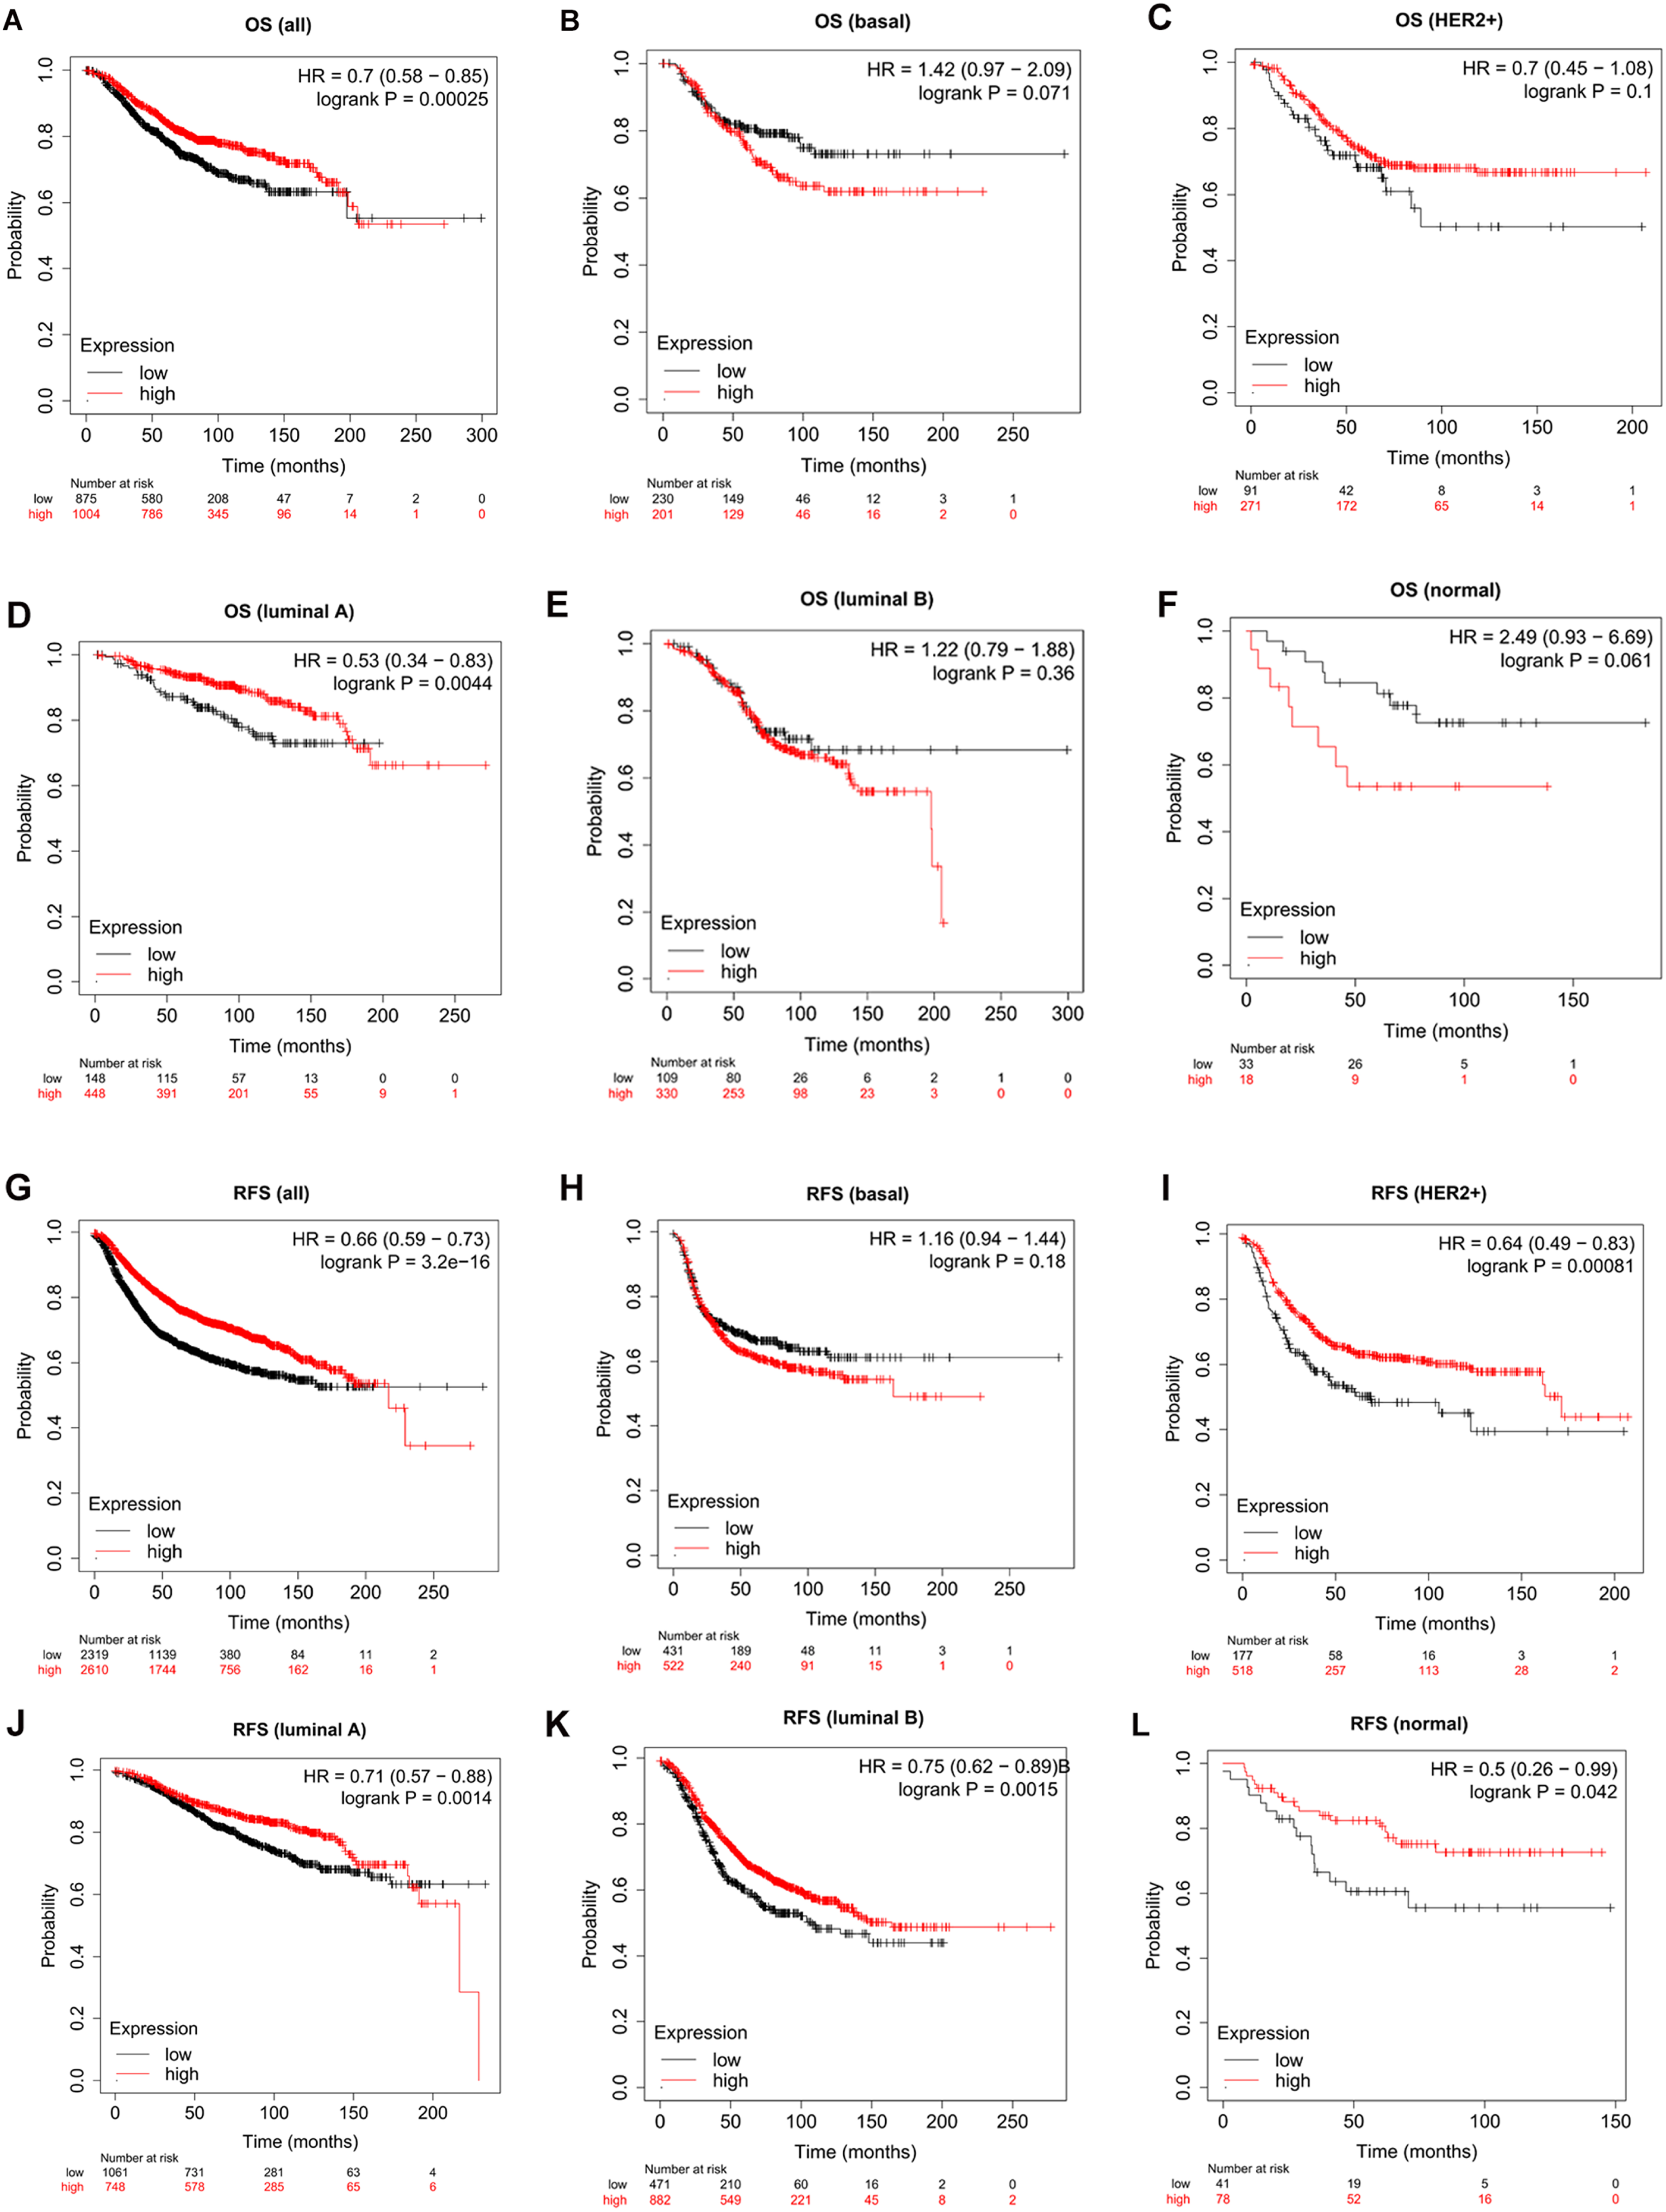
Prognostic analysis of IGFBP6 in breast cancer according to different molecular subtypes using the kaplan-meier plotter. Microarray data from Kaplan-Meier (KM) online mapping tool was performed for analysis. (A-F) OS curves of (A) all, (B) basal-like, (C) HER2+, (D) luminal A, (E) luminal B, (F) normal-like subtypes. (G-L) RFS curves of (G) all, (H) basal-like, (I) HER2+, (J) luminal A, (K) luminal B, (L) normal-like subtypes. OS, overall survival; RFS, recurrence free survival. “Probability” means “survival probability”.
Furthermore, in the validation cohort, IGFBP6 expression was evaluated in 71 BC patients by IHC to verify its correlation with the prognosis of BC patients. According to the IHC results, IGFBP6 was mainly localized in the cytoplasm of BC cells (Figure 4A

Validation of the prognostic value of IGFBP6 in clinical patient cohort. (A) Representative immunohistochemistry staining images of IGFBP6. (B) IGFBP6 expression in T2D group and non-T2D group according to IHC staining intensity scores. (C) RFS curves for high-IGFBP6 expression and low-IGFBP6 expression patients. (D) RFS curves for T2D group and non-T2D group. (E) RFS curves for high-/ low-IGFBP6 expression groups and T2D/non-T2D groups. T2D, type 2 diabetes; RFS, recurrence free survival. T2D + IGFBP6-High: T2D and high-IGFBP6 expression patients; T2D + IGFBP6-Low: T2D and low-IGFBP6 expression patients; T2D- IGFBP6-High: non-T2D and high-IGFBP6 expression patients; T2D- IGFBP6- Low: non-T2D and low-IGFBP6 expression patients.
Cox Regression Analyses in Clinical Patient Cohort

Abbreviations: ER, estrogen receptor; PR, Progesterone receptor; AJCC, American Joint Committee on Cancer; T2D, Type II diabetes.
Prognostic Analysis of IGFBP6 in the T2D Group and non-T2D Group
The patients in the validation cohort were divided into a T2D group (n = 25) and a non-T2D group (n = 46). Patients in the T2D group had higher IGFBP6 expression than did those in the non-T2D group (Figure 4B
Functional Analysis of IGFBP6-Related Genes in BC
To screen the differentially expressed genes (DEGs) related to IGFBP6 in the TCGA-BRCA cohort (Figure 5A), genes with a FC > 1.5 or FC < 2/3 were considered upregulated and downregulated genes, respectively; a heatmap was constructed to visualize the distribution of these genes in tumor and normal cells (Figure 5B

Functional analysis of IGBPF6 in breast cancer. (A) Volcanic map of DEGs in high and low IGFBP6 expression groups in TCGA breast cancer specimens. (B) Heatmaps of differentially expressed IGFBP6-related mRNAs. (C) Circle plot of KEGG pathway of Golgi associated DEGs. (D) Biological Process of GO enrichment of Golgi apparatus-related DEGs. (E) Cellular Component of GO enrichment of Golgi apparatus-related DEGs. (F) Molecular Function of GO enrichment of Golgi apparatus-related DEGs. DEGs, differentially expressed genes; KEGG, Kyoto Encyclopedia of Genes and Genomes; GO, Gene Ontology.
Correlation Between IGFBP6 Expression and Immune Cell Infiltration
We used TIMER and CIBERSORT to analyze the associations between IGFBP6 expression and immune cell levels in the TCGA-BRCA cohort. The TIMER results showed that the expression of markers of CD4+ T cells and macrophages was positively correlated with IGFBP6 expression, but the expression of B cell markers was negatively correlated with IGFBP6 expression (Figure 6A). The tumor immune activity in the high-IGFBP6 expression group was greater than that in the low-IGFBP6 expression group (Figure 6B). The results of CIBERSORT analysis showed that IGFBP6 expression was positively correlated with the levels of activated memory CD4+ T cells, helper follicular T cells, delta gamma T cells, M0-M2 macrophages and eosinophils and negatively correlated with the levels of naive B cells, plasma cells, CD8+ T cells, resting NK cells, resting dendritic cells and resting mast cells (Figure 6C).

Correlation analysis between IGBPF6 and immune status. (A-B) Correlation analysis between IGBPF6 and immune cell types by TIMER algorithm. (C) Correlation analysis between IGBPF6 and immune cell types by CIBERSORT algorithm. TIMER, Tumor Immune Estimation Resource. *p < 0.05; **p < 0.01; ***p < 0.001; ****p < 0.0001.
IGFBP6 and Glycolipid Metabolism-Related Genes
Among the genes related to glycolysis and the pentose phosphate pathway, SLC2A1, TPI1, ENO1, PGAM1, LDHA, G6PD and TKT were negatively correlated with IGFBP6 expression (Figure 7A). Among the genes related to fatty acid oxidation and glutamine metabolism, ACADVL was positively associated with IGFBP6, while ACADM and CTP2 were negatively correlated with IGFBP6 (Figure 7B).

Correlation analysis between IGBPF6 and genes related to metabolism-related gene. (A) Correlation analysis between IGBPF6 and genes related to glycolysis and pentose phosphate pathway. (B) Correlation analysis between IGBPF6 and genes related to fatty acid oxidation and glutamine metabolism. *p < 0.05; **p < 0.01; ***p < 0.001; ****p < 0.0001.
Mutational Landscape of BC According to IGFBP6 Expression
The differences in gene mutations according to IGFBP6 expression are shown in Figure 8. Compared with that in the low IGFBP6 expression group, the mutation rate of TP53 was significantly lower in the high IGFBP6 expression group, while the mutation frequencies of PIK3CA, CDH1, and MAP3K1 were significantly greater in this group.

Mutational landscape in breast cancer according to IGBPF6. Comparison of the mutational landscape between with high and low IGBPF6 expressed groups. Differences in gene mutation frequency were analysed by chi-square test.
Correlations Between IGFBP6 and Oncogenic Pathways
Among the classical tumor signaling pathways, the androgen-related pathway, EGFR-related pathway, estrogen-related pathway, MAPK-related pathway, NFkB-related pathway, P53-related pathway, TGFβ-related pathway, TNFα-related pathway, Trail-related pathway and WNT-related pathway were positively correlated with IGFBP6, while only the PI3K-related pathway was negatively correlated with IGFBP6 (Figure 9).

Correlation analysis of IGBPF6 and oncogenic pathway. Association of key genes of common oncogenic pathways with IGFBP6.
Prediction of the Chemotherapy Effect
Among the commonly used chemotherapy drugs for BC, docetaxel, paclitaxel and gemcitabine showed better efficacy in patients with high IGFBP6 expression (Figure 10).
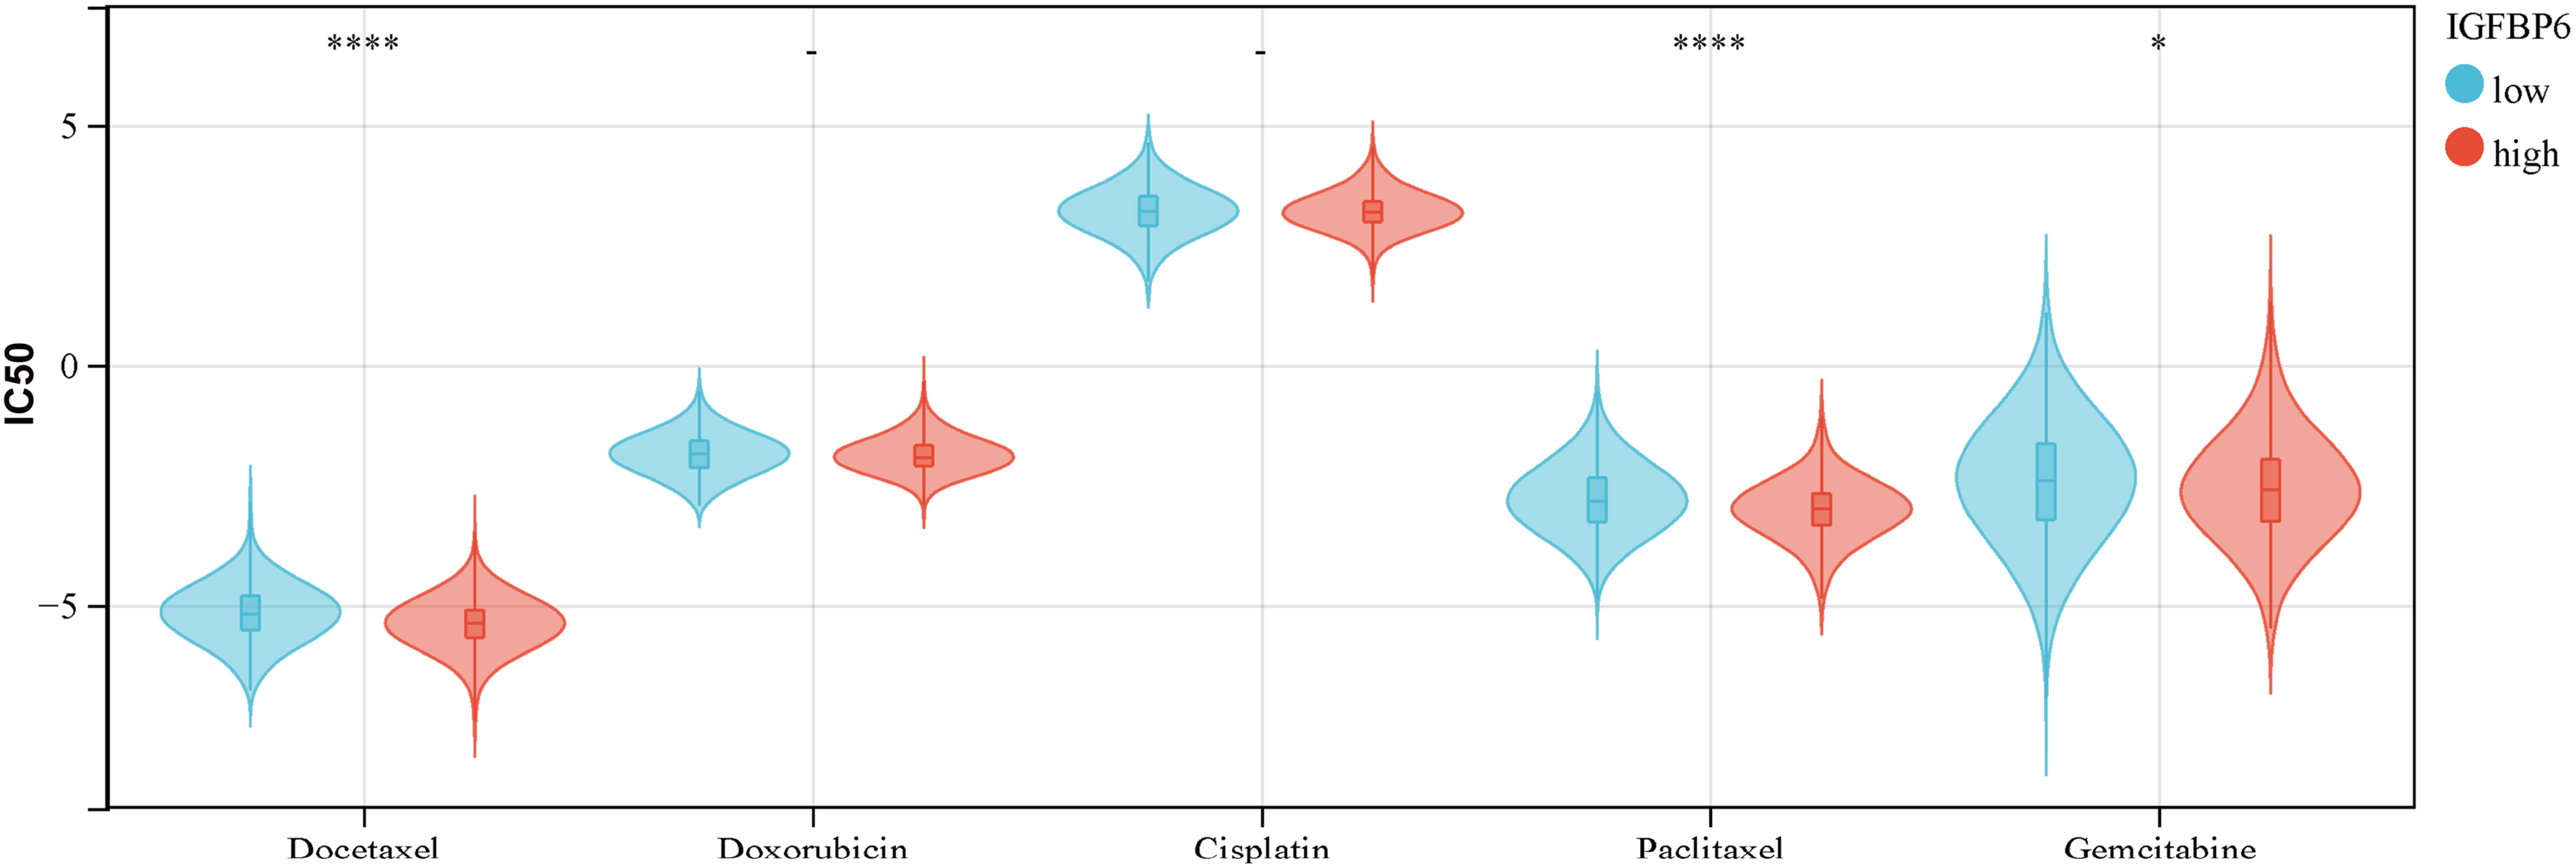
Correlation between IGFBP6 and chemotherapeutic agents. IC50 of common chemotherapeutic agents in high and low IGBPF6 expressed groups in the TCGA-BRCA cohort. TCGA-BRCA RNA-Seq data was used for analysis. *p < 0.05; **p < 0.01; ***p < 0.001; ****p < 0.0001.
Discussion
The role of IGFBP6 in cancer is complex. IGFBP6 can not only promote cancer migration in an IGF-independent manner but also inhibit the proliferation and angiogenesis of some cancer cells.14,22,23 Our results suggested that patients with high IGFBP6 expression had a better prognosis; therefore, IGFBP6 appears to be a tumor suppressor gene for BC. The expression of IGFBP6 in BC tissues was lower than that in normal tissues, and ER and PR on the surface of BC cells had certain regulatory effects on the expression of IGFBP6. We found that ER-positive BC cells had higher IGFBP6 expression levels than ER-negative BC cells, which was consistent with the results of previous studies showing that estrogen can increase IGFBP6 levels in estrogen receptor-positive BC cells in vitro. 24 Therefore, the regulatory effect of estrogen on IGFBP6 might occur through estrogen receptors.
Interestingly, according to our prognostic analysis of IGFBP6 in patients with different molecular types of BC, IGFBP6 was not a good predictor for patients with basal-like BC. The mechanism underlying this phenomenon should be further explored.
According to our results, IGFBP6 functions mainly in the extracellular matrix (ECM). Cancer cells together with stromal cells (such as fibroblasts) and the extracellular matrix constitute the main structure of the TME. IGFBP-6 promotes the transformation of breast fibroblasts into cancer-associated fibroblasts (CAFs), thereby promoting TME remodeling and facilitating tumor invasion. 25 IGFBP-6 is also activated in BC by the angiogenic factor angiostatin 2, which promotes cancer cell proliferation. 26 In addition, IGF-I can form a complex with vitronectin (VN) to stimulate a series of activities in BC cells. 27 IGFBP6 can also be used as an extracellular substrate for kallikrein-related peptidase 7 (KLK7) in ovarian cancer cells and can promote the progression of ovarian cancer. 28 In summary, IGFBP-6 regulates cytokines and chemokines that are involved in the control of fibroblast activation, tumor invasion, and maintenance of the tumor microenvironment during tumor progression.29,30 In addition to its association with fibroblasts, IGFBP6 is also associated with immune cells, which are important components of the TME. Our results showed that IGFBP6 expression had an overall positive correlation with the levels of T cells and macrophages. According to a study of human embryonic stem cells, medium with high IGFBP6 expression were more likely to induce M2 macrophage polarization than control medium. 31 In glioblastoma, IGFBP4- and IGFBP6-related genes are mainly associated with immune-related pathways. 32 Another study showed that IGFBP-6 promoted chemotaxis of monocytes and T cells. 33 Therefore, the relationship between IGFBP6 and the immune system is worthy of further investigation.
The PIK3CA gene encodes the p110 catalytic subunit of phosphatidylinositol 3-kinases (PI3Ks), namely, PI3Kp110a. Mutations in this gene are associated with therapeutic resistance to a variety of HER2-targeted drugs.34,35 PI3K-AKT-mTOR is a downstream pathway in response to insulin signaling and is mainly related to glucose metabolism.36-38 IGF can also promote the progression of malignant tumors by regulating the PI3 K pathway.39-41 Our results showed that the IGFBP6 expression level in BC patients with T2D was lower than that in non-T2D BC patients, while the downstream PI3 K signal was activated. 37 In our study, PI3 K was the only protein in the classical tumor signaling pathway that was negatively correlated with IGFBP6 expression. Therefore, we hypothesized that the anticancer mechanism of IGFBP6 in BC may be related to the binding of IGFBP6 to IGF, which inhibits its activation of the PI3 K pathway; however, further studies are needed to verify our hypothesis. In addition, our results showed that IGFBP6 is negatively correlated with the expression of many key enzymes involved in glycolysis in BC, so IGFBP6 may have an inhibitory effect on the energy metabolism of BC cells, which is worthy of further exploration. IGFBP6 is also associated with the expression of lipid metabolism-related genes in BC, and a recent study showed that knockout of the IGFBP6 gene led to significant changes in the fatty acid composition and expression of many genes related to lipid metabolism in BC cells and increased BC cell sensitivity to ferroptosis. 42 Therefore, how the regulatory effect of IGFBP6 on lipid metabolism and its effects on BC are also worth exploring.
There are some limitations to our study. First, our analysis was based on clinical data and online databases, which need to be validated in vitro and in vivo. Second, the size of the verification cohort was relatively small, which led to limited statistical power. The sample size should be expanded to facilitate a more comprehensive and accurate analysis in the future.
Conclusion
In general, high expression of IGFBP6 is associated with a good prognosis in BC patients. The mechanism of IGFBP6 in BC cells is complex and regulated by ERs. It can not only maintain the tumor microenvironment of BC cells but also inhibit the energy metabolism of cancer cells through glucose metabolism-related pathways. These findings may provide a new perspective on IGFBP6 as a potential prognostic marker for BC.
Supplemental Material
sj-docx-1-tct-10.1177_15330338241271998 - Supplemental material for Prognostic Value of IGFBP6 in Breast Cancer: Focus on Glucometabolism
Supplemental material, sj-docx-1-tct-10.1177_15330338241271998 for Prognostic Value of IGFBP6 in Breast Cancer: Focus on Glucometabolism by Hang Lu, Xin Yu, Zhiliang Xu, Jingwen Deng, Master Jingwen Zhang, Yimin Zhang and Shengrong Sun in Technology in Cancer Research & Treatment
Footnotes
Acknowledgements
N/A.
Author Contributions
Data curation, Jingwen Deng and Jingwen Zhang; Formal analysis, Hang Lu and Xin Yu; Funding acquisition, Yimin Zhang and Shengrong Sun; Investigation, Xin Yu; Methodology, Xin Yu; Resources, Hang Lu, Zhiliang Xu, Jingwen Deng, Jingwen Zhang, Yimin Zhang and Shengrong Sun; Software, Zhiliang Xu; Supervision, Zhiliang Xu, Yimin Zhang and Shengrong Sun; Validation, Hang Lu and Xin Yu; Visualization, Hang Lu and Xin Yu; Writing – original draft, Hang Lu; Writing – review & editing, Hang Lu, Zhiliang Xu and Yimin Zhang.
Data Availability
The datasets generated and analysed during the current study are available from the corresponding author on reasonable request.
Declaration of Conflicting Interests
The authors declared no potential conflicts of interest with respect to the research, authorship, and/or publication of this article.
Ethics Statement
The study was reviewed and approved by The Ethics Committee of Renmin Hospital of Wuhan University (No. WDRY2021-KS009).
Funding
The authors disclosed receipt of the following financial support for the research, authorship, and/or publication of this article: This work was supported by the National Natural Science Foundation of China, (grant number 81502665).
Patient Consent for Publication
The patients provided their written informed consent to participate in this study and subsequent publication.
Supplemental Material
Supplemental material for this article is available online.
Abbreviations
References
Supplementary Material
Please find the following supplemental material available below.
For Open Access articles published under a Creative Commons License, all supplemental material carries the same license as the article it is associated with.
For non-Open Access articles published, all supplemental material carries a non-exclusive license, and permission requests for re-use of supplemental material or any part of supplemental material shall be sent directly to the copyright owner as specified in the copyright notice associated with the article.