
Abstract
Keywords
Introduction
Invasive mucinous adenocarcinoma (IMA), previously referred to as mucinous bronchioloalveolar carcinoma (BAC), is made up of histologically goblet and/or columnar cells containing abundant intracytoplasmic mucin within the lung tumor. 1 Because of the unique clinical, radiological, pathological, and genetic features of IMA, it has been categorized as a variant subtype of lung adenocarcinoma in the 2011 International Association for the Study of Lung Cancer (IASLC)/American Thoracic Society (ATS)/European Respiratory Society (ERS) and 2015 World Health Organization (WHO) classification of lung adenocarcinoma, accounting for only 2% to 5% of adenocarcinomas.2,3 Based on the 2015 criteria established by the WHO, mucinous adenocarcinoma can be classified into 2 distinct categories characterized by their invasive mucinous pattern: pure invasive mucinous adenocarcinoma (pIMA, comprising > 90% of the invasive mucinous pattern with a lepidic predominant pattern) and mixed invasive mucinous/nonmucinous adenocarcinoma (mixed mucinous adenocarcinoma [mIMA], consisting of at least 10% of a nonmucinous invasive component). 4
Multiple studies have shown that the revised classification of lung adenocarcinoma holds significant prognostic value.5–8 Within this classification, mIMA and pMIA subtypes exhibit distinct molecular biological and prognostic features. 9 Research indicates that mIMA is often linked to unfavorable survival rates in comparison to pIMA, and may also present with a higher frequency of anaplastic lymphoma kinase rearrangements. However, pIMA demonstrates a higher prevalence of Kirsten rat sarcoma viral oncogene homolog mutation in comparison to mIMA. This suggests that mIMA displays greater heterogeneity, potentially leading to an increased likelihood of drug resistance to targeted therapy. Therefore, patients with mIMA may derive greater benefit from combination therapy. Therefore, we guessed that patients with mIMA may derive greater benefit much more from the combination therapy, especially in patients with advanced stages. And preoperative prediction may help us to make a much more precision neoadjuvant treatment plan in the future. To date, there have been limited studies on the computed tomography (CT) characteristics of IMA.10–12 However, due to the rarity of IMA, these studies have a small sample size and have not consistently differentiated between pIMA and mIMA, or have solely focused on pIMA. Thus, there is limited knowledge regarding mIMA, and the D characteristics for preoperative differentiation of pIMA from mIMA have not been documented in medical literature. Currently, the diagnosis of pIMA and mIMA relies on postoperative examination due to tumor cellular heterogeneity. However, postoperative pathology results are delayed, highlighting the urgent necessity for a predictive method to supplement surgical pathology in distinguishing between pIMA and mIMA.
Radiomics is an emerging technology with significant potential for clinical application in enhancing clinical decision-making through the high-throughput extraction of medical image features from lesions.13,14 In clinical settings, radiomic models have demonstrated utility in the diagnosis of lung nodules, including differentiation between benign and malignant nodules, preoperative prediction of nodule type, prognostic analysis, surgical outcome forecasting, and assessment of tumor gene expression patterns and microenvironment.15–17 Given the routine use of imaging examinations in clinical diagnosis, radiomics research is readily accessible. Drawing upon prior investigations, the objective of our study is to undertake an initial assessment of the intricate clinical parameters, radiomic characteristics, and their amalgamation for the preoperative differentiation of pIMA from mIMA.
Materials and Methods
This study was conducted in accordance with the Helsinki Declaration and received approval from the Ethics Committee of our hospital (Ethics Committee of our hospitals, reference number: 2023(124), dated 2023.11.15 and 2022KS017, dated 2022.06.27). Ethical clearance was obtained from our hospital, and waivers of consent were provided to the study participants.
Patient Selection
The reporting of this study conforms to Strengthening the Reporting of Observational Studies in Epidemiology (STROBE) guidelines. 18 In this respective study, we consecutively reviewed and retrospectively analyzed the clinical characters and radiomics features of all patients with pulmonary pIMA and mIMA diagnosed from January 2017 to December 2022 in our hospital. The study's inclusion criteria for patients with pIMA and mIMA were defined as follows: (1) confirmation of pIMA with a mucinous adenocarcinoma component exceeding 90% and mIMA with a nonmucinous invasive component of at least 10%; (2) presence of solitary and solid nodules with peripheral lung cancer characteristics on imaging; (3) availability of complete clinical and pathological data, including analyzable plain and enhanced thin-slice CT images at a thickness of 1.25 mm per slice; and (4) possession of CT images taken within 2 weeks prior to the pathological diagnosis. Conversely, patients were excluded based on certain criteria: (1) multiple pulmonary nodules; (2) anti-tumor therapy (including radiotherapy, chemotherapy, chemoradiotherapy, or molecular targeted therapy) prior to CT examination and pathological diagnosis; and (3) patients with other types of cancer. A total of 193 patients with pIMA and 111 patients with mIMA were included in this study. The retrospective analysis of this study was approved by our hospital's ethical review board, and the need for informed consent was waived. We have de-identified all patient details.
CT Image Acquisition
Contrast-enhanced chest CT scans were conducted on all patients using a 256-multidetector CT scanner (Discovery CT 750 HD Revolution, GE Medical Systems, Milwaukee, Wisconsin, USA). Patients were instructed to practice breathing techniques and hold their breath during inspiration prior to scanning. To minimize scanning artifacts, patients’ arms were elevated in a supine position. The imaging range encompassed the thoracic inlet and lung bases, with the sternoclavicular joint serving as the reference point. The scanning parameters included a tube voltage of 120 kV, tube current of 200 mAs, reconstruction layer thickness of 1.25 mm, matrix of 512 × 512, and pitch of 1.2. The reconstruction algorithm utilized standard soft tissue and lung reconstruction algorithms. Subsequent to the completion of the plain scan, 70 to 90 mL of nonionic contrast agent iohexol (300 mg/mL) was administered via the ulnar vein using a high-pressure syringe at a flow rate of 3 mL/s. Following the contrast agent injection, dual-phase enhanced scans of the arterial phase and venous phase were conducted 30 and 90 s postinjection, respectively. The remaining parameters mirrored those of the standard scans. Subsequent to scanning, the unprocessed data was transferred to a postprocessing terminal for multiplanar reconstruction (MPR).
Two thoracic radiologists, both certified by a governing body and possessing 12 and 30 years of experience in chest CT imaging, respectively, conducted the image feature analysis in a blinded fashion, without knowledge of the clinical or histological results. Window levels were configured for the mediastinal window (400 HU width; 40 HU level) and lung window (1500 HU width; −600 HU level). The study examined various characteristics of primary lung tumors, including tumor location (left and right lungs, upper, middle, and lower lobes), tumor size (maximum diameter), mean CT value (plain scan, venous phase), ΔCTV (the difference between the mean CT value of the venous phase and the mean CT value of the plain scan), internal features (such as cavities or vacuoles, angiogram sign), and external features (such as edge characteristics including lobular, burr, and pleural indentation sign). Additionally, the mean CT values of the nodules were measured on both plain and venous scans. To ensure data accuracy, the region of interest (ROI) was defined as the largest slice of the lesion along with 3 adjacent slices above and below, excluding any areas containing calcifications, necrosis, or atelectasis. The ROI encompassed more than half of the interface in cases of uniform density. In instances of uneven density, the slice containing the most solid components was chosen for measurement, with the mean value calculated based on 3 measurements. Cavity and vacuole were characterized as gas-filled spaces with a maximum diameter exceeding or falling below 5 mm, respectively. The CT angiogram sign was described as the visualization of enhancing vascular structures within the lesion during contrast-enhanced scanning. 19 The CT image characteristics were evaluated independently by 2 radiologists, with any discrepancies resolved in a uniform manner.
Segmentation, Feature Extraction, and Selection
The CT images were imported into the open-source software 3D-Slicer (version 5.0.2, http://www.slicer.org) and interpreted using specific window settings for the lung (width 1500/−600 HU) and mediastinal (width 400/40 HU) regions. Following image acquisition, primary lesions from patients diagnosed with pIMA and mIMA were chosen for tumor segmentation. A radiologist with 12 years of experience in chest CT imaging, blinded to clinical data, meticulously outlined ROIs layer by layer. The tumor ROIs were delineated to encompass the entirety of the lesion, including any cavities or vacuoles present within the nodules, while excluding bronchi, blood vessels, and normal lung tissue. Following one month of tumor segmentation, a subset of 40 patients was randomly chosen from the overall cohort for independent segmentation to evaluate intraclass agreement. Subsequently, an interclass agreement was assessed by a second radiologist with 30 years of experience in chest CT imaging, who independently segmented the same 40 patients. In order to evaluate the consistency of feature extraction by individual observers and between different observers, intraclass correlation coefficients (ICCs) were employed.
Radiomics features were extracted utilizing Pyradiomics within the 3D-Slicer software platform. A total of 1037 radiomics features were extracted from the images, including original, log-sigma-4-0-mm-3D, log-sigma-5-0-mm-3D, and various wavelet transformations (wavelet-LLH, wavelet-LHL, wavelet-LHH, wavelet-HLL, wavelet-HLH, wavelet-HHL, wavelet-HHH, and wavelet-LLL). The features extracted from the original image encompassed a total of 14 shape factor classes, 18 histogram classes (referred to as first-order), 24 classes derived from the gray-level co-occurrence matrix (GLCM), 16 classes from the gray-level run length matrix, 16 classes from the gray-level size zone matrix, 5 classes from the neighboring gray-tone difference matrix, and 14 classes from the gray-level dependence matrix. The type and quantity of features extracted from images of other types remained consistent with those extracted from the original image, with the exception of the shape factor classes.
Three consecutive steps were undertaken to decrease the dimensionality of the radiomic features to a manageable number. Initially, the interobserver agreement of radiomic features was evaluated, and features with an intraclass correlation coefficient (ICC) > 0.75 were selected. Subsequently, radiomic features demonstrating statistical significance between the pIMA and mIMA groups were identified. Finally, to minimize redundancy, the least absolute shrinkage and selection operator (LASSO) logistic regression algorithm was employed to identify the most informative predictive radiomic features for distinguishing between pIMA and mIMA in the training group, with 5-fold cross-validation performed 100 times to avoid overfitting.
Model Development
Factors with statistical significance in the multivariate analysis were further constructed by machine learning methods. The specific steps in our study were as follows: (1) the patients were randomly split into the training set and the test set in a 7:3 ratio; (2) based on factors with statistical significance in multivariate analysis in the training set, 9 machine learning models were developed in the training set: EXtreme gradient boosting (XGB) classifier, light gradient boosting machine (LGBM) classifier, random forest classifier, AdaBoost classifier, Gaussian Naive Bayes (GNB), logistic regression, multilayer perceptron (MLP) classifier, polynomial supervised vector machine (SVC), and k-nearest neighbor (KNeighbors) classifier. The optimal parameters in the 9 models were retrospectively identified using 5-fold cross-validation. XGB classifier was implemented using XGBoost1.2.1. LGBM classifier was implemented using lightgbm 3.2.1. The others were implemented using sklearn 0.22.1. The performance of 9 machine learning models was evaluated using the receiver operating characteristic (ROC) curve. To validate the most efficient machine learning model, a 5-fold cross-validation was employed. The primary evaluation metrics included the area under the ROC curve (AUC), accuracy, sensitivity, specificity, positive predictive value, and negative predictive value. Based on the ROC results, the most predictive machine learning classifier was selected, and the radiomics score (Rad-score) was subsequently calculated using the chosen model. The Rad-score, representing the likelihood of each patient being diagnosed with pIMA, was determined through the utilization of the most predictive machine learning classifier. Additionally, a predictive model was constructed based on clinical and CT data, with clinical features encompassing sex, age, and smoking status, while the specific CT features are detailed above.
Subsequently, 3 models—the clinical model, the radiomics model, and the combined model incorporating both clinical factors and radiomics features—were subjected to statistical comparison in order to determine the model exhibiting the greatest predictive accuracy.
Statistical Analysis
Statistical analyses were conducted using Python version 3.7, with patients randomly allocated in a 7 : 3 ratio to training and test groups. Radiomic features were normalized using Z scores, and baseline data were subjected to univariate analysis using Python stats models 0.11.1. Categorical variables were assessed with chi-square tests, while continuous variables were evaluated using t tests or Mann-Whitney U-tests. Factors exhibiting significant differences (P < .05) were incorporated into the multivariate logistic regression analysis. The multivariate analysis results identified clinical and CT features with statistically significant differences (P < .05), which were utilized to develop a clinical prediction model.
Key performance metrics for evaluating the model included the AUC, accuracy, sensitivity, specificity, positive predictive value, and negative predictive value. Decision curve analysis (DCA) was employed to assess the clinical utility of the 3 models. The methodology outlined in the “Materials and Methods” section allows for reproducibility by fellow researchers.
Results
Patient Characteristics
In this retrospective study, a total of 373 patients diagnosed with IMA were initially reviewed. Following the application of specific inclusion and exclusion criteria, 69 patients were excluded from the study. The reasons for exclusion included 21 patients who did not undergo enhanced CT examination at our hospital, 23 patients who had received chemotherapy drugs prior to hospitalization, and 25 patients for whom precise delineation of ROIs proved challenging. Ultimately, a cohort of 304 patients, with ages ranging from 15 to 81, was included in the analysis. Participants were allocated into a training group and a test group in a random manner, with a ratio of 7 : 3. The training group consisted of 213 patients, with 135 patients diagnosed with pIMA and 78 patients diagnosed with mIMA. The test group included 91 patients, with 58 patients diagnosed with pIMA and 33 patients diagnosed with mIMA.
There was no statistically significant difference in age between patients with pIMA and patients with mIMA, with median ages of 62 and 60 years, respectively. The proportion of female patients was higher in the pIMA group compared to the mIMA group (56.48% vs 45.05%, P = .055). There was no significant difference in the proportion of patients with a smoking history between the pIMA and mIMA groups (36.27% vs 37.84%, P = .785).
Regarding the characterization of CT findings, it was observed that lesions situated in the lower lobe were significantly more prevalent in patients with pIMA compared to those with mIMA, with respective proportions of 67.36% and 47.75% (P < .001). Furthermore, a statistically significant disparity was noted in the occurrence of pleural indentation sign on CT lung window images between the pIMA and mIMA groups, with proportions of 68.39% and 30.63%, respectively (P < .001). Additionally, the presence of cavities or vacuoles was more frequently observed in patients with pIMA than in those with mIMA, with proportions of 56.48% and 27.93%, respectively (P < .001). Angiogram sign and lobular appearance were observed more frequently in patients with mIMA compared to those with pIMA, with rates of 81.08% versus 64.77% and 92.79% versus 69.95%, respectively. The mean CT values on plain scan and venous phase were slightly lower in patients with pIMA than in those with mIMA, although these differences did not reach statistical significance. However, there was a statistically significant difference in the mean CT value on the arterial phase between pIMA (14.222 ± 93.167) and mIMA (36.294 ± 88.919), with a P value of .049. Furthermore, there was no significant difference in ΔCTV between the 2 groups (P = .848). The characteristics of the patients in the training and testing cohorts are detailed in Table 1.
Clinical Characteristics of the Patients.

Abbreviations: pNMA, pure invasive mucinous adenocarcinoma; mNMA, mixed mucinous/nonmucinous adenocarcinoma; Lobul, lobulation; Spicul, speculation; Cavity, cavities or vacuoles; AS, angiogram sign; PLI, pleural indentation sign; ΔCTV, venous CT value–plain CT value; ΔCTA, arterial phase CT value–plain CT value.
Radiomics Feature Selection and Model Construction
A total of 1037 radiomics features were initially extracted. Through a process of elimination, 425 features that exhibited no significant difference between pIMA and mIMA, as well as 255 highly correlated features with ICC values below 0.75, were excluded. Subsequent screening using LASSO with a λ value set at the minimum standard and standard error of 0.052 and 0.119, respectively, resulted in the retention of 6 robust radiomics features (contrast, T10Percentile, median, minimum, root mean squared, and skewness) with λ = 0.052, as illustrated in Figure 1.

Radiomics feature selection with the least absolute shrinkage and selection operator (LASSO). (A) Plots the coefficients of the log (λ) function. The dotted line represented the λ value the minimum standard and the smallest. Select the coefficient that is not 0 here as the coefficient of the last reserved feature. (B) The x-axis represents log(λ), and the numbers above the x-axis represent the average number of predictive variables. The red dot represents the average deviation value of each model with a given λ, while the vertical bar of the red dot represents the upper and lower limit values of the deviation. The vertical dotted line represents the log(λ) value corresponding to the best λ value; the selection standard is the minimum standard. By adjusting different parameters (λ), the binomial deviation of the model is minimized, and the feature datasets with the best performance are selected. After screening out the redundant features by LASSO, the 6 most robust radiomics features (including contrast, T10Percentile, median, minimum, root mean squared, and skewness) were retained, with λ = 0.052.
In the training dataset, nine machine learning radiomics prediction models were developed, including XGB classifier, LGBM classifier, random forest classifier, AdaBoost classifier, GNB, logistic regression, MLP classifier, SVC, and KNeighbors classifier, utilizing 6 radiomics features. The model constructed using the GNB classifier method exhibited superior performance, with AUC values of 0.657 and 0.733 in the training and test datasets, respectively (refer to Tables 2, 3, and Figure 2).
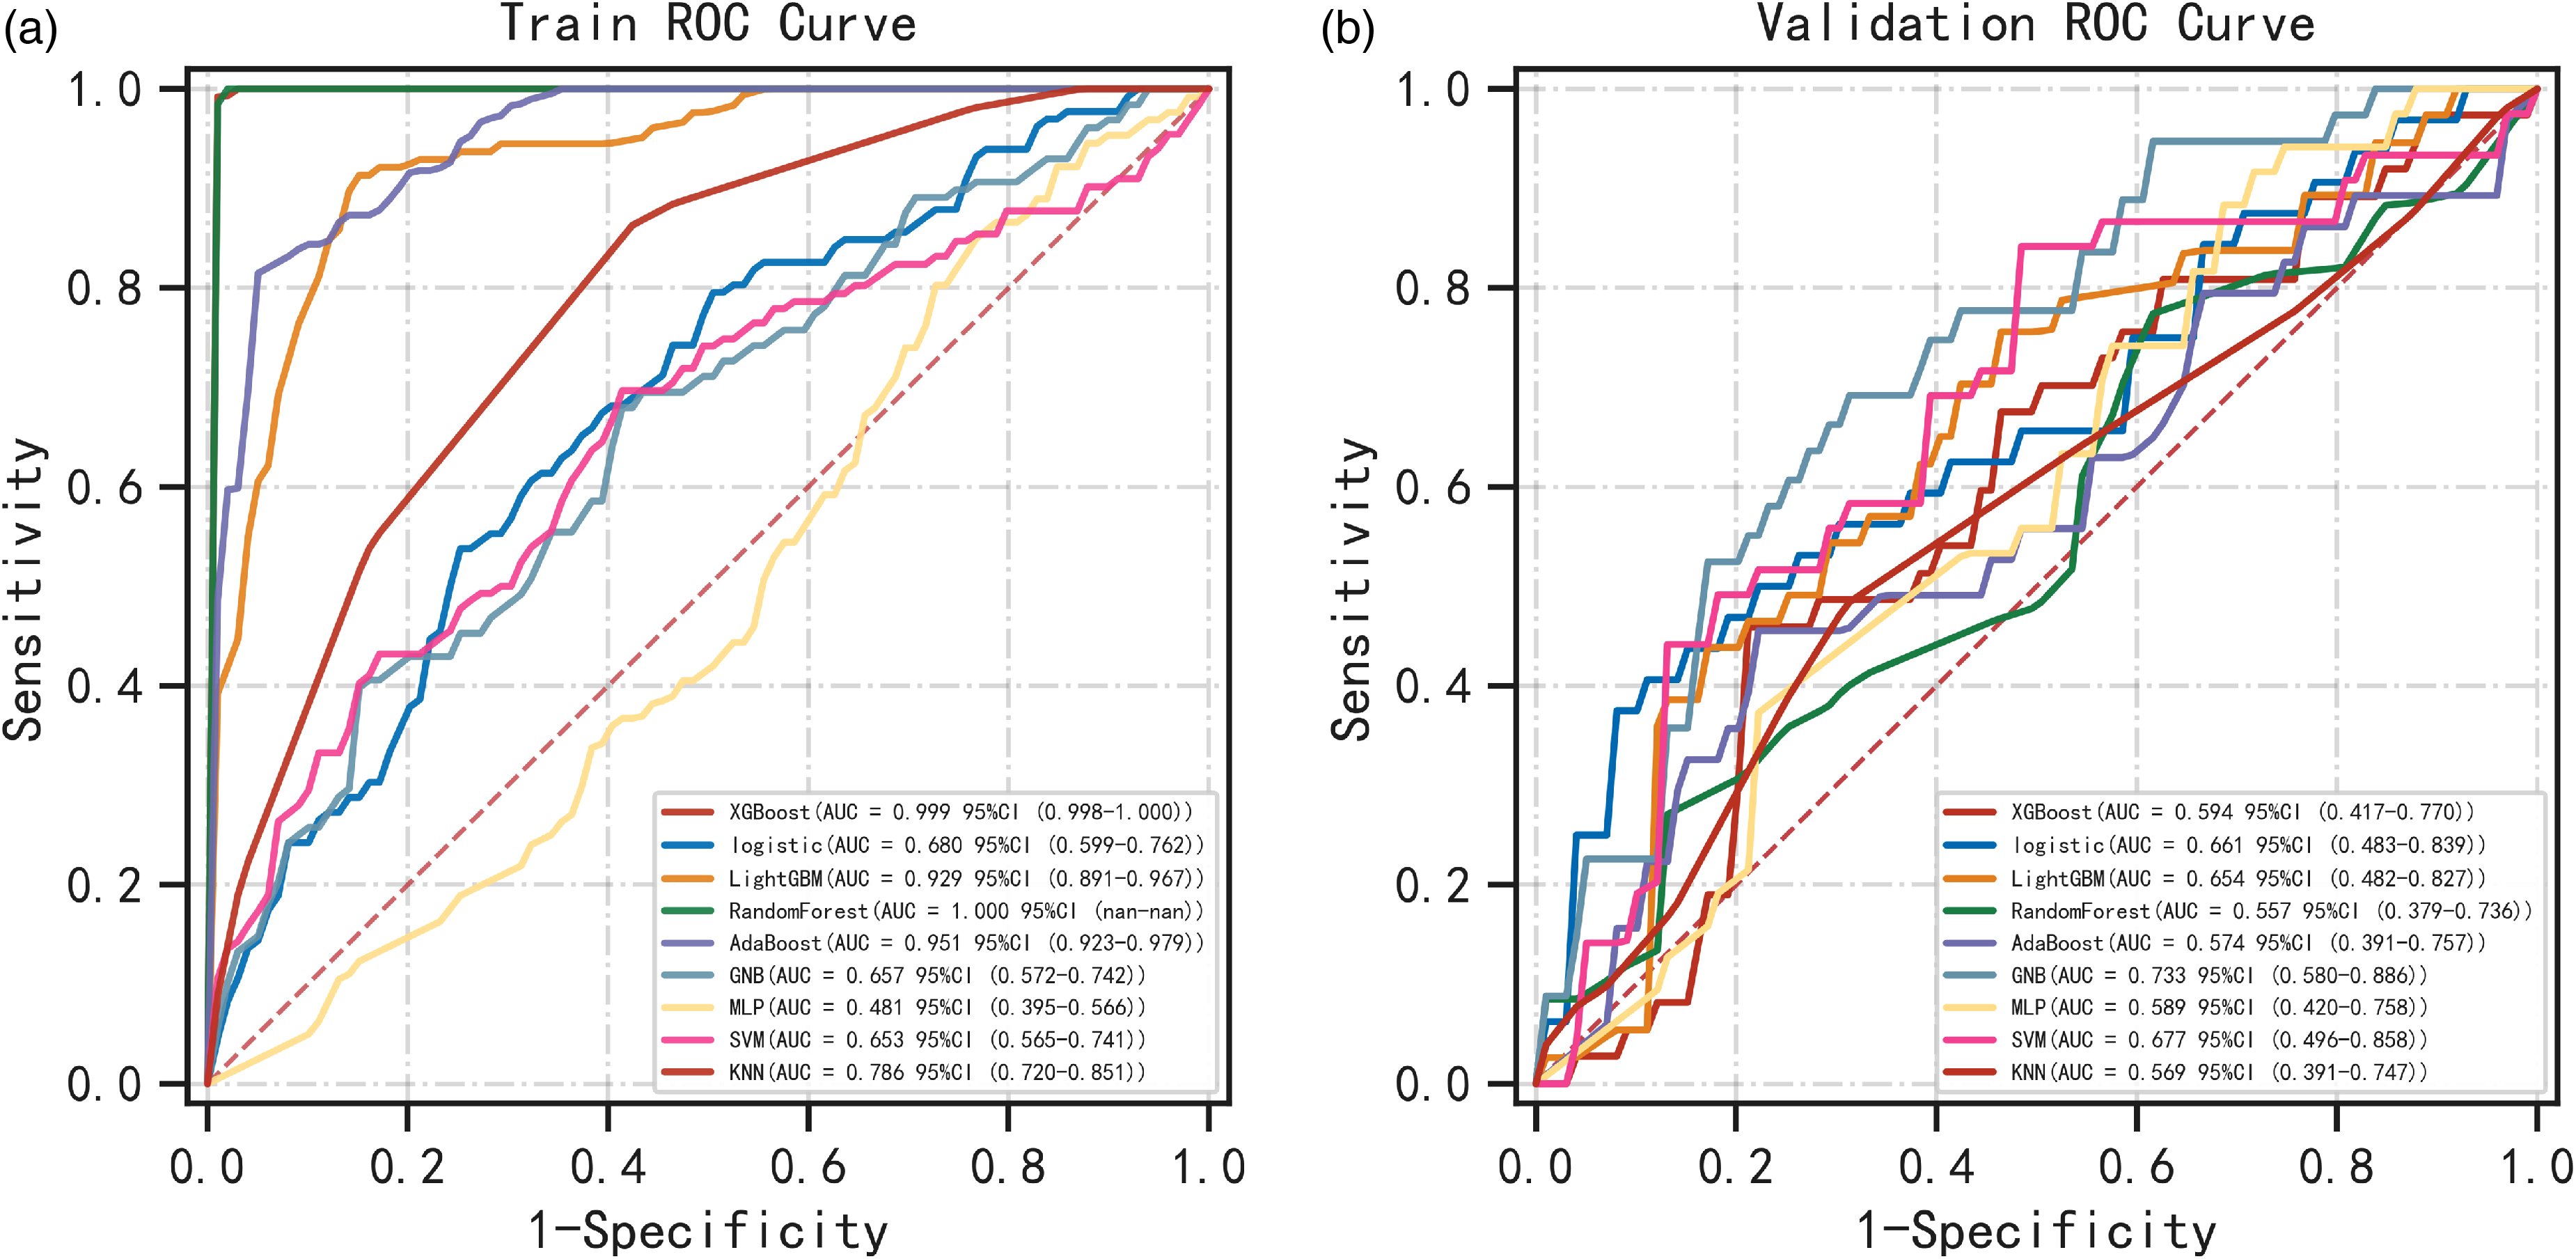
Receiver operating characteristics (ROC) curves of the nine machine learning.
Performance metrics for 9 models in the training dataset.

Abbreviations: AUC, area under the curve; XGBoost: EXtreme gradient boosting; SVM: polynomial supervised vector machine; LightGBM: light gradient boosting machine; AdaBoost: adaptive boosting; GNB: Gaussian Naive Bayes; MLP: multilayer perceptron; KNN: k-nearest neighbor.
Performance metrics for nine models in the validation dataset.

Abbreviations: AUC, area under the curve; XGBoost, EXtreme gradient boosting; SVM, polynomial supervised vector machine; LightGBM, light gradient boosting machine; AdaBoost, adaptive boosting; GNB, Gaussian Naive Bayes; MLP, multilayer perceptron; KNN, k-nearest neighbor.
Feature Selection and Clinical Model Construction
In the training dataset, a multivariable analysis revealed significant differences between pIMA and mIMA in lesion location in the lower lobe (OR = 0.395, 95% CI: 0.189-0.810), cavity or vacuole (OR = 0.321, 95% CI: 0.154-0.651), angiogram sign (OR = 0.266, 95% CI: 0.117-0.574), and pleural indentation sign (OR = 4.029, 95% CI: 1.883-8.934). A clinical prediction model was developed using a GNB machine learning approach based on these 4 features. The AUC values of the clinical models for distinguishing between pIMA and mIMA were 0.803 and 0.80 in the training and test groups, respectively. See Table 4 for details.
Multivariable Analysis to Identify Significant Factors for pNMA and mNMA in the Training Set.
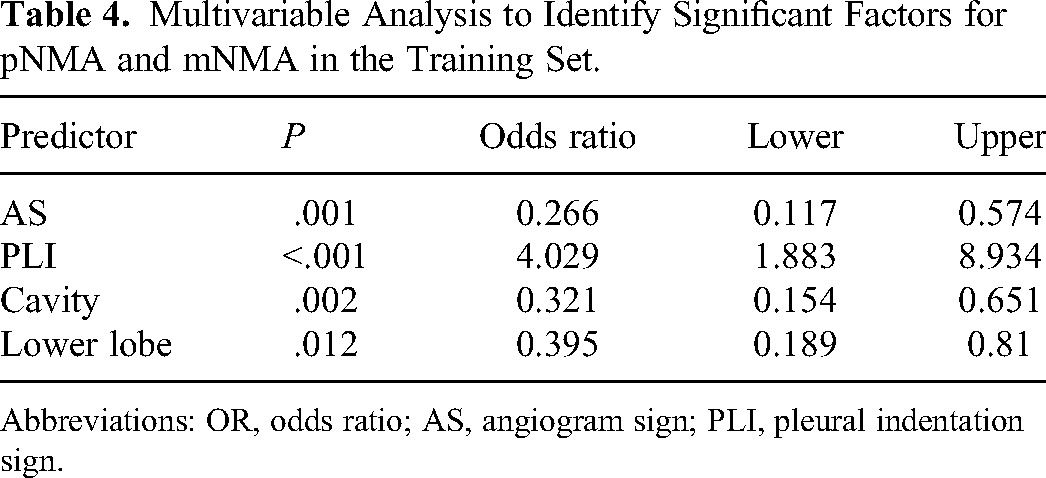
Abbreviations: OR, odds ratio; AS, angiogram sign; PLI, pleural indentation sign.
Combined Model Construction and Validation of Performance
The GNB classifier was utilized to develop a composite model incorporating 4 clinical features and 6 radiomics features. The findings indicated that the composite model outperformed both the clinical and radiomics models, as evidenced by ROC-AUC values of 0.81 compared to 0.91, 0.68 compared to 0.80, and 0.80 compared to 0.81 in the training and test cohorts, respectively (Table 2 and Figure 3). Moreover, the combined model demonstrated high sensitivity and specificity, with values of 0.841 and 0.966 in the training group and 0.708 and 0.746 in the test group, respectively (Table 5 and Figure 3). Based on the findings of the decision curve analysis, the integrated model for preoperative differentiation between pIMA and mIMA demonstrated superior performance compared to the clinical and radiomics models in terms of net benefits in both the training and test cohorts (Figure 4). The Brier scores for the training and test groups were 0.171 and 0.094, respectively, with corresponding calibration plots depicted in Figure 5.
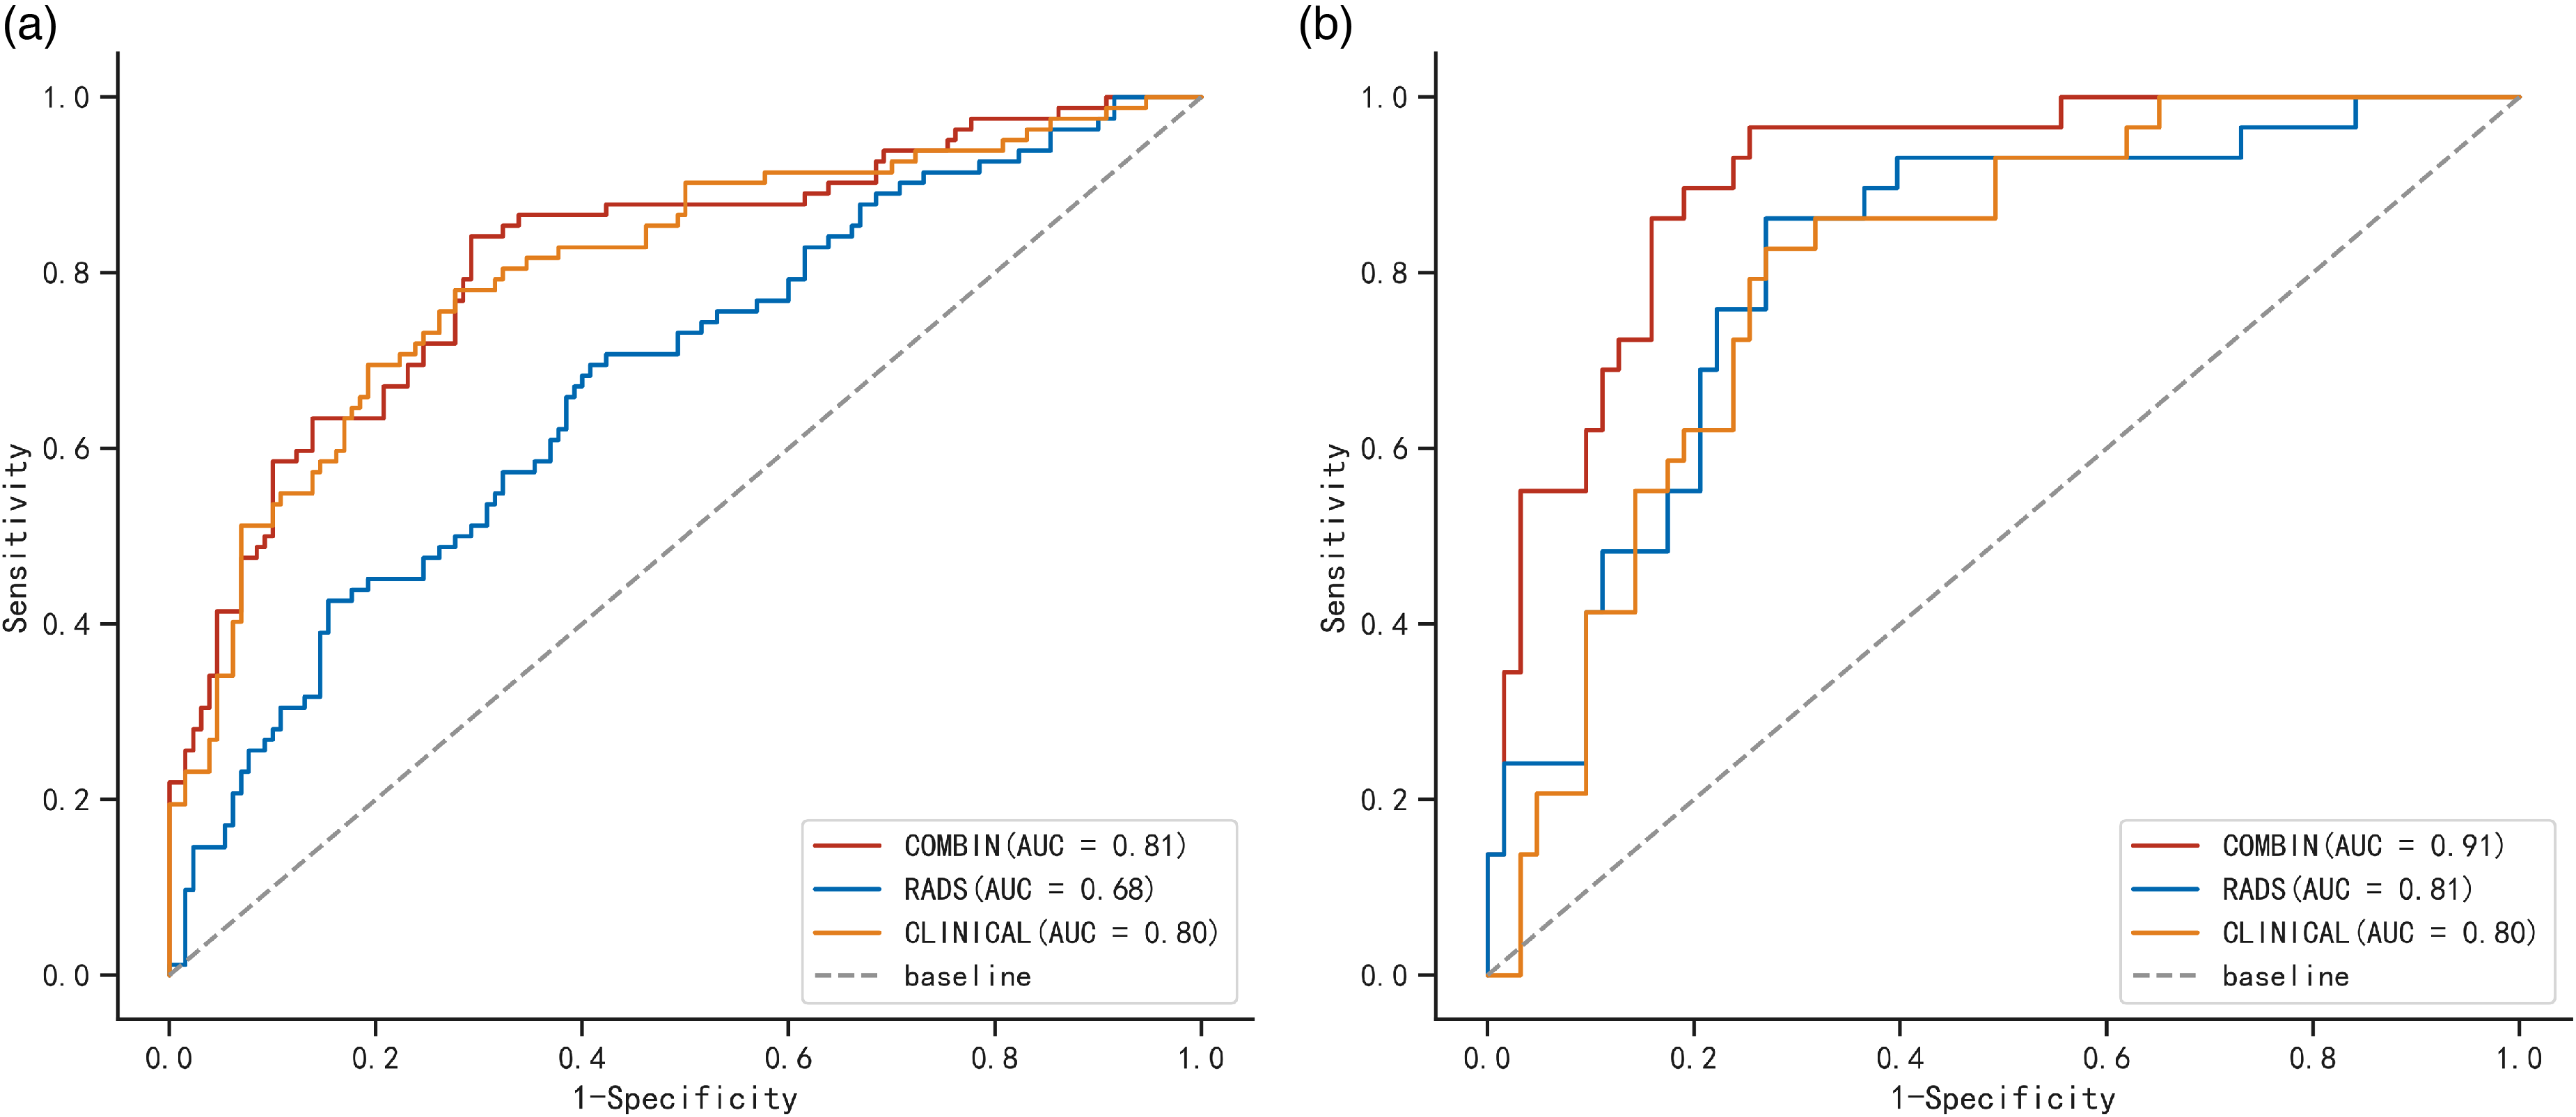
Comparison of ROC curves among the clinical model, radiomics model, and combined model in the training cohorts (A) and testing cohorts (B). The AUC values in the combined model were better than those in the clinical model and radiomics model for the prediction of pNMA.

Decision curve analyses for the radiomics–clinical model compared with the radiomics model and clinical model in the training cohort (A) and the testing cohort (B). Decision curve analysis showed that the net benefits of the combined model for the prediction of pure invasive mucinous adenocarcinoma (pNMA) were higher than those of the clinical model and radiomics model.

Calibration plot of the combined model in the training group and testing group.
Diagnostic Performance of the Prediction Models.

Abbreviations: AUC, area under the curve; SEN, sensitivity; SPE, specificity; Radiomics, radiomics model; Clinical, clinical model; Comb, combined model.
Discussion
This retrospective study identified significant variations between pIMA and mIMA in terms of qualitative and quantitative clinical data as well as radiomics data. A clinical prediction model for distinguishing between pIMA and mIMA was developed using 4 selected clinical variables, including lesion location in the lower lobe, presence of cavity or vacuole, angiogram sign, and pleural indentation sign. Additionally, a radiomic prediction model was constructed using 6 selected radiomic features: contrast, T10Percentile, median, minimum, root mean squared, and skewness. The clinical-radiomics combined model, comprising 4 clinical features and 6 radiomics parameters, exhibited strong predictive capabilities in both the training and test cohorts. Furthermore, statistical analysis revealed significant disparities between the clinical model, radiomics model, and combined clinical–radiomics model, with the latter outperforming the former 2 individual models.
From a histological perspective, pIMA is characterized by the presence of goblet and/or columnar cells that secrete extracellular mucin, with 90% of the tumors showing invasive mucinous features. In contrast, mIMA typically displays invasive mucinous patterns ranging from 10% to 90%. Our multivariate logistic regression analysis revealed that pIMAs were more likely to be located in the lower lobe compared to mIMAs, with percentages of 67.36% and 47.75%, respectively (P < .001). These findings align with previous studies conducted by Nie et al 12 and Xu et al. 20 This disparity can be explained by the origin of tumor cells in pIMA, which derive from goblet cells or columnar epithelial cells. These cancer cells are relatively well differentiated and have the ability to produce increased amounts of mucus, a characteristic that is influenced by gravity. Consequently, pIMA was more frequently observed in the lower lobe compared to mIMA.
CT scanning, particularly CT dynamic contrast-enhanced scanning, plays a crucial role in the diagnosis of lung cancer. There have been some reports on CT features for IMA, but to our knowledge, the CT characteristics of preoperative differentiation of pIMA from mIMA are not described in the medical literature.12,21–23 This study represents the first investigation into the preoperative differentiation of pIMA from mIMA. Our findings indicate that over half of patients with pIMA exhibited cavity or vacuole formation, whereas only a quarter of patients with mIMA displayed this characteristic. Cavities in IMA are attributed to incomplete obstruction of bronchioles by mucus, leading to alveolar hyperventilation. Conversely, vacuoles may result from internal necrosis of the tumor, with the necrotic material being expelled through the bronchus. Consequently, cavities or vacuoles are frequently observed in IMA. The presence of more invasive mucinous components in pIMA compared to mIMA may account for the higher prevalence of cavities or vacuoles in pIMA.
The CT angiogram sign refers to the highly enhanced pulmonary vascular texture shadow visible within the lesion during enhanced scanning, with the pathological basis of low malignancy of the tumor and mild damage to blood vessels. 19 Out of the 193 patients with pIMA, 68 exhibited angiogram signs, resulting in a ratio of 1 : 3. Conversely, 21 out of the 111 patients with mIMA displayed angiogram signs, yielding a ratio of 1 : 5. The prevalence of angiogram signs in pIMA was found to be higher than in mIMA, consistent with previous research findings. This disparity may be attributed to the lower-grade malignancy of pIMA compared to mIMA, suggesting that pIMA experiences less vascular damage. Additionally, CT imaging revealed more vascular signs in pIMA than in mIMA. Our multivariate logistic regression analysis indicated that pleural indentation signs were less frequently observed in pIMA compared to mIMA. This phenomenon may be attributed to the predominant composition of mucus in pIMA, resulting in lower levels of fibrosis, scarring, and traction within the tumor. Conversely, mIMA is characterized by a higher proportion of nonmucinous components, rendering it more susceptible to fibrosis and subsequent pleural traction.
To explore a more effective method for differentiating between pIMA and mIMA, we identified 6 unique radiomic features associated with each type, including contrast, T10Percentile, median, minimum, root mean squared, and skewness. These characteristics are categorized under the Haralick feature and Histogram Parameter. Specifically, Contrast, a component of the Haralick feature, is calculated from the GLCM and represents the local contrast variation in an image. The remaining parameters, T10Percentile, median, minimum, root mean squared, and skewness, are classified under histogram parameters. The median represents the median pixel value of an image (of the lesion). The minimum indicates the lowest pixel value in an image (of the lesion). The T10Percentile indicates that 10% of the observed value in a set of observations is lower than that value. Skewness reflects the degree of asymmetry in the histogram distribution. If the predictive value was effective, the absolute values of the skewness would have been higher. Another histogram parameter is the root mean squared, which represents the square root of the average of all voxel values. The higher-dimensional data was acquired by converting images, resulting in all the mentioned features. Quantitative imaging features from general medical images were able to be mined at high throughput, enabling an automated analysis that aids in clinical decision-making. Prior research has demonstrated that radiomics features extracted from CT scans have the potential to differentiate between IMA and invasive nonmucinous adenocarcinoma, as well as distinguish IMA from pulmonary tuberculoma.24,25 This current study represents the first attempt to differentiate pIMA from mIMA using radiomic characteristics. Furthermore, the findings suggest that these radiomic features can be utilized for preoperative differentiation of pIMA and mIMA. The ROC analysis yielded area under the curve (AUC) values of 0.68 and 0.81 in the training and test cohorts, respectively. The clinical–radiomics combined model exhibited a notable enhancement (ROC–AUC: 0.81-0.91) in comparison to the individual clinical and radiomics models. Furthermore, the decision curve analysis illustrated that the combined model outperformed the clinical and radiomic models in predicting outcomes. The utilization of decision curves offers additional insights beyond conventional performance metrics, such as discrimination and calibration, thereby aiding in the assessment of clinical efficacy and suggesting a higher likelihood of success.
Our study is subject to several limitations that warrant consideration. Firstly, the sample size was limited and restricted to a single institution due to the rarity of lung IMA, with no power calculation conducted to determine the sample size. Secondly, potential selection bias exists as only patients with pathologic results postsurgery were included. Thirdly, the short follow-up period postsurgery precluded the development of a predictive model for patient survival. In order to inform clinical practice, the model will undergo validation in a multicenter prospective study in the future, with subsequent optimization.
Conclusion
In summary, our current research has successfully developed a model for distinguishing between pIMA and mIMA through the integration of preoperative clinicopathological, radiomic, and clinical–radiomic features. This novel clinical–radiomic model demonstrated promising predictive capabilities and holds potential utility in the clinical setting. We developed the methods of diagnosis of pIMA and mIMA primarily based on postoperative examination of the tumors for the pathological diagnosis is most precisive at present. The potential value of the model developed in this study was to help us to make a much more precision treatment plan for patients with advanced stage and patients who need neoadjuvant therapy in the future.
Furthermore, the study adheres to the STROBE guidelines for reporting observational research.
Footnotes
Abbreviations
Acknowledgments
None.
Authors’ Contributions
JJZ and LGH performed the experiments and wrote the manuscript. QX and FXG were responsible for designing the experiments. All authors read and approved the final version of this submitted manuscript.
Availability of Data and Materials
The datasets produced and examined in the present investigation are not accessible to the public at this time due to ongoing analysis for future publications, although they can be obtained from the corresponding author on reasonable request.
Consent for Publication
We confirm that there has been no publication, submission, or acceptance elsewhere of the manuscript other than this journal. All potentially identifiable images or data in this article were published with the written consent of the individuals involved.
Declaration of Conflicting Interests
The author(s) declared no potential conflicts of interest with respect to the research, authorship, and/or publication of this article.
Ethical Approval and Consent to Participate
The Xing Tai People's Hospital ethical review board and Ethics Committee of the Fourth Affiliated Hospital of Hebei Medical University approved this retrospective analysis and waived informed consent requirements.
Funding
The author(s) disclosed receipt of the following financial support for the research, authorship, and/or publication of this article: Key development plan of Xingtai (grant number ZC20301).