
Abstract
Hepatocellular carcinoma (HCC), partly because of its complexity and high heterogeneity, has a poor prognosis and an extremely high mortality rate. In this study, mRNA sequencing expression profiles and relevant clinical data of HCC patients were gathered from different public databases. Kaplan–Meier survival curves as well as ROC curves validated that OLA1|CLEC3B was an independent predictor with better predictive capability of HCC prognosis compared to OLA1 and CLEC3B separately. Further, the cell transfection experiment verified that knockdown of OLA1 inhibited cell proliferation, facilitated apoptosis, and improved sensitivity of HCC cells to gemcitabine. In this study, the prognostic model of HCC composed of OLA1/CLEC3B genes was constructed and verified, and the prediction ability was favorable. A higher level of OLA1 along with a lower level of CEC3B is a sign of poor prognosis in HCC. We revealed a novel gene pair OLA1|CLEC3B overexpressed in HCC patients, which may serve as a promising independent predictor of HCC survival and an approach for innovative diagnostic and therapeutic strategies.
Keywords
Introduction
Hepatocellular carcinoma (HCC) is one of the most common malignancies worldwide, resistant to current chemotherapy or radiotherapy with an extremely poor clinical prognosis. 1 Together with the recognition of its severity and danger, great progress has been made in the treatment of HCC, however, treatment choices such as surgical resection, liver transplantation, liver-directed therapy and systemic therapy depend heavily on the tumor stage of HCC. 2 Combined with the poor response and tolerability to systemic chemotherapy, 3 the long-term prognosis is still rather far from satisfactory. Given that, there is an essential need to select a practical biomarker to guide therapy selection and understand drug resistance. It is recognized that gene pair therapy may be a potential candidate therapy for HCC. 4
In this study, we used publicly available cancer databases to evaluate the prognostic and predictive role of OLA1|CLEC3B expression, we found that OLA1|CLEC3B was significantly upregulated in HCC tissues compared with adjacent normal tissues. In addition, increased OLA1|CLEC3B expression was associated with immune microenvironment phenotype, leading to poor prognosis of patients. Functional investigations manifested that OLA1|CLEC3B facilitated HCC cell proliferation. Finally, the functions of the genes OLA1|CLEC3B in HCC cells were determined by cell transfection experiments. qRT-PCR verified the predictive performance of HCC prognosis. Collectively, this study may provide a strong rationale for exploration of more efficient therapies against HCC and for treatments tailored to individual patients.
Method and Material
HCC Patient Data Resources
Transcriptomic sequencing data and corresponding clinical data of 370 HCC tissues and 50 adjacent non-tumorous tissues from the Cancer Genome Atlas (TCGA) (https://portal.gdc.cancer.gov/) were recognized as a training cohort. 231 HCC tissues and 199 adjacent non-tumorous tissues with transcriptomic sequencing data and corresponding clinical data from the International Cancer Genome Consortium (ICGC) (https://dcc.icgc.org/ /projects/LIRI-JP) were regarded as validation cohort. The clinical information of the patients was presented in Table 1. This study strictly followed the guidelines for publishing online databases.
Clinical Characteristics of the HCC Patients Used in This Study.

Gene Expression Analysis and Risk Scores of Gene Pair Calculation
A total of 20 pairs of differentially expressed genes between HCC and adjacent non-tumorous tissues were analyzed using the “limma” R package, and FDR values < .05 were considered significant. The signature of gene pair was constructed by dividing the expression of Obg-Like ATPase 1(OLA1) and C-Type Lectin Domain Family 3 Member B (CLEC3B). The risk values of gene pairs were calculated as follows: risk scores = upregulated gene expression value/downregulated gene expression value. The optimal cut-off values of the survival curves were obtained by the analysis of “survminer” packages. According to this cut-off value, HCC patients were separated into high-risk and low-risk groups. The same threshold is then applied to the validation cohort.
Survival Analysis, Independent Prognostic Factors Analysis and ROC Curve
Survival analysis of the gene-to-risk group was performed using the “survival” and “survminer” R packages, and a P-value of < .05 was considered as a survival difference between the two groups. The accuracy of gene-to-risk values in predicting survival in HCC patients was analyzed by the “timeROC” package. Independent prognostic factors were analyzed by univariate- and multivariate Cox regression analyses using the “survival” package, and P values less than .05 were considered as survival-related independent prognostic factors.
Establishment of Nomogram and Calibration Curves
The “survival” and “regplot” packages were used to create column line plots to calculate the probability of survival at 1, 2, and 3 years for each HCC patient, and the “rms.” The higher the fit of the calibration curve to the reference curve and the larger the area under the ROC curve (AUC), the higher the prediction accuracy.
Immune Cell and Immune Function Analysis
Immune cell infiltration and immune function scores in HCC tissues were calculated by the ssGSEA method using the “GSVA” and “GSEABase” packages. Differential analysis of genes on immune cell infiltration and immune function between different risk groups was performed using the “limma” R package.
Correlation Analysis of Gene Pairs with Immune Cells, Tumor Purity
Correlation analysis of OLA1|CLEC3B with the immune cell score, stromal score, and tumor purity was performed using the Spearman method. The correlation between OLA1|CLEC3B and drug sensitivity was analyzed by Pearson method. Plotting was performed using “ggplot2” and “ggpubr” R packages.
GO and KEGG Functional Enrichment Analysis
The differentially expressed genes between high- and low-risk groups were obtained by “limma” package analysis, and the GO and KEGG functions of differential genes were enriched by “clusterProfiler” package for gene function and pathway analysis. The P value <.05 was regarded as statistically significant.
Cell Culture and Transfection
Human hepatoma cell line Huh7 was used in this study. Cells were cultured in DMEM containing 10% fetal bovine serum (FBS, Australia Origin, Gibco) and 1% penicillin–streptomycin–glutamine solution (Gibco) in a humidified atmosphere of 5% CO2 at 37 °C. siRNA was transfected into cells using Lipofectamine RNAiMAX (Life Technologies), according to the manufacturer's instructions. Transfected cells were analyzed 48 h after transfection with siRNA.The si-OLA1 sequence used is shown in Supplemental Table 1.
Generation of Gemcitabine-Resistant Cells
Induction of gemcitabine-resistant HCC cells using Huh7 cells. Briefly, cells were gradually exposed to different concentrations of gemcitabine (10-25 μM) (MedChemExpress, HY-17026, USA) to induce gemcitabine resistance. Gemcitabine-resistant HCC cell lines were generated 4 months after induction.
Quantitative Reverse Transcription PCR (qRT-PCR)
Total RNA was extracted with the Trizol reagent following the manufacturer's instructions (Servicebio). Then cDNA was synthesized using reverse transcriptase provided by Thermo. RT-PCR analysis was performed using FastStart Universal SYBR Green Master (Roche) by ABI StepOne (Applied Biosystems). The primer sequences are provided in Supplemental Table 2.
Cell Growth Assays
The CCK-8 agent (Mce, Cat# HY-K0301) was used to detect cell viability. A Huh7 cells were plated in 96-well plates at 2000 cells per well. Then, CCK-8 was added to each well every 24 h for 4 days according to the manufacturer's protocol. The absorbance value was detected using a microplate reader (Bio-Rad Laboratories; Hercules, CA, USA) at 450 nm.
Flow Cytometry
Cell apoptosis analysis and cell cycle analysis with PI-stained assay were carried on a flow cytometer (Beckman Coulter) according to the manufacturer's instructions. Apoptosis was determined using the Apoptosis Detection Kit (Multi Sciences; Zhejiang, China Cat#AP101 100) and analyzed with FlowJo v10 (FlowJo, LLC).
Statistical Analysis
All statistical analysis were performed in R software (version 4.0.2). Gene expression levels between HCC and adjacent non-tumorous tissues were analyzed with the Wilcoxon test. Differences in proportions were assessed with the Chi-squared test. The analysis of time-dependent ROC curves and Kaplan–Meier survival analysis were applied to compare the survival rates at different follow-up time points and the difference of the OS between the two groups of HCC patients. Univariate and multivariate Cox regression analyses were used to screen for independent predictors of OS. Mann–Whitney test was used to compare the ssGSEA scores of immune cells or the activity of immune pathways in different risk groups. Spearman correlation and Pearson correlation were taken to analyze the correlation between indicators. A two-tailed P < .05 was considered statistically significant.
Result
Different Expression of OLA1, CLEC3B, and OLA1|CLEC3B in HCC Tissues and Adjacent Non-Tumorous Tissues
Based on the relative value of the gene expression level, the OLA1|CLEC3B signature was established. The risk score formula: risk score = the expression of OLA1 divided by the expression of CLEC3B. In order to elucidate whether OLA1, CLEC3B, and OLA1|CLEC3B are associated with HCC, we described the results of 20 pairs DEGs, which showed the expression of OLA1 and risk score significantly increased in HCC tissues compared to adjacent nontumorous tissues (Figure 1A and D), while the expression of CLEC3B was less abundant (Figure 1B and E), presenting a negative correlation. Public database on the basis of the collected data also confirmed that the HCC tissue of OLA1|CLEC3B values higher than the adjacent nontumor tissues (Figure 1C and F).
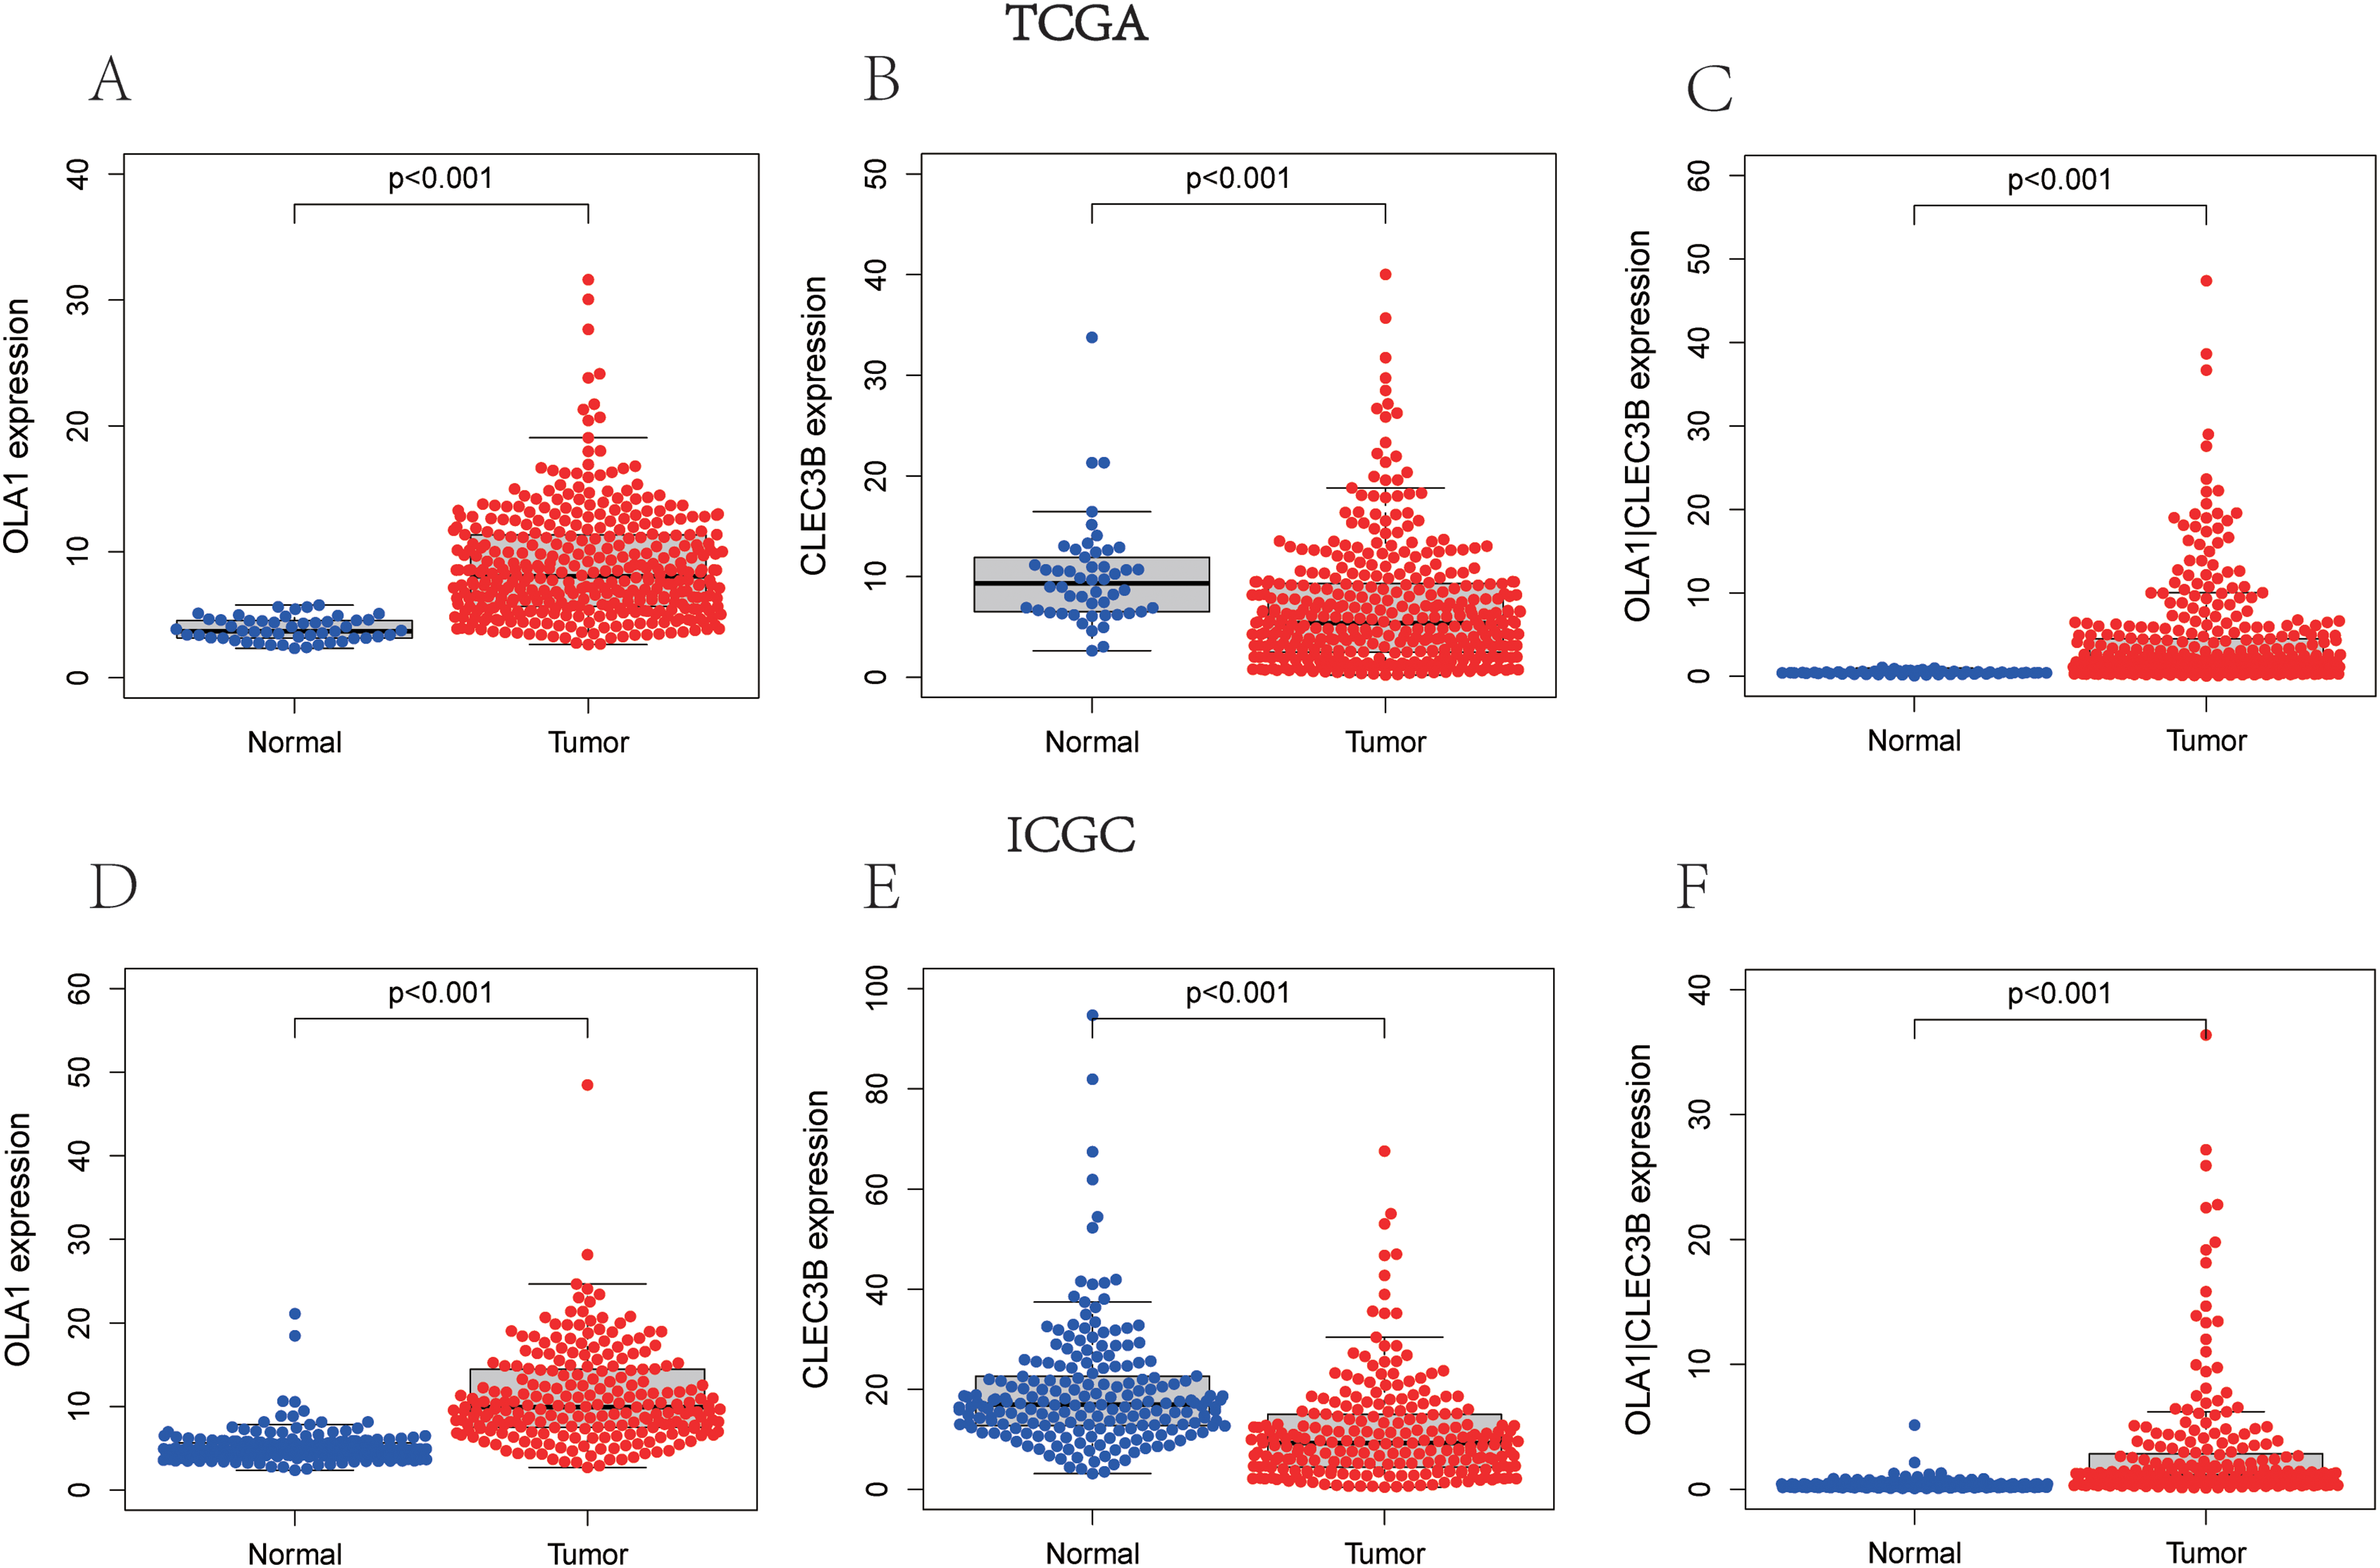
Expression of OLA1, CLEC3B, and OLA1|CLEC3B between HCC and adjacent non-tumorous tissues. The expression of (A) OLA1, (B) CLEC3B, and (C) OLA1|CLEC3B in TCGA cohort. The expression of (D) OLA1, (E) CLEC3B, and (F) OLA1|CLEC3B in ICGC cohort.
Survival Analysis of OLA1, CLEC3B, and OLA1|CLEC3B in HCC Patients and ROC Curves
The high- and low-expression of OLA1 and CLEC3B and the high- and low-value of OLA1|CLEC3B were divided by the optimal cut-off value (Figure 2A-C). Kaplan–Meier survival analysis showed that low OLA1 or high CLEC3B expression suggested a good prognosis for OS in the TCGA cohort. (The median OS of OLA1 was 1.123 year at high expression group and 1.762 year at low expression group. The median OS of CLEC3B was 1.811 year at high expression group and 1.034 year at low expression group. The median OS of OLA1|CLEC3B was 1.047 year at high value group and 1.844 year at low value group.) (Figure 3A-C) and in the ICGC cohort (The median OS of OLA1 was 1.726 year at high expression group and 2.466 year at low expression group. The median OS of CLEC3B was 2.219 year at high expression group and 1.644 year at low expression group. The median OS of OLA1|CLEC3B was 1.562 year at high value group and 2.384 year at low value group.) (Figure 3D-F). We next used time-dependent ROC analysis to assess the prognostic accuracy of risk score at different follow-up times. The results showed that the area under the curve (AUC) values of some OLA1 and CLEC3B in predicting 1-, 2-, and 3-year OS did not reach 0.7 (The AUC of OLA1 at 1-, 2-, and 3-year OS reached 0.718, 0.682 and 0.669 in TCGA, The AUC of CLEC3B at 1-, 2-, and 3-year OS reached 0.706, 0.696 and 0.709 in TCGA), but the AUC values of OLA1|CLEC3B were all more than 0.7 (The AUC at 1-, 2-, and 3-year OS were 0.734, 0.720 and 0.713, respectively) (Figure 3G-I). Similar consequences were obtained from ICGC cohort: the AUC of OLA1 at 1-, 2-, and 3-year OS reached 0.617, 0.682 and 0.666; the AUC of CLEC3B at 1-, 2-, and 3-year OS were 0.696, 0.688, and 0.675; and the AUC of OLA1|CLEC3B were 0.722, 0.729, and 0.736 (Figure 3J-L). According to the results mentioned above, the AUC values of OLA1|CLEC3B were all larger than those of individual genes, and all were greater than 0.7, which was clinically significant.5,6 Thus, this gene pair became the priority of our further studies.

Cut-off value of OLA1, CLEC3B, and OLA1|CLEC3B. The optimal cut-off value of (A) OLA1 expression, (B) CLEC3B expression, and (C) OLA1|CLEC3B expression in HCC patients.

Survival analysis and time-dependent ROC curves of OLA1, CLEC3B, and gene pair OLA1|CLEC3B for OS in HCC. TCGA cohort (A-C, G-I), ICGC cohort (D-F, J-L). Kaplan–Meier survival curves for OS of patients in the TCGA cohort with high and low expression of (A) OLA1, (B) CLEC3B, and (C) OLA1|CLEC3B. Kaplan–Meier curves for OS of patients in the ICGC cohort with high and low expression of (D) OLA1, (E) CLEC3B, and (F) OLA1|CLEC3B.Time-dependent ROC curves of OLA1, CLEC3B, and OLA1|CLEC3B at (G) 1-year, (H) 2-year, and (I) 3-year OS in the TCGA cohort. Time-dependent ROC curves of OLA1, CLEC3B, and OLA1|CLEC3B at (J) 1-year, (K) 2-year, and (L) 3-year OS in the ICGC cohort.
Independent Prognostic Factors for Survival in HCC Patients
Univariate and multivariate analyses were performed to identify independent prognostic factors in patients with HCC. The scoring parameters significant (P < 0.05) on univariate analysis were also included in the multivariate Cox regression analysis. Both univariate and multivariate analyses confirmed that OLA1|CLEC3B and tumor stage were two independent prognostic predictors of OS in the TCGA cohort (Figure 4A and B) and in the ICGC cohort (Figure 4C and D), although OLA1 was also an independent prognostic risk factor in the ICGC cohort in univariate analysis. In general, OLA1|CLEC3B also had an independent predictive value for patient survival in additional to clinical characteristics.

Univariate and multivariate Cox regression analyses of clinical characteristics and OLA1|CLEC3B. TCGA cohort (A, B), ICGC cohort (C, D). (A and C) Univariate Cox regression analyses of clinicopathological parameters and OLA1|CLEC3B to screen OS-related factors. (B and D) Multivariate Cox regression analyses of clinicopathological parameters and OLA1|CLEC3B to screen OS-related factors.
Correlation of OLA1|CLEC3B in Clinical Characteristics Groups
The present study further analyzed the association between expression of OLA1|CLEC3B and clinicopathological parameters ranging from age, gender to tumor stage. When OLA1|CLEC3B was remarkably higher in patients with advanced tumor stage and advanced tumor grade, no significant correlation difference in the effect of gender and age was detected (Figure 5A-D). Besides, patients with advanced tumor stage displayed a higher OLA1|CLEC3B in TCGC cohort (Figure 5E-G)). However, there was no data on the tumor grade of LICH in ICGC. Accordingly, we could speculate that in line with the results in TCGA cohort, increased OLA1|CLEC3B may lead to advanced tumor grade and tumor stage, which suggests a worse prognosis in HCC patients.
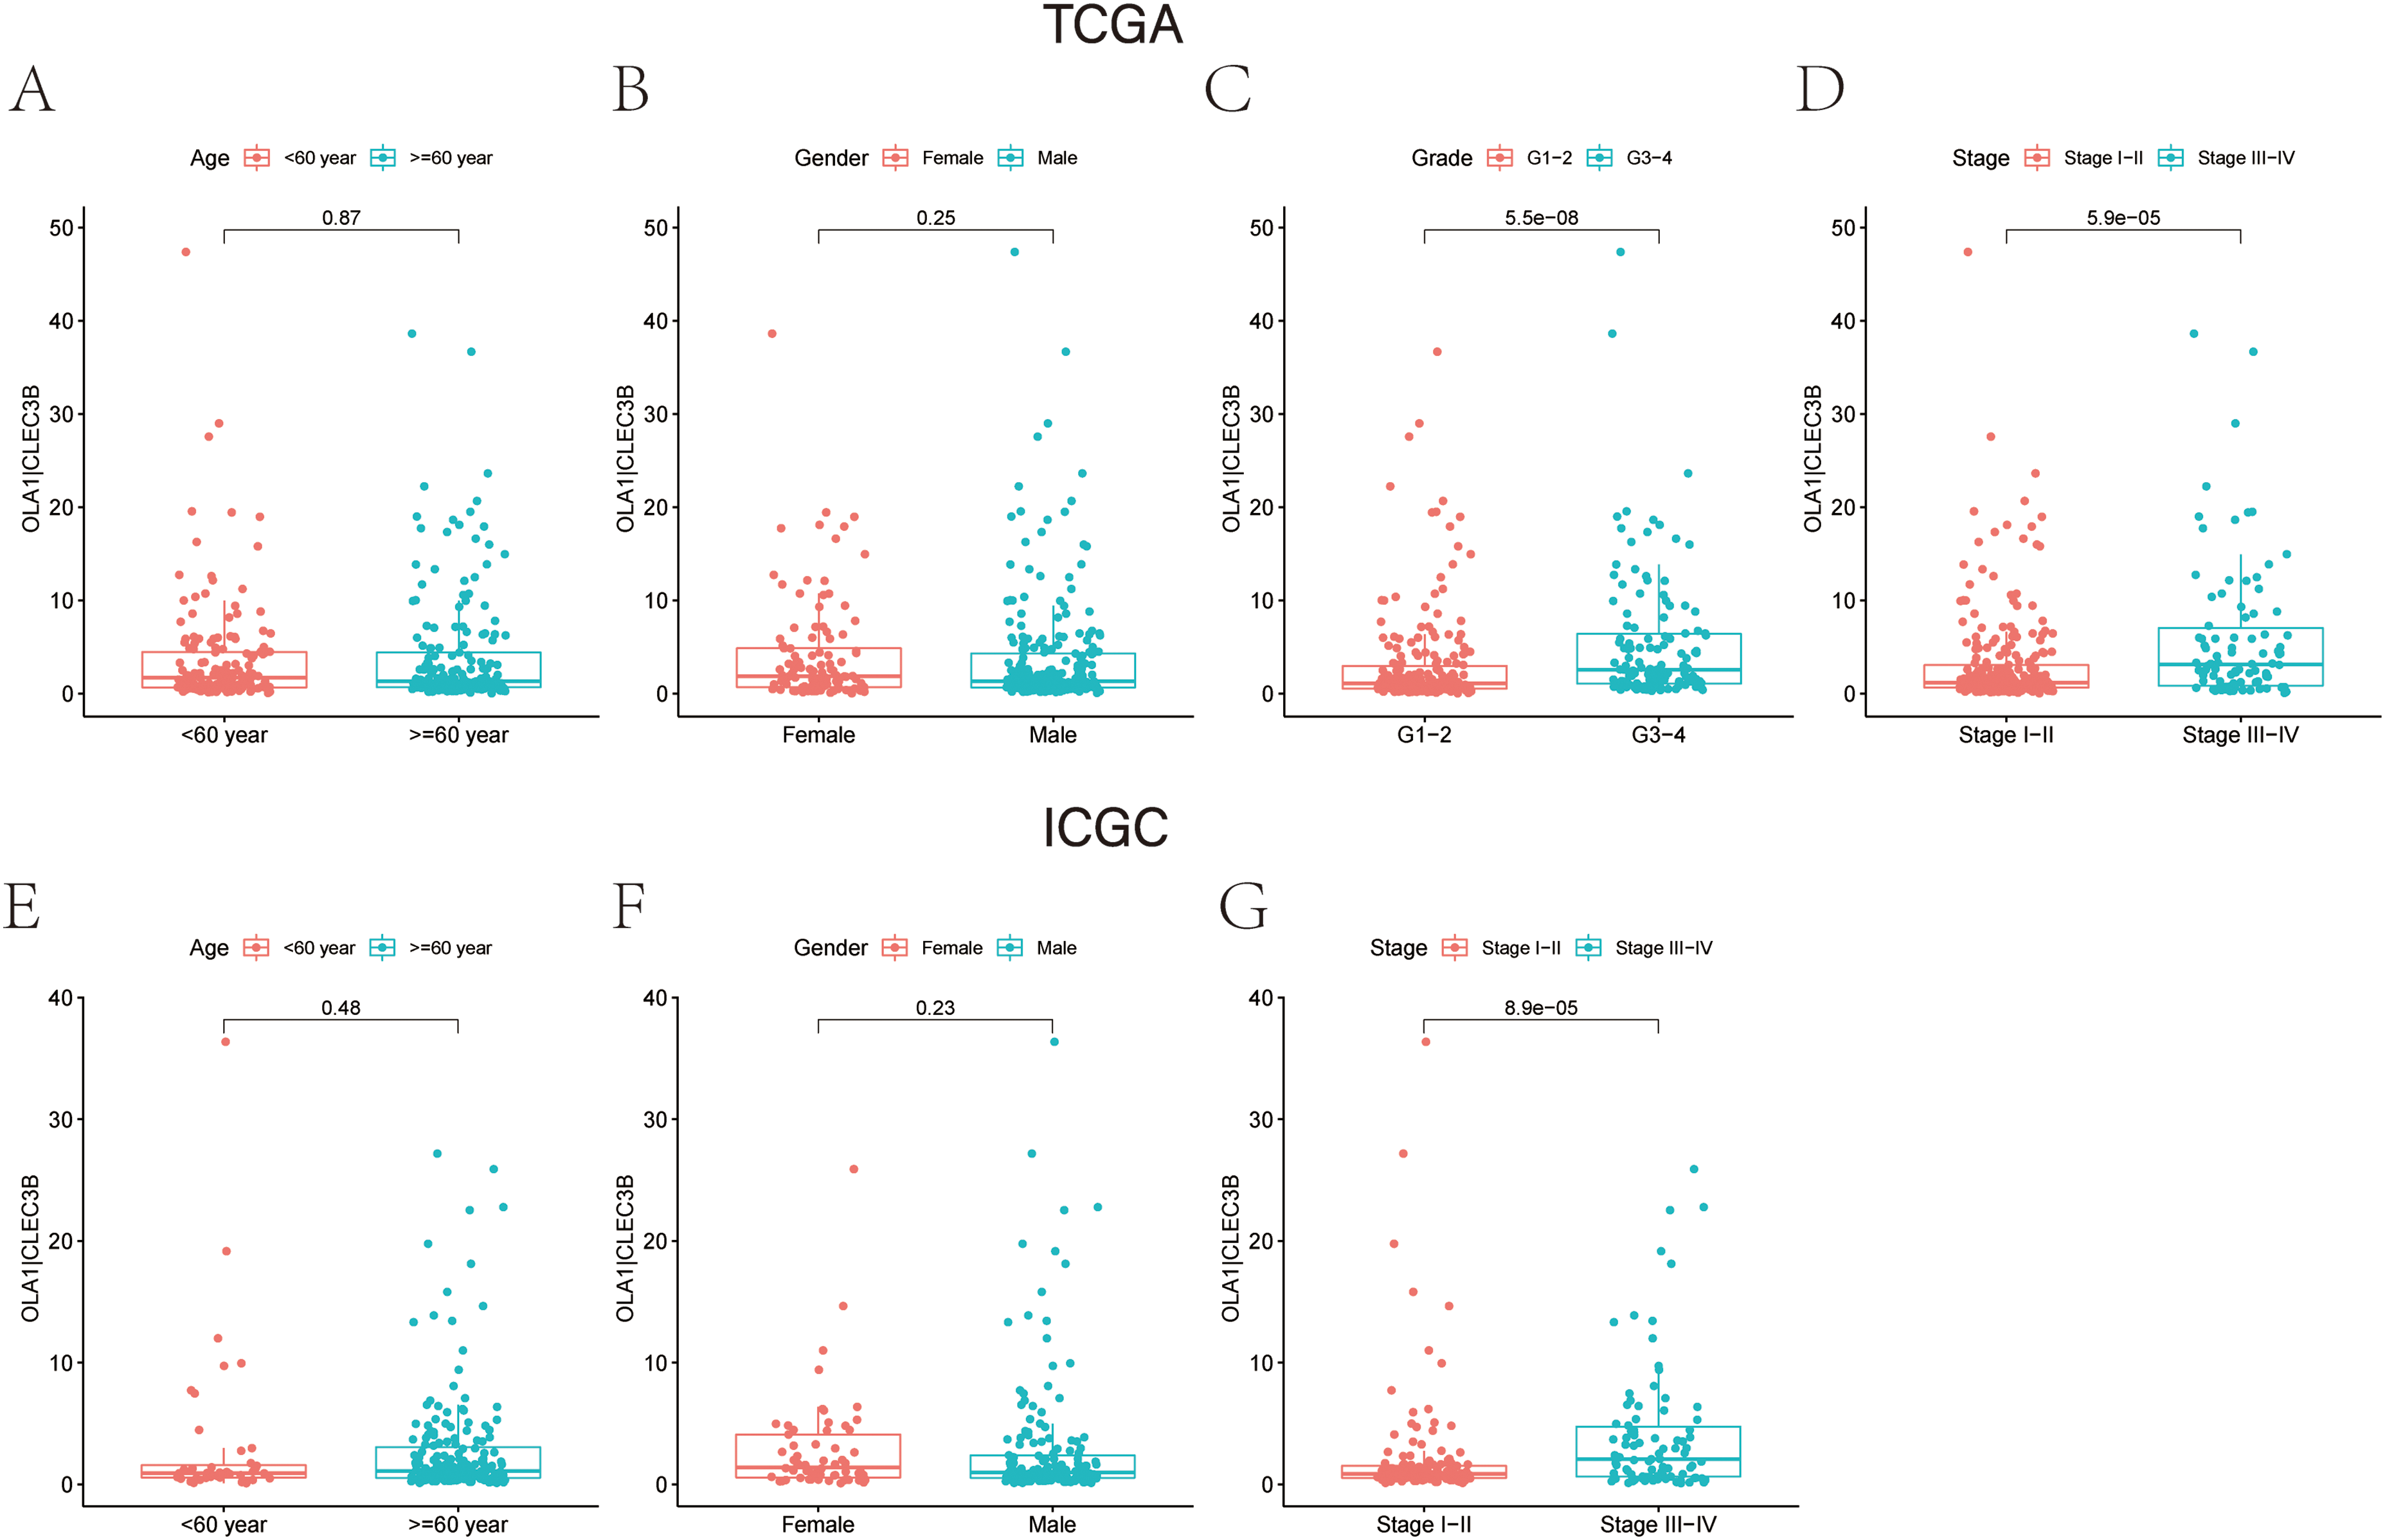
Clinical characteristics in high- and low-OLA1|CLEC3B groups. TCGA cohort (A-D), ICGC cohort (E-G). (A and E) Expression of OLA1|CLEC3B in patients with different age (<60 year and ≥ 60 year); (B and F) Expression of OLA1|CLEC3B in male and female patients. (C) Expression of OLA1|CLEC3B in patients with different tumor grades (G1-2 and G3-4) in TCGA cohort. (D, G) Expression of OLA1|CLEC3B in patients different tumor stages (stage I-II and stage III-IV).
ROC Curves of OLA1|CLEC3B and Clinical Characteristics
According to a time-dependent ROC curves analysis of the OLA1|CLEC3B and other clinical characteristics that we built in TCGA cohort, we observed the AUC value of OLA1|CLEC3B was 0.735 at 1 years, 0.720 at 2 years, and 0.713 at 3 years, respectively (Figure 6 A-C). We further detected AUC values in the ICGC cohort, with 1-, 2-, and 3-year were 0.722, 0.728, and 0.737, respectively (Figure 6 D-F), from which we can tell that most of them were distinctly higher than that in age, gender, tumor grade, and tumor stage, and these results revealed that gene pair OLA1|CLEC3B had better predictive performance in predicting the long-term OS of HCC patients.
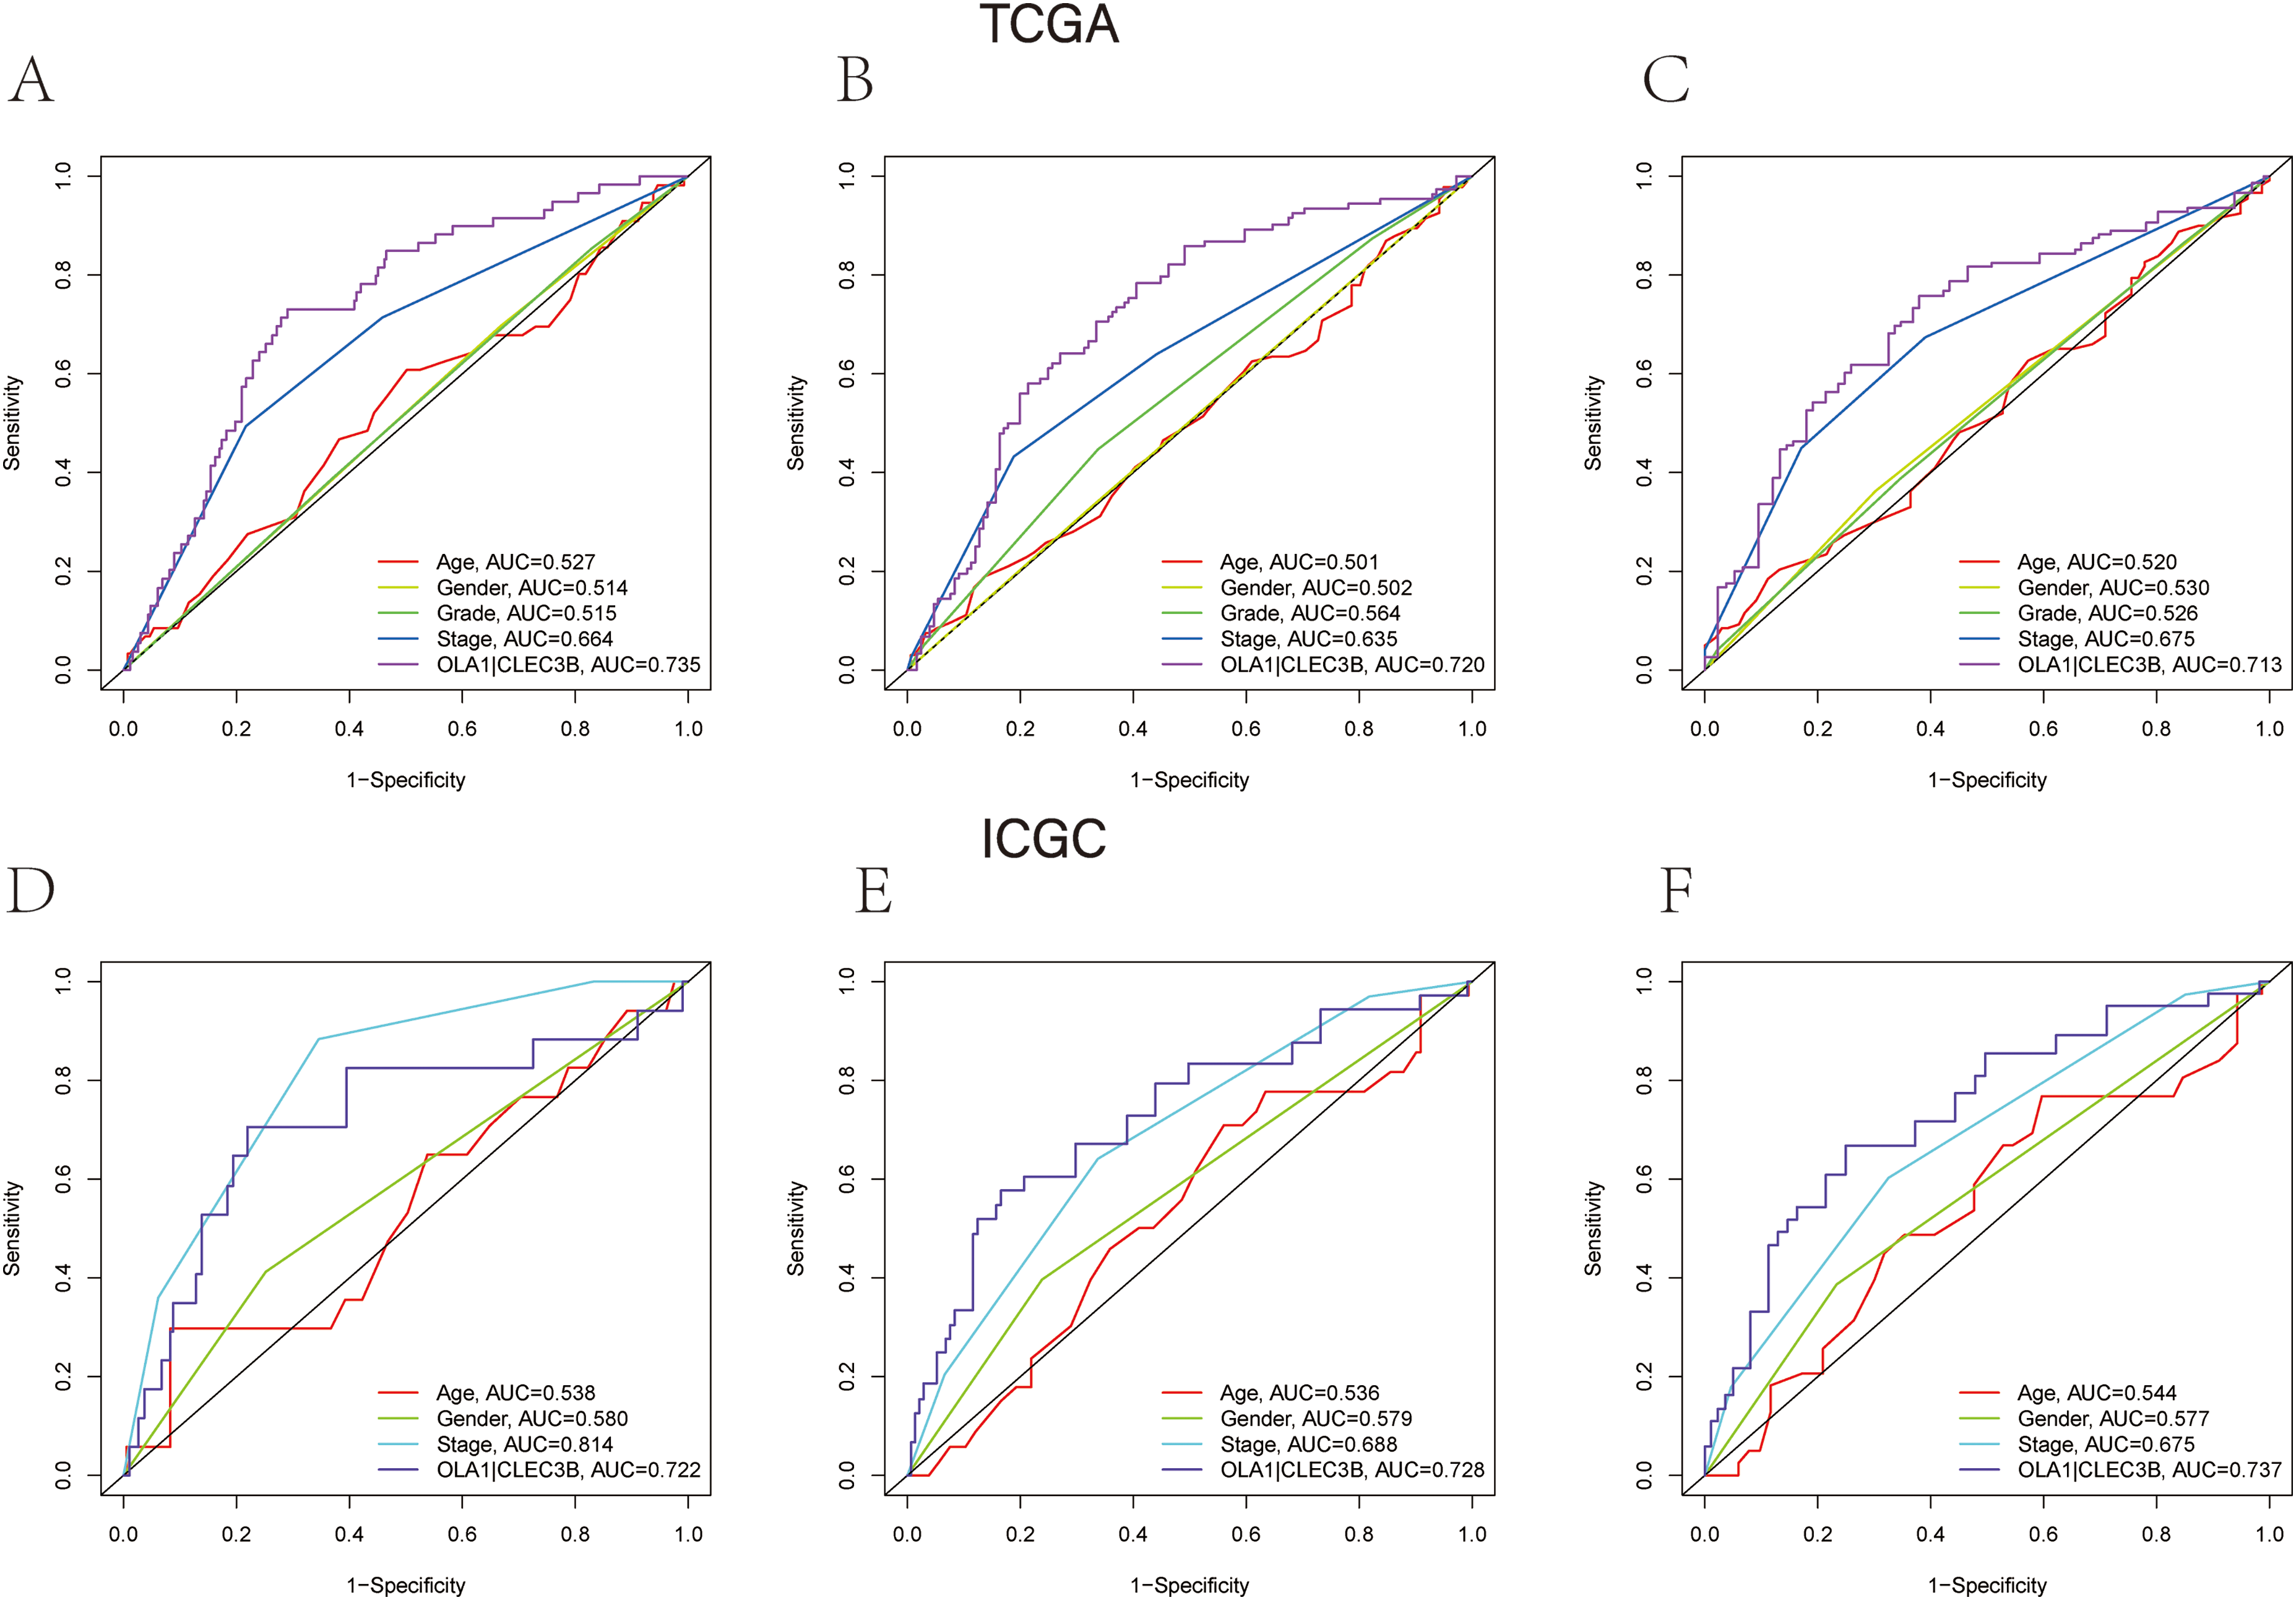
The time-ROC curves of clinical characteristics and OLA1|CLEC3B. TCGA cohort (A-C), ICGC cohort (D-F). The AUC of clinical characteristics and OLA1|CLEC3B at (A) 1-year, (B) 2-year, and (C) 3-year OS in the TCGA cohort. The AUC of clinical characteristics and OLA1|CLEC3B at (D) 1-year, (E) 2-year, and (F) 3-year OS in the ICGC cohort.
Nomogram of OLA1|CLEC3B with Clinical Characteristics
The nomogram was plotted to predict 1-, 2-, and 3-year survival based on OLA1, CLEC3B, OLA1|CLEC3B, and other clinical features in the TCGA cohort database (including tumor stage, tumor grade, age, and gender). We constructed the nomogram model according to the multivariate Cox analysis (Figure 7A-B), each factor in the nomogram was assigned a score, then the total nomogram score from the sum of individual scores of all predictors was obtained. All calibration plots (dotted lines) exhibited satisfactory consistency between the predicted and observed probabilities for 1-, 2-, and 3-year OS in the TCGA (Figure 7C-E) and ICGC cohorts (Figure 7I-K). The ROC curves also reflect the stable predictive ability of this nomogram over a 3-year period (TCGA: 1-year AUC: 0.750, 2-year AUC: 0.714, 3-year AUC: 0.749; Figure 7F-H; ICGC: 1-year AUC: 0.784, 2-year AUC: 0.780, 3-year AUC: 0.775; Figure 7 L-N). This suggests that the prediction model has an impressive predictive reliability.

Nomogram models and the calibration curve and the ROC curve. TCGA cohort (A, C-H), ICGC cohort (B, I-N). Nomogram combining clinical characteristic parameters and OLA1|CLEC3B for predicting the OS for HCC patients from (A) TCGA cohort and (B) ICGC cohort. (C-E, I-K) The calibration plots for the OS nomogram model at (C) 1-year, (D) 2-year, and (E) 3-year OS in the TCGA cohort. The calibration plots for the OS nomogram model at (I) 1-year, (J) 2-year, and (K) 3-year OS in the ICGC cohort. Calibration curves of nomograms showed the correlation between the predicted probability and actual diagnostic results. The grey solid line represents the prediction results, and the red solid line represents the actual results. The high degree of coincidence between the two indicated that the prediction results are reliable. The ROC curves of OS nomogram model at (F) 1-year, (G) 2-year, and (H) 3-year OS in the TCGA cohort. The ROC curves of OS nomogram model at (L) 1-year, (M) 2-year, and (N) 3-year OS in the ICGC cohort.
Immune status Analysis in Different OLA1|CLEC3B Risk Groups
To systematically assess the composition of the tumor immune microenvironment (TME) in the high- and low-OLA1|CLEC3B, the immune cell infiltration and immune cell function within the tumor in each cohort were quantified by ssGSEA. We found significant differences in the major cellular components correlated with antitumor immunity in the two groups. Of note, TME of the low- OLA1|CLEC3B group displayed a prominent cells infiltration (B cells, neutrophils, NK cells, and T helper cells) at baseline and a more active immune-related functions (cytolytic activity, para-inflammation, type I IFN response, and type II IFN response) (Figure 8A and F). Meanwhile, we found a significant negative correlation between OLA1|CLEC3B and the stromal score in most cells in the two cohorts (Figure 8B, C, G, and H).

Immune status analysis, stromal score and tumor purity of high- and low-risk groups in the TCGA cohort (A-E) and ICGC cohort (F-J). (A, F) Relative enrichment of immune infiltrating cells and immune-related functions in two subgroups. (B, G) The association of OLA1|CLEC3B with stromal score density. (C, H) The association of OLA1|CLEC3B with stromal score. (D, I) The association of OLA1|CLEC3B with tumor purity density. (E, J) The association of OLA1|CLEC3B with tumor purity. P values were showed as: ns, not significant; *P < .05; **P < .01; ***P < .001.
Correlation of OLA1|CLEC3B with Tumor Purity
We define tumor purity to be the inferred proportion of the tumor cells in the sample compared to other cell types. By correlation analysis, we noticed that tumor purity in the high-risk group was elevated as higher OLA1|CLEC3B levels (Figure 8D, E, I, and J), proved a positive correlation between them.
Functional Enrichment Analysis with GO and KEGG
Pathway enrichment analysis was conducted using gene set enrichment analysis (GSEA) to gain insight into the biological function underlying OLA1|CLEC3B in HCC.GO function enrichment analysis suggests that the most enriched gene ontology category of the genes highly expressed in the high-risk group was related to the phase transition in cell cycle, including G2/M transition of mitotic cell cycle, regulation of apoptotic signaling pathway, cell cycle checkpoint, G1/S transition of mitotic cell cycle, G0 to G1 transition, cell growth, and cellular response to hypoxia (Figure 9A and C). Furthermore, enrichments in cell cycle, mismatch repair, ubiquitin-mediated proteolysis, carbon metabolism, longevity regulating pathway, AMPK signaling pathway, VEGF signaling pathway and were exhibited through KEGG pathway analysis (Figure 9B and D).

Enrichment analysis of biological function and pathway. TCGA cohort (A, B), ICGC cohort (C, D). (A, C) GO, Gene Ontology. (B, D) KEGG, Kyoto Encyclopedia of Genes and Genomes.
Gene Expression of Cell Cycle Pathway in Different OLA1|CLEC3B Risk Groups
To ascertain the molecular mechanism of cell cycle-related pathway, we detected the expression of cell cycle-related genes in OLA1|CLEC3B, due to most cell cycle-related biological pathways being enriched in high OLA1|CLEC3B. The results demonstrated that the cell cycle pathway-related genes, including CCNA2, CCNB1, CCNB2, CDC20, CDC23, CDC25A, CDK1, CDK2, CDK4, CDK7, CHEK1, CHEK2, E2F1, E2F3, and E2F5, were overexpressed in high OLA1|CLEC3B compared with low OLA1|CLEC3B, while no conspicuous overexpression in low OLA1|CLEC3B was observed in this way (Figure 10 A-B).

Distribution of cell cycle-related genes in high- and low-risk groups. TCGA cohort (A), ICGC cohort (B). The scores of 16 cell cycle-related genes. P values are shown as ns, not significant; *, P < .05; **, P < .01; ***, P < .001.
OLA1|CLEC3B Expression Correlates with Cell Cycle-Related Molecules
We next analyzed the correlation between the expression level of OLA1|CLEC3B and cell cycle-related molecules, including CDK1, CCNB1, CDK4, CCNB2, CDC25A, CDC20, CDK2, CHEK1, E2F5, CDK7, CDC23, E2F3, E2F4, E2F1, CHEK2, CCNA2 from TCGA cohorts (Figure 11A), CDC20, CCNB1, CDK1, CCNB2, E2F5, CDK4, CDC25A, CHEK1, CCNA2, E2F1, E2F3, CDK2, CDK7, CHEK2, E2F4 from ICGC cohort (Figure 11B). It exhibited that OLA1|CLEC3B expression was positively and statistically significantly correlated with cell cycle-related genes(P < 0.05).

Correlation analysis between OLA1|CLEC3B and cell cycle-related molecules. (A) Scatter plots of the association between the gene pair OLA1|CLEC3B expression and cell cycle-related molecules in the TCGA cohort. (B) Scatter plots of the association between the gene pair OLA1|CLEC3B expression and cell cycle-related molecules in the ICGC cohort.
OLA1 Knockdown Inhibits the Growth of HCC Cell Lines
To further clear the role of OLA1 in regulating HCC growth, we first knocked down OLA1 expression and established stable silenced cell lines. As Figure 12 shows, silence of OLA1 expression suppressed cell proliferation (Figure 12A) and increased cell apoptosis to a large extent in Huh7 cells (Figure 12B). In addition, knockdown of OLA1 significantly prolonged the S phase of the cell cycle (Figure 12C and D). Subsequently, we set out to explore the sensitivity of OLA1 knockdown cells to gemcitabine.7,8 We first constructed a gemcitabine-resistant cell line (Figure 12E). For all we know, Huh7 cells were less sensitive to gemcitabine. But what we noticed was that the number of apoptotic cells was much higher in the gemcitabine + OLA1 knockdown group than in the gemcitabine group (Figure 12F). Therefore, we conclude that Huh7 cells gained increased sensitivity to gemcitabine after OLA1 knockdown. Moreover, we also concluded that expression of CD80, hepatitis A virus cellular receptor (HAVCR), lectin galactoside-binding soluble-9(LGALS9), and vascular endothelial growth factor B (VEGFB) were positively correlated with down-regulation of OLA1 expression. (Figure 12G)
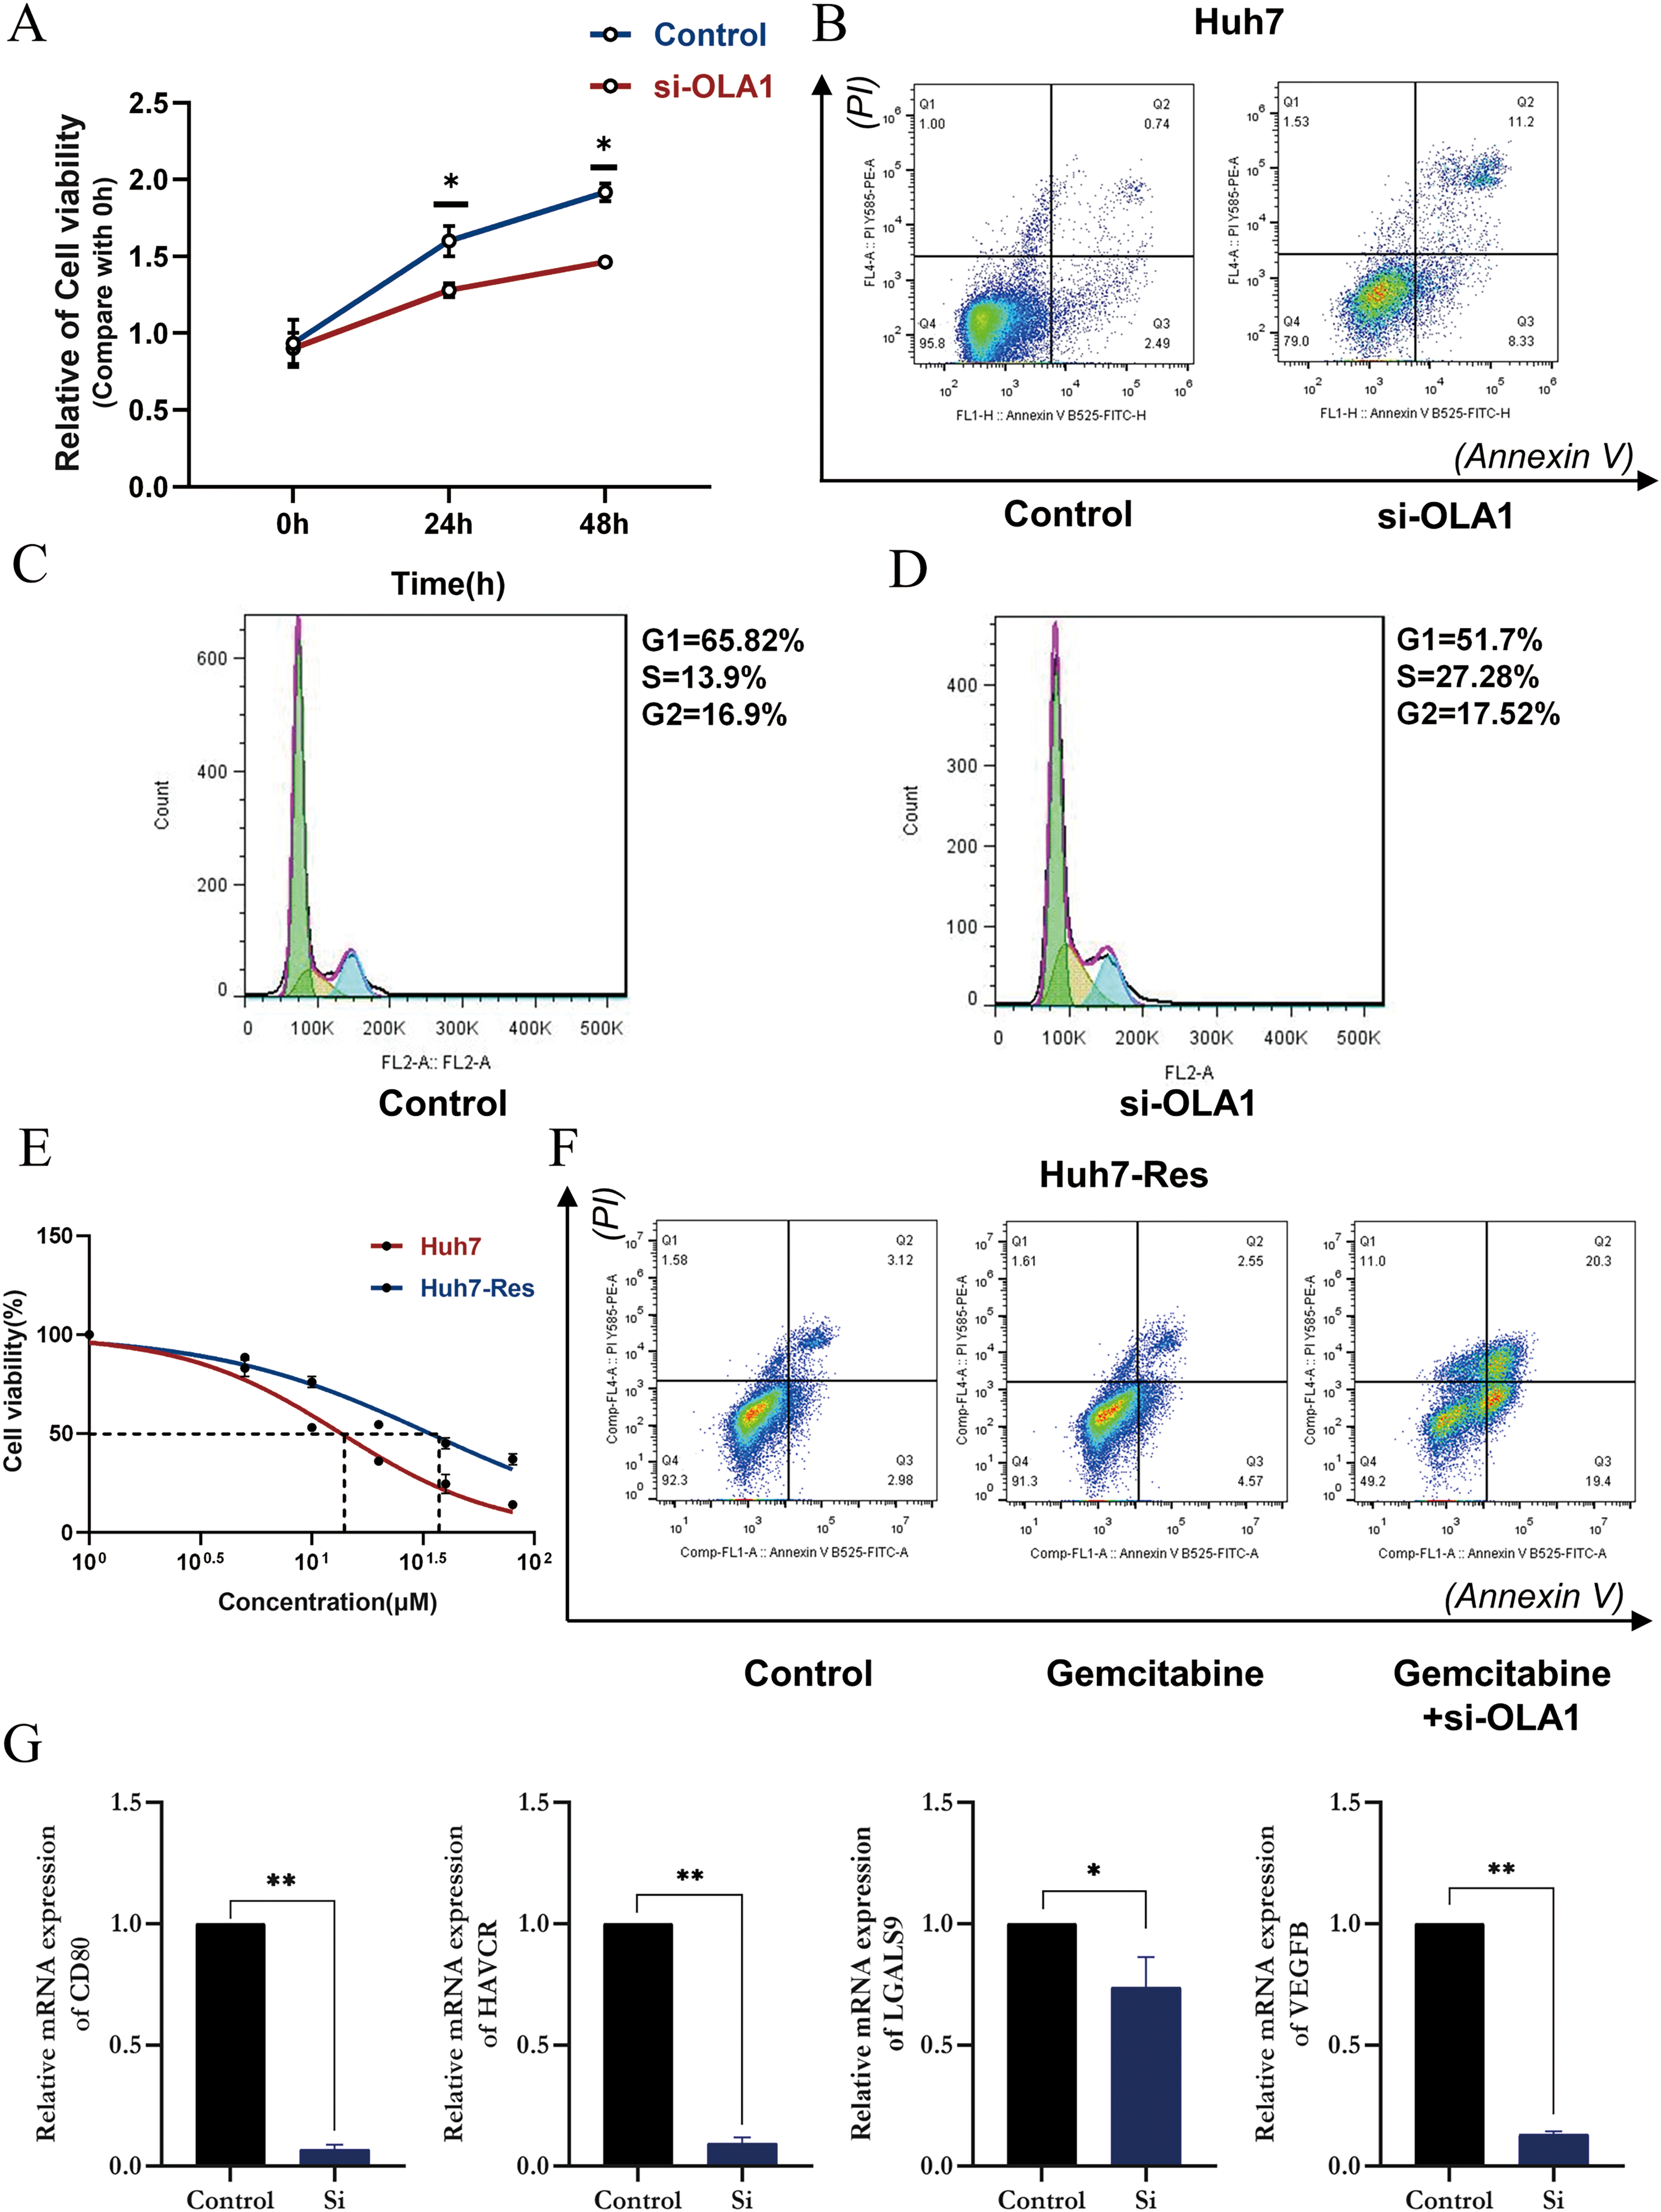
Cell experiments presenting the impact of OLA1 knockdown in HCC cells lines. (A) OLA1 knockdown significantly reduces cell viability of HCC. The red solid line represents OLA1 siRNA and the blue solid line represents vector control. (B) OLA1 knockdown promoted apoptosis of HCC cells. (C) Cell-cycle analysis before OLA1 knockdown with PI stained assay. (D) Cell-cycle analysis after OLA1 knockdown with PI stained assay. (E) We constructed a gemcitabine-resistant Huh7 cell line. (F) The sensitivity of the Huh7-RES cells to gemcitabine. OLA1 knockdown increased the apoptosis of HCC cells induced by gemcitabine. Annexin V (−) PI (−), annexin V (+) PI (−), annexin V (+) PI (+), and annexin V (−) PI (+) cells were defined as viable, early apoptotic, late apoptotic, and necrotic cells, respectively. (G) The mRNA levels of CD80, HAVCR, LGALS9 and VEGFB in Huh7 cells were analyzed by RT-qPCR.
Discussion
In recent decades, the complexity and variability of HCC have dramatically interfered with the effectiveness of conventional treatment and have gradually become a major obstacle and bottleneck in the treatment of HCC. 3 Although survival rates of patients with HCC in some countries have improved, 9 due to clinical trials optimizing individual treatment strategies and the development of more complex treatment modalities,10–12 recurrence and metastasis rates remain high. 13 Therefore, there is an urgent need for a deeper understanding of the molecular mechanisms of HCC to develop new therapeutic approaches to improve long-term survival, and this is where the present study aims to specifically elucidate the role played by gene pair OLA1|CLEC3B in the prognosis of HCC.
The findings of our study showed that OLA1|CLEC3B was upregulated in HCC samples compared with adjacent non-tumorous tissues in the transcriptome profiling data from public resource databases. Furthermore, a risk score was determined to be associated with clinical features, including clinical stage; histological grade; and cancer status. Moreover, it was found that high-risk score in patients with HCC was related with poor OS time, and OLA1|CLEC3B served as an independent prognostic factor. Additionally, it was determined that OLA1|CLEC3B promoted HCC cell proliferation, cell cycle, and reduced apoptosis. Taken together, these results suggested that OLA1|CLEC3B functioned as a potential oncogenic gene pair in HCC and that OLA1|CLEC3B overexpression was a predictor of poor prognosis.
Obg-Like ATPase 1 (OLA1) is a member of the YchF subfamily p-Loop GTPase, 14 P-loop GTPases are the most abundant nucleotide-binding proteins and mediate diverse cellular processes, including signal translation, intracellular transport, signal transduction, cell proliferation, stress response, 15 embryonic development, and protein translation. 16 OLA1 is highly conserved compared to other Obg family members, but the NKxD shared sequence in the G4 structural domain is replaced by NxxE, so it lacks specificity for binding nucleotides and therefore it can hydrolyze ATP and GTP. Previous reports demonstrated that OLA1 was overexpressed at the mRNA level in colon, stomach, ovarian, uterine, and lung cancers and the protein level in colon cancer compared to its expression in its normal tissue counterparts.17,18
OLA1 is engaged in regulating tumor progression in a variety of cancers, including breast, 18 lung, 19 and HCC. 20 Besides, studies have implied that the regulation of OLA1 in tumorigenesis may be bidirectional, either inhibiting or promoting the cancer, and mechanistic studies suggested that OLA1 drives activation of the Rb/E2F1 pathway through regulation of CDK2 and P21, thereby activating tumorigenicity and progression of HCC. 21 The cell cycle protein-dependent kinase (CDK) inhibitor p21 (also known as p21(WAF1/Cip1)) is one of the factors that promote cell cycle arrest in response to various stimuli. 22 Typically, CDK2 interacts with cyclin A and cyclin E to spur cell cycle entry, while p21 inhibits these interactions and halts cell cycle progression. 23
In current study, high level of CDK2 in the high-risk group was truly detected. We also found that OLA1 was significantly overexpressed in HCC tissues and the knockdown of OLA1 inhibited the proliferation of HCC cells, promoted cell apoptosis and blocked the cell cycle in our analysis, which was consistent with previous researches. We also detected CLEC3B, a member of the C-type lectin domain family, is a fibrinogen-kringle-4 binding protein that can be detected in various endocrine tissues as well as epithelial and mesenchymal cells, 24 including fibroblasts, monocytes, and neutrophils. 25 Studies have shown that aberrant CLEC3B expression plays an important role in tumorigenesis and metastasis in gastric, 26 breast, 27 cervical, ovarian, 28 bladder, 29 and melanoma cancers. 30 Analysis of CLEC3B mRNA expression levels in normal and tumor tissues revealed that CLEC3B expression was significantly downregulated in most tumors, with the same expression pattern in the different databases used for HCC. 31 Likewise, our results came to the same conclusion, indicating that CLEC3B was significantly down-regulated and had great diagnostic value for HCC, since overexpression of CLEC3B showed an impact of inducing cell proliferation inhibition, cell cycle arrest, and apoptosis of HCC cells. Thus, our results suggested that CLEC3B expression can distinguish HCC patients from healthy individuals with high sensitivity and specificity.
Although some studies of the effects of OLA1 and CLEC3B have been launched, respectively, to our knowledge, there is no practical research combined OLA1 with CLEC3B for exploring the effects in HCC. However, our study has argued that not only OLA1|CLEC3B provide an ability of predicting the prognosis of HCC, but also better than that in individual genes.
Nomograms are commonly used tools to estimate prognosis in oncology and medicine. 32 In this study, the predictive potential of our gene pair was further confirmed, when we combined it with a few selected clinicopathological features, as well as tumor stage in a risk-assessment nomogram. The calibration plots based on the TCGA and ICGA databases showed good consistency. The main advantage of the model is that it provides a complementary perspective on individual tumors and develops an individual scoring system for patients. Thus, this nomogram may be a better decision-making tool to help HCC patients choose therapeutic options.
In recent years, tumor immunotherapy has developed rapidly as the role of the immune system in the occurrence and development of cancer has become increasingly recognized. 33 The HCC tumor microenvironment (TME) is a dynamic system that comprises cancer cells, the intricate cytokine environment, extracellular matrix, various infiltrating immune cell subsets, and other components. 34 The TME coexists and interacts with diverse immune cells to sustain the growth of HCC. Therefore, immunosuppressive cells play an essential part in the antitumor immune response. 35
The presence of TIL, known as a favorable prognostic indicator in a number of cancers,
36
has been proven to correlate with type I IFN transcriptional profiles, and other studies have validated the critical role of type I IFN response,37,38 type II IFN response, and cytolytic activity.
39
In CD8a + DC-mediated antigen cross-presentation and tumor-specific CD8+ T cell initiation while type I IFN response mediates the rewiring of neutrophils to an anti-tumor phenotype.
40
Moreover, it is now clear that innate immune cells, particularly NK cells, play a relevant defensive role in controlling tumor growth and metastasis.
41
Similarly, B cells play a role in anti-tumor immunity. Available evidence suggests that TIBs inhibit tumor progression by secreting immunoglobulins that promote T-cell responses and directly kill cancer cells.
42
Notably, In our study, all of the above immune cells exerted anti-tumor effects, with a lower proportion in high-risk group and para-inflammation, characterized by activation of many genes involved in innate immunity with tumor-suppressive nature,
43
was also attenuated in high-risk group. Naturally, we speculated that diminished anti-tumor immunity may explain the poor prognosis of the high-risk group. Noteworthy, OLA1 knockdown cells exhibited a low expression of immune regulation-related genes (CD80 and LGALS9), which has been proved overexpressed in most tumor cells,44,45 It is known that LGALS9 acts as a primary regulator of tumor progression by inhibiting DC antigen presentation
46
and cytotoxic T cell activation,
47
and loss of this inhibition can cause durable systemic antitumor immunity. And CD80-CTLA-4 pathway inhibits T cell activation,
48
so targeting the CTLA4-CD80 pathway may be purposed for immunotherapy strategies. In total, promoting the expression of immune-related genes could be a pivotal method to suppress anti-tumor immunity in high-risk populations
Tumor purity is defined as the proportion of cancer cells in the tumor tissue, reflecting the features of TME. 49 And HCC patients tend to have a worse prognosis with higher tumor purity. Consistently, OLA1|CLEC3B was negatively correlated with stromal score and immune score but positively correlated with tumor purity, precisely showing that OLA1|CLEC3B high expression leads to diminished antitumor immunity and poor prognosis in HCC.
To further explore the mechanism of OLA1|CLEC3B regulating biological processes of HCC, GO, and KEGG analysis were carried out. We found that cell-cycle pathway was most enriched in high OLA1|CLEC3B group, many other signal pathways that related to cell-cycle such as G2/M transition of mitotic cell cycle, cell cycle checkpoint, and G1/S transition of mitotic cell cycle were also notably enriched.
Uncontrolled cell proliferation due to aberrant regulation of cell cycle signaling transduction pathway control can provoke the initiation and malignant development of cancer. 50 A source of cancer and tumorigenesis development lies in the defective regulation of the mitotic process. 51 G2/M transition and G1/S transition are two key steps in the mitotic cycle of cells, while Cell cycle checkpoints are an essential cellular mechanism for preventing uncontrolled proliferation caused by oncogenic stimuli. 52
Thus, there could be a reason that high OLA1|CLEC3B may promote persistent cancer cell proliferation by enhancing the G1/S phase and G2/M phase transitions in the cell cycle, under which case the checkpoints were activated, meaning some possible errors have been detected. Other than that, carbon metabolism, 53 ubiquitin-mediated proteolysis,54 and AMPK signaling pathway 55 were proved to be strikingly enriched. Interestingly, all the pathways mentioned above have been shown to be involved in the cancer process, implying that OLA1|CLEC3B may regulate the biological process of HCC by modulating the above signal pathways to produce a malignant prognosis.
To further validate these findings, we examined the enrichment of cell cycle-related genes in different risk groups. It is widely known that cell cycle progression is a complex process governed by cyclins, cyclin-dependent kinases (CDKs), and CDK inhibitors and cell cycle is frequently dysregulated in neoplasia due to alterations in oncogenes that indirectly affect the cell cycle. Of note, in both ICGC and TCGA databases, the cell cycle-related genes we examined including CCNA2, 56 CCNB1, 57 CDC20, 58 CDC23, 59 CDC25A, 60 CDK1, CDK2, 61 CDK4, CDK7, 62 CHEK1, CHEK2, 63 E2F1, E2F3, E2F4, E2F5 64 showed a trend of overexpression in the high-risk group. Our current research showed that OLA1|CLEC3B levels demonstrated strong correlations with a variety of cell cycle-related molecules including CDK1, CCNB1, CDK4, CCNB2, CDC25A, CDC20, CDK2, CHEK1, E2F5, CDK7, CDC23, E2F3, E2F4, E2F1, CHEK2, CCNA2 from TCGA cohorts and CDC20, CCNB1, CDK1, CCNB2, E2F5, CDK4, CDC25A, CHEK1, CCNA2, E2F1, E2F3, CDK2, CDK7, CHEK2, E2F4 from ICGC cohort. Previous studies have shown that OLA1 will result in upregulation of CDK2 and E2F1, thus processing the transition from G1 to S phase. 21 Our experiments demonstrated that the S-phase of the cell cycle was also prolonged after si-OLA1, which was consistent with our expectation. So, it is reasonable to extrapolate that high OLA1|CLEC3B can result in uncontrolled tumor cell proliferation and poor prognosis of HCC by facilitate the transition between the G1/S phases of the cell division cycle. Other notable enrichment signaling pathways such as VEGF, HIF-1, and AMPK also attracted our attention. Activation of AMPK under hypoxia mediates the stress response to promote autophagy, which stabilizes HIF-1α and leads to increased VEGF expression. thereby promoting angiogenesis.65–67 Likewise, we detected that tumor angiogenesis-related genes such as HAVCR and VEGFB are low-expressed in si-OLA1 cells. HAVCR is known to be implicated in the process of angiogenesis via the activation of the STAT3 pathway resulting in increased HIF-1α.68,69 The role of VEGFB in tumor angiogenesis is also following upregulation of the HIF-1. 70 Taken together, dismal prognosis in high-risk group may be caused by abundant angiogenesis in tumor. Anti-angiogenesis therapies provide a novel strategy for the treatment of cancer involving pathological angiogenesis.
Undoubtedly, the current study has limitations to some extent. Firstly, limited by experimental conditions, the effect of CLEC3B overexpression on HCC has not been further investigated. Secondly, our study is based on public datasets and in vivo experiments involving human tissue and animals have not been performed. needs to be confirmed in prospective studies. In our further work, larger studies containing the relevance between efficacy of recent immune checkpoint inhibitors and kinase inhibitors with OLA1|CLEC3B expression will be required. In addition, the mechanisms of OLA1|CLEC3B on the proliferation and metastasis of HCC cells remain to be further explored.
In summary, we found that a higher level of OLA1 along with a lower level of CLKEC3B is a sign of a poor prognosis and have established and verified the predictive effect of a gene pair on the prognosis of HCC from the immune status, cell cycle pathway and experiments of gene knockdown, implying that the gene pair may act as a promising candidate therapeutic target for HCC.
Supplemental Material
sj-xlsx-1-tct-10.1177_15330338241241935 - Supplemental material for Combined OLA1 and CLEC3B Gene Is a Prognostic Signature for Hepatocellular Carcinoma and Impact Tumor Progression
Supplemental material, sj-xlsx-1-tct-10.1177_15330338241241935 for Combined OLA1 and CLEC3B Gene Is a Prognostic Signature for Hepatocellular Carcinoma and Impact Tumor Progression by Zhoufeng Chen, Liuwei Zeng, Zhuoyan Chen, Jun Xu, Xiangting Zhang, Huiya Ying, Yuan Zeng and Fujun Yu in Technology in Cancer Research & Treatment
Supplemental Material
sj-xlsx-2-tct-10.1177_15330338241241935 - Supplemental material for Combined OLA1 and CLEC3B Gene Is a Prognostic Signature for Hepatocellular Carcinoma and Impact Tumor Progression
Supplemental material, sj-xlsx-2-tct-10.1177_15330338241241935 for Combined OLA1 and CLEC3B Gene Is a Prognostic Signature for Hepatocellular Carcinoma and Impact Tumor Progression by Zhoufeng Chen, Liuwei Zeng, Zhuoyan Chen, Jun Xu, Xiangting Zhang, Huiya Ying, Yuan Zeng and Fujun Yu in Technology in Cancer Research & Treatment
Footnotes
Abbreviations
Acknowledgments
We would like to thank all the editors and anonymous reviewers for their insightful advices.
Declaration of Conflicting Interests
The authors declared no potential conflicts of interest with respect to the research, authorship, and/or publication of this article.
Ethical Approval
We use information of all HCC patients from publicly available databases and conduct in vitro cell experiments, which is not applicable for ethics approval.
Funding
The authors disclosed receipt of the following financial support for the research, authorship, and/or publication of this article: This work was supported by Zhejiang Provincial Natural Science Foundation of China, the Wenzhou Municipal Science and Technology Bureau, Zhejiang Provincial Medical and Health Science and Technology Plan Project, (grant number No. LY23H030003, No. Y20220024, No. 2024KY1264).
Supplemental Material
Supplemental material for this article is available online.
References
Supplementary Material
Please find the following supplemental material available below.
For Open Access articles published under a Creative Commons License, all supplemental material carries the same license as the article it is associated with.
For non-Open Access articles published, all supplemental material carries a non-exclusive license, and permission requests for re-use of supplemental material or any part of supplemental material shall be sent directly to the copyright owner as specified in the copyright notice associated with the article.