
Abstract
Keywords
Introduction
Cancer accounts for one-third of the causes of death, and this rate is increasing remarkably every year. 1 There are different treatment options for this disease, including surgery, chemotherapy, radiotherapy, and alternative medicine. With the development of technology, advances in radiotherapy devices and application methods have brought radiotherapy to the forefront among cancer treatment modalities.2,3 Despite such advances, factors such as radioresistant tumors (eg, hypoxia) or low-tolerance doses of organs at risk around the target area can limit the effectiveness of radiotherapy. 4
A sufficient dose of radiation can cause the desired damage to the tumor cell. This is called radiotherapeutic dose. 5 However, the radiotherapeutic dose is limited because of the potential radiotoxic effect on normal tissues toward the radiation beam. Therefore, various methods have been developed to reduce the normal tissue dose. The use of mega-voltage (in the range of 6-25 MV) x-rays creates a skin-sparing effect, whereas techniques such as intensity-modulated radiotherapy and volumetric-modulated radiotherapy provide a highly conformal dose distribution to tumors. 6
In general, mitotically active tumor cells are more sensitive to radiation than normal tissues such as the gastrointestinal tract, lung, brain, and bone marrow. In contrast, the treatment of infiltrative cancers such as CNS cancer, head and neck cancer, and bowel cancer is very difficult because they are radioresistant. Various studies have been conducted to eliminate such restrictions. One of these studies is to increase the dose in the tumor tissue while keeping the dose in the surrounding tissues constant. The term “dose enhancement factor” (DEF) is commonly used in the field of radiation therapy, particularly in the context of radiotherapy for cancer treatment. DEF refers to the increased dose delivered to a specific region, usually the target tissue or tumor, when certain materials or techniques are used in conjunction with radiation therapy. Physically, DEF is the numerical factor by which the water-equivalent dose increases because of the presence of nanoparticles (NPs).7–11
The most common agent used to increase DEF is iodine-containing organic molecules. 12 The iodine compound dissolved in water is rapidly excreted from the liver and kidney. Therefore, even for imaging, there may not be enough time. The duration can be extended using nanosized iodine oils. However, iodine can cause allergic reactions and toxic effects on the kidney. Compared with normal tissues, malignant cells exhibit larger gaps in their walls and rich vascularity. Furthermore, there is a lack of structural integrity with lymphatic drainage, which leads to prolonged retention of macromolecules in tumor tissues. Thus, the term “enhanced permeability and retention (EPR)-effect” of macromolecules and lipids in tumor tissues was used to describe this phenomenon.13,14 Consequently, the permeability and uptake of microscopic particles between 1 and 100 nm, called NPs, are greater in tumor cells than in normal tissues. 15
Numerous parameters affect the distribution of NPs in tissues, such as size, shape, molarity, and tumor activation. Many studies have shown that although the NP uptake amount is higher in tumor tissues than in normal tissues, this uptake level is not sufficient. This caused the idea of sending NPs to the body by binding with a tumor-specific agent. B. Aydogan et al reported the successful binding of gold NPs (AuNPs) with 2-deoxy-d-glucose (2-DG) and 1-deoxy-d-glucose (1-DG) to the tumor structure. They observed a significant increase in the amount of AuNP-2-DG contrast agent uptake compared with AuNPs and AuNP-1-DG. 16
A Monte Carlo (MC) simulation study by P. A. Jackson et al showed that a molar (M) AuNP concentration of 0.5077 caused a dose change of 88% in x-rays with 40 to 80 kVp energies and approximately 115% in x-rays with 80 to 140 kVp energies. 17 In another study, DEF was approximately 5% in high-energy treatments.18,19 However, the effects of high concentrations and the shape and size of AuNPs remain a significant research topic. In these studies, NPs were considered to be a homogeneous mixture with the tumor tissue, which is called the simple method in simulation, whereas changes in their shape, size, and amount were ignored. 20
Stephen J. McMahon et al investigated single AuNPs on the nanoscale dose enhancement in the range of the MV energy scale using the MC method. They further compared the results with the experimental findings. They showed that AuNPs create high-dose inhomogeneities in their surroundings. 21 Tatiana Wolfe et al investigated in vitro and in vivo the radiosensitization effect of AuNPs in prostate cancer as a potential clinical significance. In vivo studies in this field will also make it possible to apply this method, which aims to create radiosensitivity by applying megavoltage radiation, to the clinic. 22
There are limited studies in the literature regarding how NPs added to the tumor contribute to dose changes in the tissues around the tumor. However, because of the high cost and availability of AuNPs, researchers have focused on alternative metal oxides that are biocompatible and nontoxic.23,24 In this study, we aimed to seed different concentrations of silver nanoparticles (AgNPs) into a brain tumor using the Monte Carlo N-Particle Transport Version 6.2 (MCNP6.2) MC simulation software. We used both simple and nanolattice methods for 6 MV energies and performed dosimetric evaluation of DEF in the tumor and surrounding tissues.
Materials and Methods
The MC methods use physical models and databases to predict the interactions of particles and their interaction results. MCNP6.2 is a radiation transport code of the MC methods that statistically mimics nuclear events. It can model various radiation effects and events for different particle types, energies, and interaction materials. It is a widely used nuclear simulation software developed by LANL (Los Alamos National Laboratory) and is widely accepted in the scientific community. It is constantly updated. This study used the VisedX.25® geometric tool for MCNP6.2 simulations. It adopted MCNP6.2 to perform microdosimetry and nanodosimetry studies.
The simulations in our study were structured as a cube encompassing the skin, skull, brain tissue, OAR (6 of them), and PTV from the outside to the inner side (Figure 1). Materials m586 (ICRP Skin) for the skin, m332 (ICRU bone compact) for the skull, m344 (ICRP Brain) for the brain and OARs, and m23 (ICRU Tissue) for the PTV in the MCNP6.2 database were used. Particle addition processes to the PTV were performed using 2 different structures: the simple method and the nanolattice method.

Simulation geometry created with the Nano Lattice Method. A PTV of 1 × 1 × 1 cm3 was formed within the 5 × 5 × 5 cm3 brain (on the left) and microcubes containing NPs at different concentrations were placed inside (in the middle). The OARs have a thickness of 1 mm (on the right) (not scaled).
In a radiotherapy application, the most important factor limiting the dose increase in the tumor is the dose constraints of the surrounding healthy tissues. Therefore, dose changes in the surrounding tissues of NPs added to tumors should also be considered an important factor. In the present study, 1-mm-thick OAR tissues were defined on 6 surfaces of cubic tumor geometry (Figure 1). OARs were named based on their positions as follows: OARProximal toward radiation entry, OARDistal toward radiation exit, and OARLAT1, OARLAT2, OARLAT3, and OARLAT4.
Simple Method Setup
The simple method involves incorporating NP elements into the material based on their percentile or molar weights. It relies on achieving a uniform dispersion of the NPs throughout the material, irrespective of their shape, location, or density.
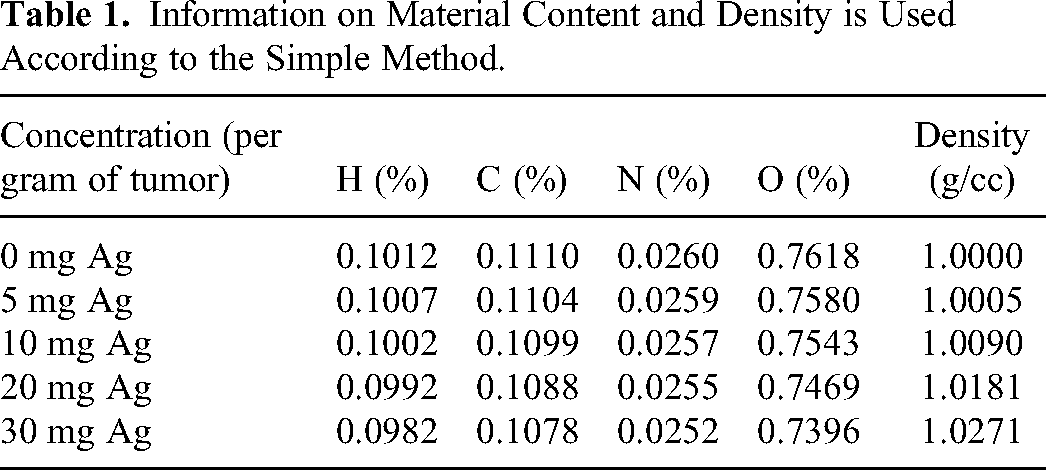
The amount of NPs that enter tumor cells is expressed in terms of concentration. For example, the 5 mg/g concentration in our study signifies 5 mg of NPs within 1 g of tumor tissue. In the literature, concentrations in the range of 0 to 35 mg/g have been used for various NPs while investigating their physical and biological effects.25,26 In this study, pure PTV and PTV consisting of 4 different silver concentrations (5, 10, 20 and 30 mg/g) were modeled based on a simple method. Material information about these concentrations is given in Table 1. The densities were calculated as the ratio of the sum of NP concentration mass and tumor mass to the total volume.
Information on Material Content and Density is Used According to the Simple Method.
Nano-Lattice Method Setup
When NPs are released into a medium, they are distributed through diffusion.21,23,27 To model the distribution of NPs in the cell as realistically as possible, the relevant tissue was divided into microcubic parts, with a single NP placed inside each of them.
Accordingly, the density of the silver NPs used in the study was 10.49 g/cc, and the size was determined to be a spherical 60 nm radius. The edge lengths of the cubes around the NPs were calculated numerically as 0.5160, 0.4096, 0.3252, and 0.2842 μm, so that the concentrations were 5, 10, 20, and 30 mg/g, respectively. Thus, the structure consisting of a spherical NP and microcube was distributed throughout the PTV (Figure 1).
In the simulation, we used a model that could generate a photon flux with a field width of 1 cm × 1 cm with a 6 MV flattening filter (FF) energy spectrum coming out of the conventional linac head. For source identification, 6 MV energy spectra were defined using si1 and sp1 energy cards from SDEF cards. It was placed at a distance of 100 cm along the z-axis using the pos card as the source point. The field size was set to 1 cm × 1 cm using the x, y, and z cards. Vec and as cards were used to propagate the photon flux in the negative z-direction. Variance reduction and Russian roulette methods were used to enhance simulation efficiency and reduce computer calculation time.
For dose reading in MCNP6, the dose of the whole volume can be measured cumulatively without the need for voxelization. 28 Accordingly, tally cards for dose reading were assigned volumetrically using the *f8 tally for PTV and 6 different OARs separately. After using the *f8 tally for the dosimetric reading, the deposition energy measured in MeV was multiplied by the factor needed for the conversion of MeV to Gy. The cutoff energy value for photons and electrons was chosen as 1 keV to shorten the calculation time because macroscopic volume dose measurements were performed.
In addition, the f4 tally was used to measure the photon flux in the relevant volumes. The e8 and e4 cards were used for the photon energy spectrum and photon deposition energy spectrum, respectively. For statistical significance to be P < .01 in the simulation, the number of particles run was set at 1×10⁷ and defined using the NP card.

Equation 2 shows the DEF values for the MC study conducted using the nanolattice method. These values were obtained by dividing the MC results with NPs (
Results
Figure 2 shows the DEF results of OARs and PTV for concentrations of 0 mg/g (soft tissue), 5, 10, 20, and 30 mg/g based on the simple method simulation. There is a linear relationship with the NP concentration for PTV in the DEF calculation based on the simple method. The DEF increased with increasing concentration (DEFPTV was 1.001, 1.005, 1.011, and 1.016 for 5, 10, 20, and 30 mg/g, respectively). The primary reason for this increase is that the atomic number of silver particles placed in the tumor is greater than the effective atomic number of the tumors. This can be attributed to the increase in the amount of photoelectric effect and Compton scattering, followed by an increase in secondary particle production and more energy deposition in the environment. However, when examining the DEFPTV values using the nanolattice method, the amount of increase was lower than that using the simple method, and at low NP concentrations, the DEF value was higher than that using the simple method (DEFPTV was 1.006, 1.007, 1.009, and 1.014 for 5, 10, 20, and 30 mg/g, respectively). The primary reason for this difference between the simple method and the nanolattice method is the local dose variations arising from the placement of NPs with specific shapes, sizes, and positions in the nanolattice model.

DEF factors of PTV and 6 surrounding OARs based on the silver nanoparticle concentration according to the Monte Carlo simulation study performed with simple method.
Figure 2 shows that the dose increase occurs in PTV for all concentrations; however, DEF values for lateral OARs were approximately 1.00 (±0.01). Small differences between DEF values in lateral OARs are included in the calculation uncertainties, and no remarkable dose difference is observed. As a consequence of increased concentration in the tumor, DEF values of proximal OARs increase with increasing concentrations due to increased backscattering, but DEF values of distal OARs decrease with increasing concentrations due to increased attenuation of photon flux.
However, the actual distribution of the material in the tissue is incompatible with the simple method. Therefore, the literature suggests a more realistic approach. In this regard, various simulation geometries can be created using the nanolattice model approach. The simulation geometry results created with the nanolattice model in our study are shown in Figure 3. Considering the results of the nanolattice model, DEF increased with increasing NP concentration. However, the increase rate was smaller than that of the simple method. Furthermore, in the simulation study conducted with the nanolattice method, an increase in DEFs was observed in all OARs. The main reason for this is that the nanolattice model shows a particulate distribution rather than an atomic distribution in a cell, and particles cause a localized increase in dose rather than a homogeneous increase in the cell.

DEF factors of PTV and 6 surrounding OARs based on the silver nanoparticle concentration according to the Monte Carlo simulation study performed with nano lattice method.
DEF in regions other than the radiation entry and exit directions, called lateral OARs, was examined. While there was no dose change in almost all these OARs in the simulation made using the simple method (DEF changing all lateral OARs from 0.992 to 1.002 for all concentrations), OAR dose changes occurred according to the simulation made using the nanolattice method (DEF changing all lateral OARs from 1.000 to 1.014 for all concentrations) (Figure 4).
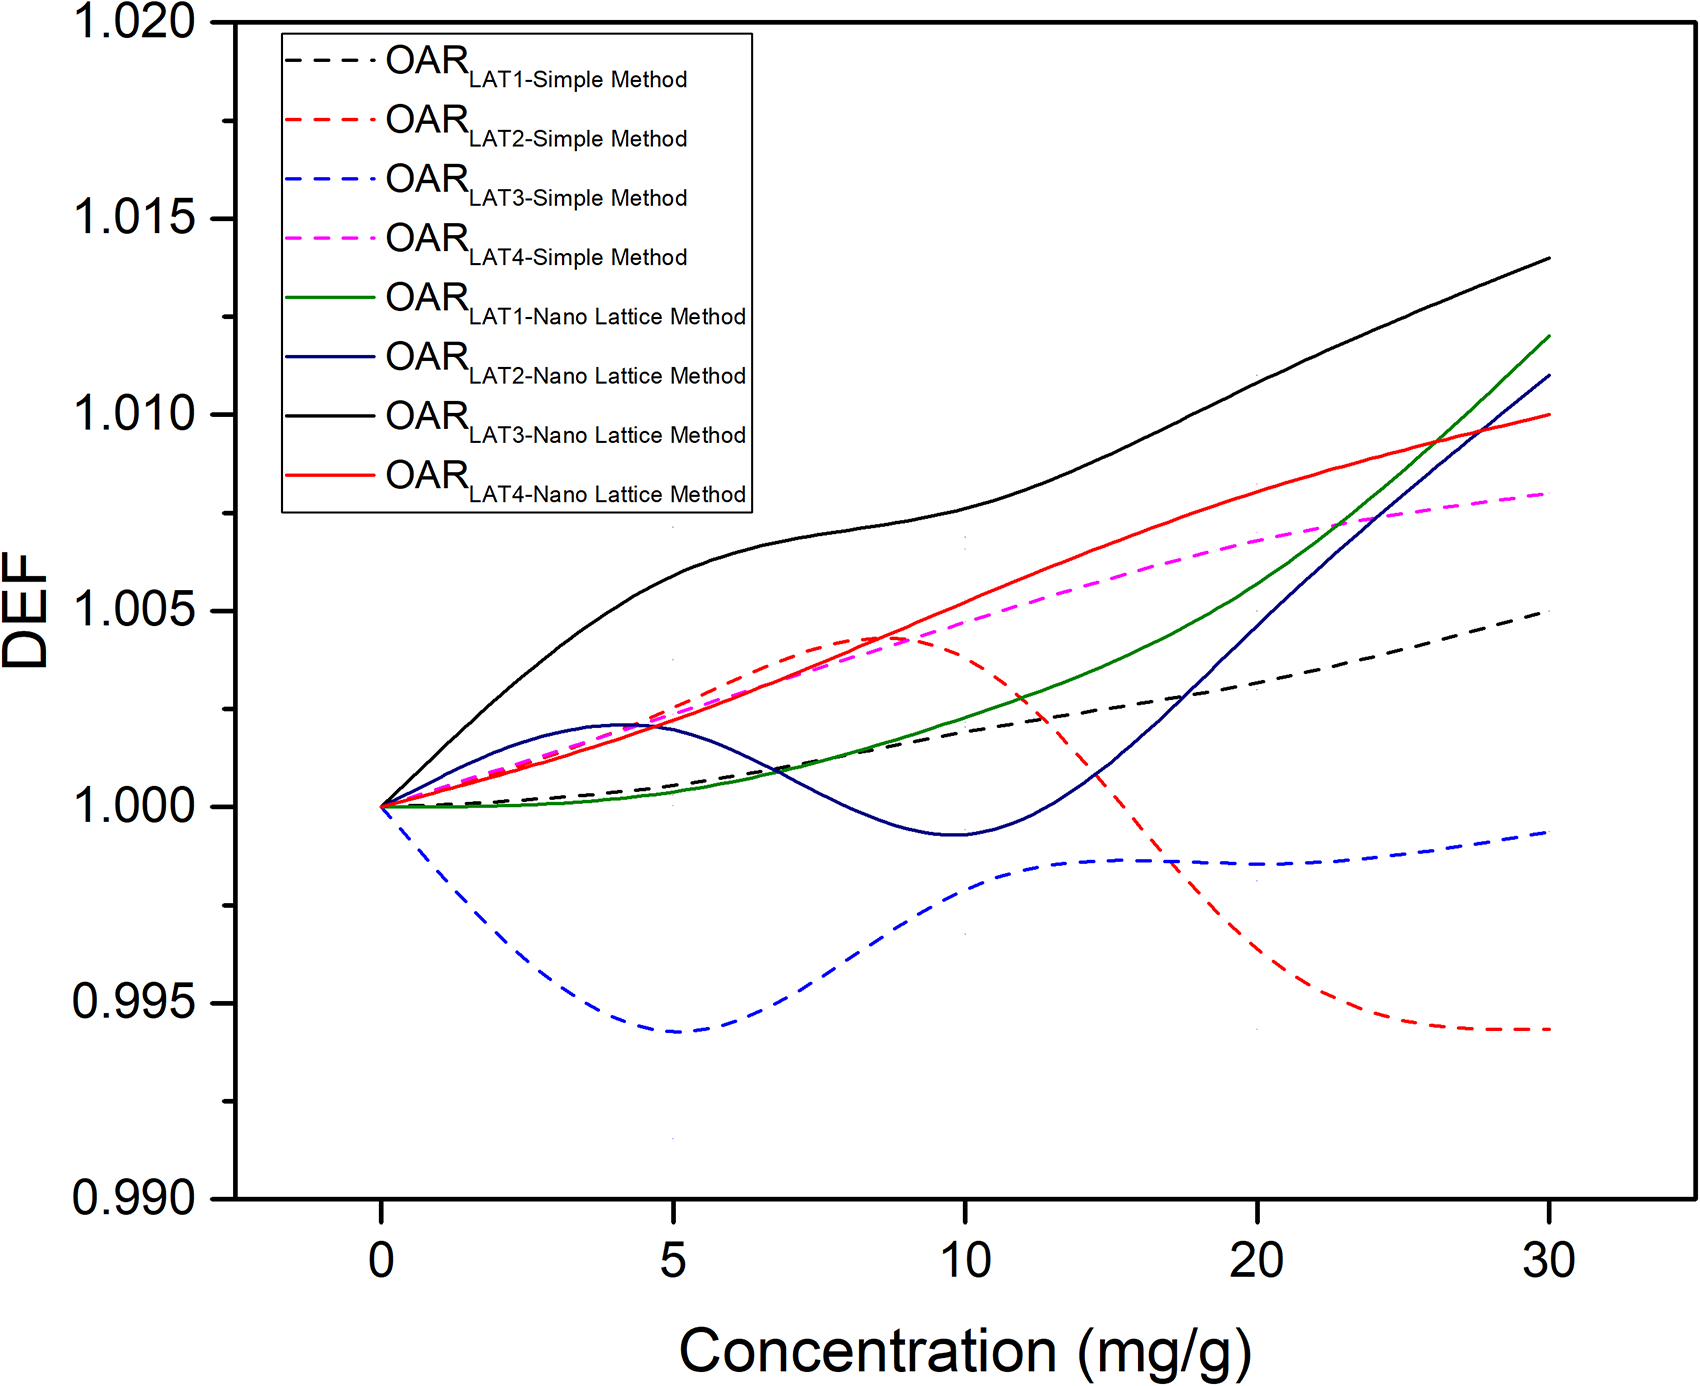
DEF factors of lateral OARs based on the silver nanoparticle concentration according to the Monte Carlo simulation study performed with simple method and with nano lattice method.
When DEFs were examined for proximal and distal OARs using the simple method, the OARProximal DEFs were 1.003, 1.006, 1.010, and 1.012 for 5, 10, 20, and 30 mg/g, respectively. The OARDistal DEFs were 0.990, 0.987, 0.977, and 0.976 for 5, 10, 20, and 30 mg/g, respectively. For the nanolattice method, the OARProximal DEFs were 0.997, 0.995, 1.004, and 1.012 for 5, 10, 20, and 30 mg/g, respectively. The OARDistal DEFs were 1.003, 1.005, 1.008, and 1.011 for 5, 10, 20, and 30 mg/g, respectively.
Regarding PTV with added AgNPs, there was a linear increase in PTV with the simple method and nanolattice method, whereas there was a dose increase not only in PTV but also in the surrounding healthy tissues in the simulation study performed based on the nanolattice method (Figure 5). Thus, the dose increase in the proximal OAR is related to the increase in PTV at high concentrations in accordance with the nanolattice method. According to the simple method, the OARDistal DEF decreases as the NP concentration increases, and the OARDistal DEF increases in correlation with DEFPTV in the nanolattice method.
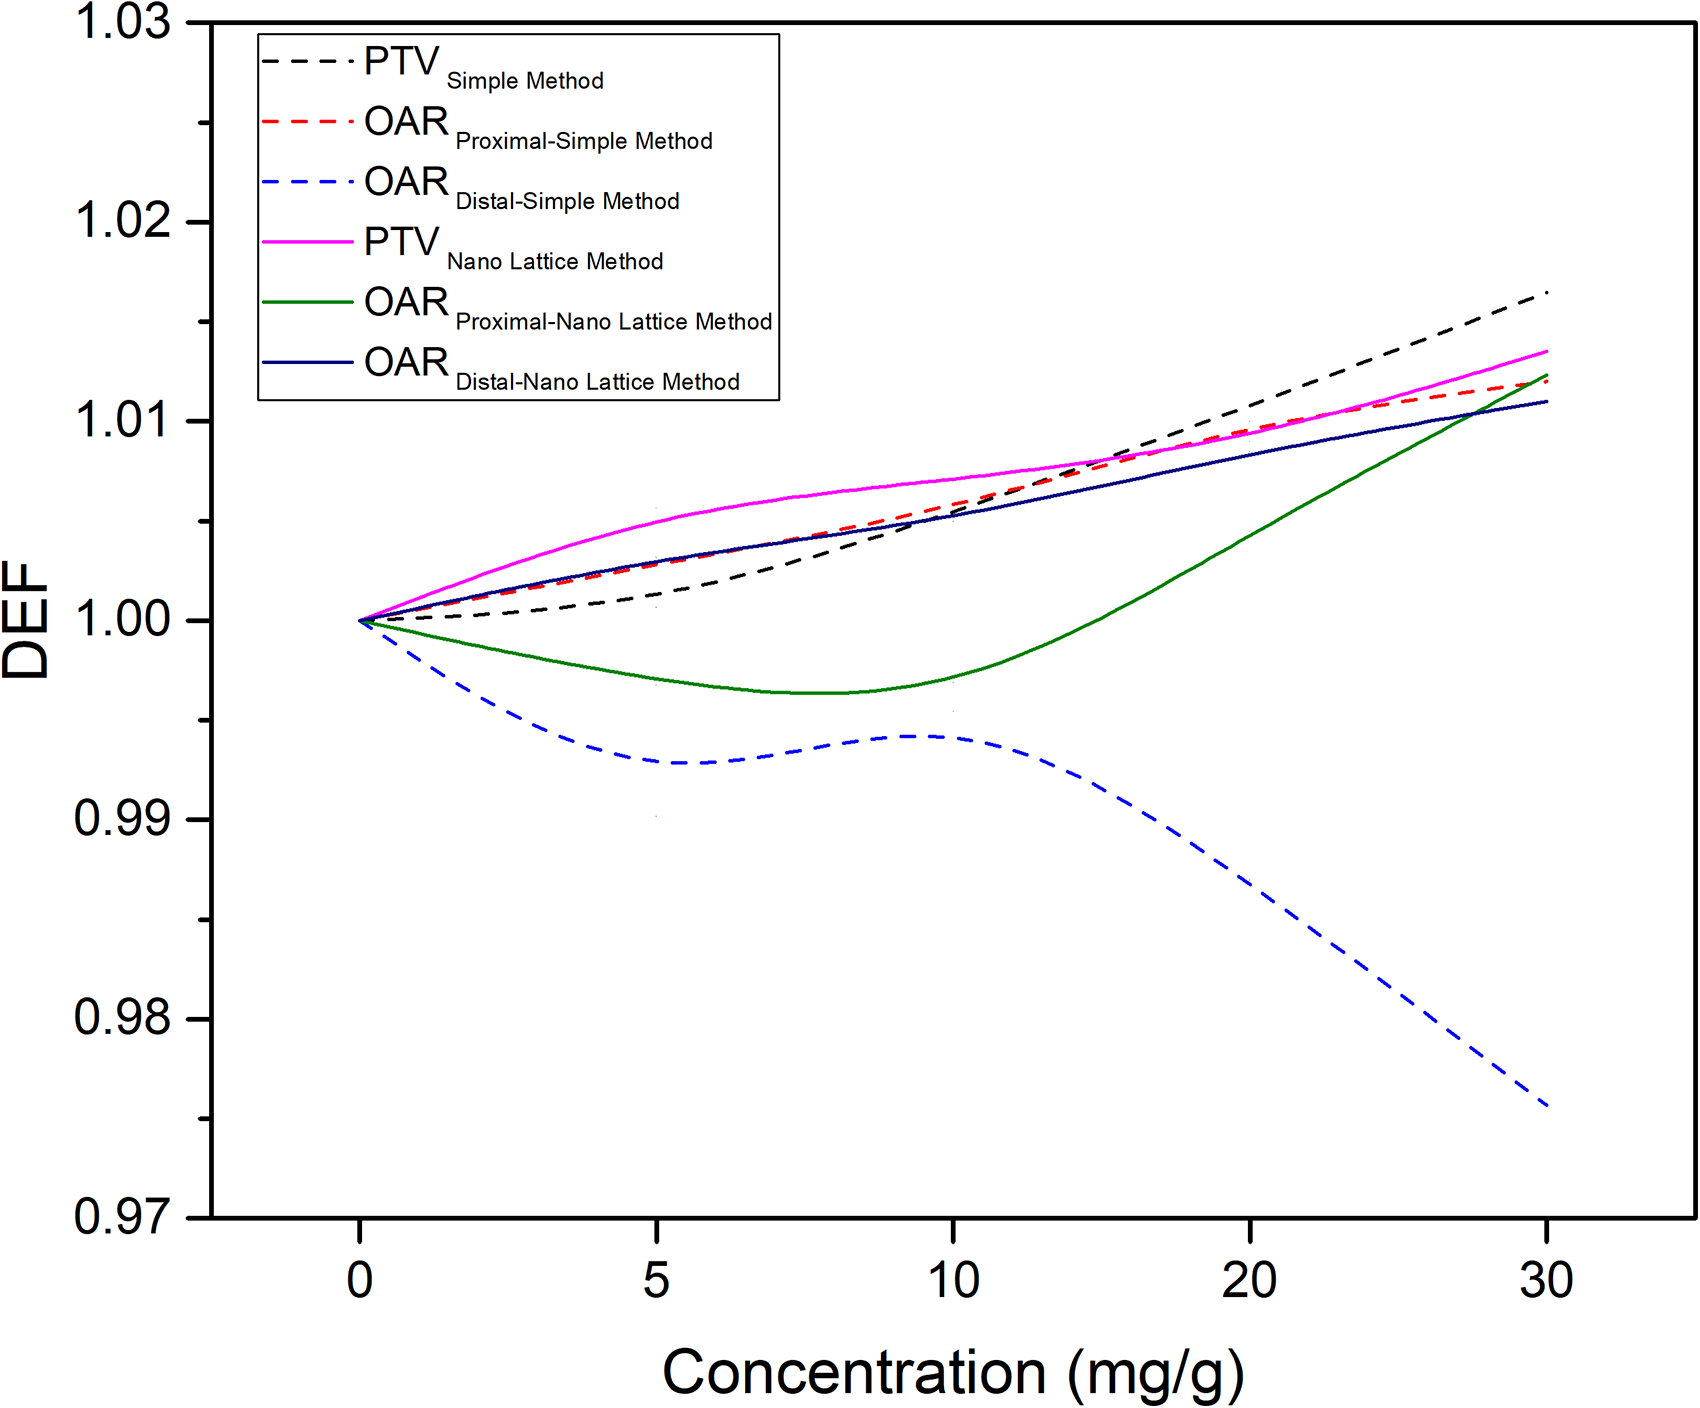
DEF factors of PTV, proximal OAR, and distal OAR based on the silver nanoparticle concentration according to the Monte Carlo simulation study performed with simple method and with nano lattice method.
Discussion
In this study, a new geometric design called the nano-lattice method, which models the NP distribution in the cell, was developed and compared with the MC calculation using a simple method. In addition, the study investigated the dose difference in the surrounding healthy tissues near the tumor by adding NPs, which has not been studied thus far. Furthermore, the study was conducted for use in clinical conditions by employing the photon characteristics of conventional linac systems.
Zhang et al reported a simple mixture model NP-added tumor for gold, and the DEF value differed by up to 16% compared with the lattice model. 29 In our study, when a 30 mg/g silver NP concentration with a 60 nm radius was used, the dose increase in PTV was 1.6% in the simple method, whereas it was 1.4% in the nanolattice method. The main reason for this difference is that the simple method approach only considers the atomic components, whereas the nanolattice method further considers the size, position, and distribution of the NPs in the medium. Gray et al studied AuNPs for MV photons and calculated the dose increase in the tumor as 2.04%. In our study, the dose increase in PTV was calculated as 1.4%. This difference can be explained by the atomic number difference between silver and gold. 30
In the simulation study employing silver NP concentrations, using both the simple method and the nanolattice method, a dose increase was observed in PTV. This increase is consistent with studies involving different particles. Similar to the study of Seniwal et al, we observed that silver NPs have a lower radiosensitization than NPs such as gold and bismuth. 31 In the study of Bahraini Toossi et al using a water phantom, the MC results showed that AuNPs caused a greater dose increase than gadolinium NPs. 32
Considering studies in the low energy range, Ghasemi Jangjoo et al showed that AuNPs cause an average of 23% DEF in brachytherapy application with a 103-Pd source for prostate cancer. 33 Roeske et al found that AuNPs lead to a 65% dose increase in low-energy radiation therapy of approximately 100 keV. 34 Yuting Lin et al studied AuNP-induced vasculature damage with proton, MV photons, and kV photons, showing that kV photons cause the largest AuNP dose enhancement in endothelial cells. For MV photon and proton therapy, the average endothelial dose enhancement was below 1%. However, the dose from AuNPs can increase the local dose in the proximity of the AuNP to the inner membrane of the blood vessel cells by more than 15 Gy even for 2 Gy fractions. 35
According to the literature, DEF in the kV region ranges from 10% to 100% due to the photoelectric effect. However, this increase in the MV level occurs between 1% and 10%.36–38 In our study, the increase in the effect of AgNPs reached 2% at a concentration of 30 mg/g. Photons at the MV level are most commonly used in radiotherapy. When photons with MV energy are used in silver, the dominant interaction type is Compton scattering. Compton scattering cross sections for MV level photons are approximately equal for silver and soft tissue. Therefore, MV photons are not expected to cause significant radiation sensitivity using AgNP. In MV radiotherapy applications, when photons penetrate the patient, they create increasing numbers of keV photons and electrons. The rate of low-energy photons (<150 keV) in air is approximately 0.5%. 35 Due to the effect of scattering, this ratio increases to 13%, and when FFF beams are used, it increases to 20%. It is possible to increase the rate of these low-energy photons by modifying the treatment beam.39–42 This phenomenon, known as “beam softening” increases the effectiveness of AgNPs.
Altering the energy of the electron beam incident on the target can also modify the low-energy component. The dose enhancement induced by the secondary electron component of a clinical 6 MV photon beam is of the same order as that induced by the photon component. The increase in dose from an NP compared to a hypothetical water NP is a factor of 10 to 100 at distances greater than 1 mm from the NP surface.39,41,43
Bismuth NPs were used for the first time in the study of C. Stewart et al. Using the oxidation of bismuth (Bi2O3), they reduced the toxic effect and proved to have a radiosensitization effect on the highly radioresistant glioblastoma cell line. They also achieved the best results at 50 to 70 nm sizes and showed that the efficiency of spherical NPs in terms of shape is higher. 38 In our study, we used 60-nm spherical NPs. Numerous studies have shown that the size of NPs is correlated with DEF. 23 Therefore, studies of varying sizes and shapes should be considered in future studies.
Theoretical and experimental studies in the literature have reported the dose-increasing effect of high Z at megavoltage and orthovoltage energies. 44 Regula et al irradiated cells grown on a gold foil in the energy range of 40 to 120 kVp and showed that the secondary electrons have a range of up to 10 mm and the DEF is above 100%. One of the first known biological reports on this subject was published 40 years ago, stating that chromosomal damage was high for iodine contrast angiography. 45 In another report, the effects of contrast medium and its relationship with dose increase were cytogenetically examined. 46 In the 1980s, the radiosensitivity of iodine-containing contrast agents was investigated by in vitro experiments. 47 In another study, iododeoxyuridine (IUdR) was delivered to the DNA of cells in vitro, resulting in an approximately threefold radiotherapeutic advantage.48,49
S. McKinnon et al examined the distribution of Ta2O5 NPs in cell culture by scanning electron microscopy and observed that the NPs dispersed around the cells to form a shell. They achieved a simulation input close to the real distribution by simulating cells as small phantoms called μ-phantoms in the MC simulation. In this study, as the NP concentration increased, DEF increased and saturated after a certain point. This can be attributed to the short range of secondary electrons formed. 50 Herold et al irradiated the tumor after injecting gold particles of 1.5 to 3.0 mm size directly into the tumor, showing a decrease in the clonogenic efficiency of the cells. This effect was limited to injection site. 51 However, the diffusion of such large particles was noted as difficult.
In our study, 6 OARs were formed surrounding the cubic PTV, and with an increase in the NP concentration in the PTV, DEFs for both PTV and OARs were investigated based on simple and nanolattice geometric models. According to the simple method, there was a linear dose increase with the NP concentration in PTV, whereas OAR doses were not affected by the concentration. However, in the simulation study performed based on the nanolattice method, the PTV dose increase was lower than that measured with the simple method (DEFPTV-Simple method = 1.016, DEFPTV-Nano Lattice method = 1.014). In particular, the dose increase in the proximal OAR was almost the same as the increase in the PTV (DEFOAR-Proximal-Nano Lattice method = 1.012), and the dose increase in the distal OAR was as much as that in the PTV (DEFOAR-Distal-Nano Lattice method = 1.011).
Studies investigating the direct and indirect effects of radiation at energies at the megavoltage level are of great importance. In particular, indirect radiation damage is essential at these levels. Further comprehensive studies should be conducted on this topic.
Conclusion
This study contributed to the literature on how NPs added to the tumor affect the dose change outside the tumor. We anticipate that this study will also impact clinical practices in the future. In the future, even at the biopsy stage, it could be possible to identify a tumor-specific agent, bind this agent with various NPs, and administer it at a level that can remain in the patient's body throughout the entire treatment. Undoubtedly, a field that can benefit significantly from progress in nanotechnology is the medical field. Advanced developments in radiotherapy can be accelerated with nanotechnology in the upcoming years. Consequently, it may be possible to create a protocol that can lead to high contrast for tracking tumors during treatment, increase the tumor dose, and make radioresistant tumors more sensitive.
Footnotes
Abbreviations
Acknowledgments
The authors thank Orhan İçelli, PhD for kindly providing MCNP6.2 simulations.
Declaration of Conflicting Interests
The authors declared no potential conflicts of interest with respect to the research, authorship, and/or publication of this article.
Funding
The authors received no financial support for the research, authorship, and/or publication of this article.