
Abstract
Background
Prostate adenocarcinoma (PRAD) is a common cancer diagnosis among men globally, yet large gaps in our knowledge persist with respect to the molecular bases of its progression and aggression. It is mostly indolent and slow-growing, but aggressive prostate cancers need to be recognized early for optimising treatment, with a view to reducing mortality.
Methods
Based on TCGA transcriptomic data pertaining to PRAD and the associated clinical metadata, we determined the sample Gleason grade, and used it to execute: (i) Gleason-grade wise linear modeling, followed by five contrasts against controls and ten contrasts between grades; and (ii) Gleason-grade wise network modeling via weighted gene correlation network analysis (WGCNA). Candidate biomarkers were obtained from the above analysis and the consensus found. The consensus biomarkers were used as the feature space to train ML models for classifying a sample as benign, indolent or aggressive.
Results
The statistical modeling yielded 77 Gleason grade-salient genes while the WGCNA algorithm yielded 1003 trait-specific key genes in grade-wise significant modules. Consensus analysis of the two approaches identified two genes in Grade-1 (SLC43A1 and PHGR1), 26 genes in Grade-4 (including LOC100128675, PPP1R3C, NECAB1, UBXN10, SERPINA5, CLU, RASL12, DGKG, FHL1, NCAM1, and CEND1), and seven genes in Grade-5 (CBX2, DPYS, FAM72B, SHCBP1, TMEM132A, TPX2, UBE2C). A RandomForest model trained and optimized on these 35 biomarkers for the ternary classification problem yielded a balanced accuracy ∼ 86% on external validation.
Conclusions
The consensus of multiple parallel computational strategies has unmasked candidate Gleason grade-specific biomarkers. PRADclass, a validated AI model featurizing these biomarkers achieved good performance, and could be trialed to predict the differentiation of prostate cancers. PRADclass is available for academic use at: https://apalania.shinyapps.io/pradclass (online) and https://github.com/apalania/pradclass (command-line interface).
Keywords
Introduction
Global cancer incidence over the past decade has increased by 33%, affecting one-sixth of the aging population. In 2020 alone, 19.3 million new cancer cases and 10.0 million cancer deaths were reported. 1 Prostate adenocarcinoma (PRAD), more commonly prostate cancer, is the most common cancer diagnosis among men, and aggressive prostate cancers pose a challenge to men's health. 2 The rise in prostate cancer cases may be attributed to changes in lifestyle, diet, and environment 3 as well as over-diagnosis. Early-stage prostate cancer is largely asymptomatic and progresses slowly, and often has an indolent course that might take more than 20 years to impact the quality of life. 4 Malignant prostate cancers might necessitate prostatectomy, with a lifetime of treatment-related disabilities.4,5 However, over-treating prostate cancers that are indolent and unlikely to develop into a life-threatening disease could cause significant avoidable side-effects to the patient. Therefore the aggressiveness of prostate cancer is a crucial factor in the course of the disease, and informs the appropriate treatment regimen. 6 The detection and surveillance of prostate cancer in early stages represents a prudent strategy for management of prostate cancers. 7
Prostate tumors are histologically and clinically heterogeneous, 8 and tissue biopsy is necessary for confirmation of diagnosis. 9 Measurement of prostate-specific antigen (PSA) levels followed by Digital Rectal Examination (DRE) are conventionally used to screen prostate cancer, however this method is prone to overdiagnosis and does not stratify cancer as slow-growing (indolent) or aggressive (high-risk). The over-reliance on PSA and DRE leads to an increase in biopsies, which carry a significant infection risk. 10 To differentiate prostate cancers and reduce the inherent difficulties in manual histopathology, automated deep learning systems have been steadily evolving to stratify prostate cancer according to the Gleason grade. 11 Such methods work with tissue microarray or whole slide images of biopsies, and have been advanced as potential clinical aid to support reproducible pathologist grading.12-19 Omics approaches could be useful in studying and characterizing the progression of prostate cancer and its conversion to an aggressive form.20,21 Expression profiling (or transcriptomics) is useful to gain an understanding of the genetic factors of prostate cancer pathology. 22 Epigenetic processes also contribute to the development of prostate cancer. DNA hypermethylation of CpG-rich gene promoter regions is widespread in prostate neoplasia. 23 Transcriptomics and mutational status-based genomics of prostate tumors might enable the development of personalized therapeutics. 24 Understanding and identifying Gleason grade-specific gene expression might be necessary for achieving precise personalized management of prostate cancers. Following these cues, we have designed a computational study protocol for mining markers that could stratify Gleason risk of prostate tumors based on TCGA expression profiles.25,26 We have used these biomarkers to develop machine learning models that screen prostate cancer and aid the differential diagnosis of indolent prostate cancers (Gleason grades I, II, and III) versus aggressive prostate cancers (Gleason grades IV and V).
Methods
Figure 1 summarizes the study design consisting of two major branches, the statistical –omics analysis and the network-based WGCNA analysis, which were merged to yield consensus biomarkers of Gleason grade-wise PRAD progression. These were used as features to develop machine learning models.

PRADclass development. Determination of consensus biomarkers between statistical modeling and WGCNA analysis of the PRAD transcriptome provides the feature space for developing machine learning models of prostate cancer differentiation.
Data Acquisition and pre-Processing
RSEM-normalised PRAD RNASeq gene expression data from the TCGA was obtained from the firebrowse portal (gdac.broadinstitute.org_PRAD.Merge_rnaseqv2__illuminahiseq_rnaseqv2__unc_edu__Level_3__RSEM_genes_normalized__data.Level_3.2016012800.0.0.tar.gz).
27
Associated clinical data was retrieved from the same portal (PRAD.Merge_Clinical. Level_1.2016012800.0.0tar.gz). Three Gleason grade-related clinical attributes were of interest:
Primary Gleason pattern encoded as patient.stage_event.gleason_grading.primary_pattern Secondary Gleason pattern encoded as patient.stage_event.gleason_grading.secondary_pattern Gleason score (sum of the primary and secondary patterns) encoded as patient.stage_event.gleason_grading.gleason_score
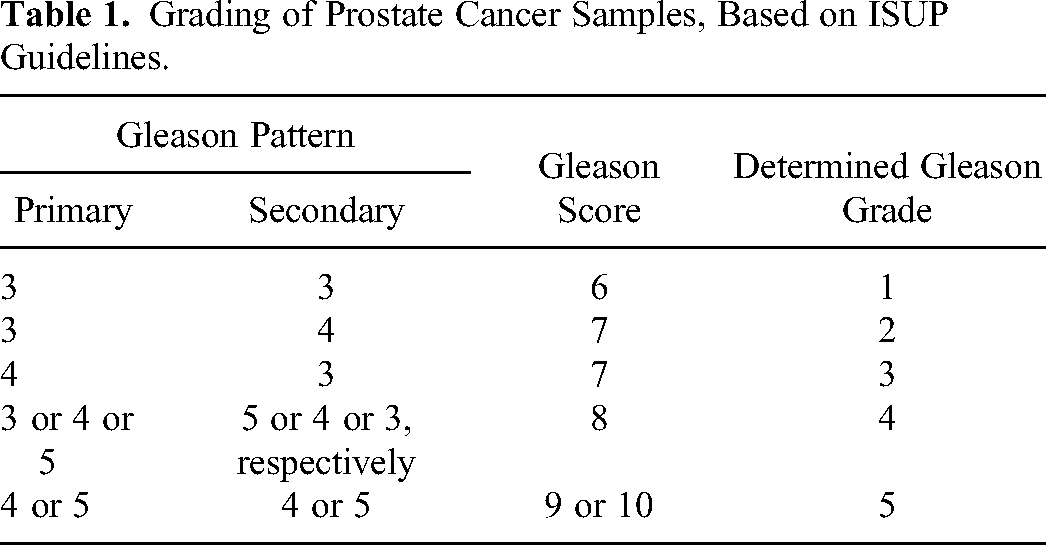
Information about the primary and secondary patterns is necessary to disambiguate a Gleason score of, say, 7, which could arise from either 3 + 4 or 4 + 3, with the latter having a worse prognosis according to ISUP guidelines.
28
Using these clinical attributes, the sample Gleason grade was annotated (Table 1). The RNA-Seq data was matched with the clinical data using the sample “patient_bcr” information. The genes with nominal variation in expression across samples (σ < 1) were removed. Samples with missing grade annotation (or “NA”) were also removed. All data pre-processing was done with R.
29
Grading of Prostate Cancer Samples, Based on ISUP Guidelines.
Linear Modeling with PRAD Grade
A grade-wise linear model of gene expression was constructed using the R limma package
30
:
Contrast Matrix with Control.

Mean expression of samples in each grade are contrasted with the mean expression in control samples, to obtain grade-specific log-fold changes and their significance.
Pairwise Contrasts Modeling
To identify grade-salient genes, we upgraded the model of gene expression given by eqn. (1):
Contrast Matrix for Executing Between-Grade Contrasts Using the

Five grades of cancer progression implied 5C2 possible pairwise contrasts, four for each grade.
Detection of Grade-Salient Genes
Grade-salient genes were flagged using a sequence of five filters:
(i) A stringent adj. p-value (< 0.001) of the contrast against controls was applied to filter the significant differentially expressed genes. Such genes were assigned to the grade showing maximum |lfc|, producing grade-specific genes. (ii) - (v) Significance of contrast with reference to other grades (adj. P-value < 0.05) was applied to the grade-specific genes, and those that pass all the four relevant contrasts (out of the ten possible pairwise contrasts) were identified as grade-salient genes.
Monotonic Expression
To ascertain an ordinal trend in mean expression across grades, we used a model with the PRAD grade as numeric variable X: control < I < II < III < IV < V; signifying monotonic upregulation control > I > II > III > IV > V; signifying monotonic downregulation
Gleason Biomarker Identification Using WGCNA
The TCGA PRAD RNAseq data was normalized using voom and checked for outliers. 34 Genes were ranked based on the median absolute deviation in expression across the samples, and the top 5000 genes were identified. The expression subset corresponding to these genes was annotated with the sample Gleason grade, and used to construct Gleason-grade specific co-expression networks using WGCNA, 35 yielding five networks. For each such network, the smallest scale-free exponent with goodness-of-fit R2 > 0.9 was identified as the β value using WGCNA's “pickSoftThreshold.” With β value fixed, we used the Pearson's ρ to calculate the similarity matrix corresponding to each network, which was then converted into the adjacency matrix, topological overlap matrix (TOM) and finally dissimilarity matrix (given by 1-TOM). Hierarchical clustering was applied to the dissimilarity matrix, and a dynamic tree cut algorithm with a cut height of 0.25 was used to partition the gene space into 20 co-expression modules.
The association between each module and the clinical trait of interest (namely, the Gleason grade) was analyzed to yield the following:
gene significance (GS), defined as the Pearson's ρ between gene expression and the trait of interest, i.e, Gleason grade (in other words, cor(genei, Trait)); module membership (MM), defined as the degree of association of a gene in a module with all the other genes in that module, ie, the degree of connectivity of the gene within the module; module significance (MS), defined as the mean of the unsigned GS of all genes in a given module; and module eigengene (ME), defined as the first principal component of the module-specific gene expression matrix.
Among all the modules for a given grade, the module with the largest MS value was designated as the Significant Module of that grade. Among all the genes of a given Significant Module, those with module membership MM > 0.7 and unsigned GS > 0.5 were identified as trait-specific key genes. The trait-specific key genes were ranked by unsigned GS.
Integrative Analysis
The intersection of the grade-salient genes from –omics analysis and the trait-specific key genes from WGCNA was designated as the Consensus Genes. KEGG 36 and Gene Ontology were used as reference databases for analyzing functional enrichment. 37 The grade-salient DEGs were visualized using heatmap dendrograms, and the dispersion of expression in cancer samples was observed using volcano plots (-log10 transformed p-value vs log fold-change). The novelty of the identified grade-salient genes was ascertained against the Cancer Gene Census v84, 38 Network of Cancer Genes, 39 and the Clinical Trial Registry (www.clinicaltrials.gov). The top ten trait-specific key genes were used to reconstruct networks using STRINGdb. 40
Machine Learning for Modeling High-Risk Aggressive Prostate Cancers
Gleason grade-specific biomarkers might make for good features in screening benign hyperplasia from cancerous samples, and differentiating between indolent and aggressive prostate cancers. To address this problem, a ternary outcome vector was encoded, labeling normal samples, indolent PRAD samples (grades 1, 2, and 3) and aggressive PRAD samples (grades 4 and 5). The consensus genes from integrative analysis were used as the feature space for training Random Forest,41,42 SVM, 43 neural networks and XGBoost models. 44 Ten-fold cross-validation (was used to optimize model hyperparameters. Post hyperparameter-optimization, the classifiers were evaluated using average performance on all the folds, and the best-performing model identified. This model was rebuilt using the full dataset, and validated on external datasets. The validated model, called PRADclass, was deployed on-line as an R Shiny app 45 and also as a command-line interface.
Results
TCGA PRAD samples had been collected from 32 tissue source sites, and processed at either the International Genomics Consortium or the Nationwide Children's Hospital Biospecimen Core Resource. All the samples had been profiled at the University of North Carolina Genome Characterization Center, using IlluminaHiSeq_RNASeqV2. The original gene expression matrix consisted of 20,531 genes×551 samples. After preprocessing we obtained a final dataset of 18,327 genes×538 samples, with 52 controls and 50, 149, 95, 70 and 123 samples in ISUP-defined I, II, III, IV and V Gleason-grades, respectively. This dataset is available in Supplementary File S1.
The dataset was log2-transformed and observation-weighted using the limma voom function. The linear model (eqn. 1) yielded 15257 significant genes (adj. P < 0.05). A more stringent significance (adj. P < 1E-05) yielded a total of 7965 significant genes. The top ten DE genes of linear modeling, ranked by adj. P-value, are all upregulated (Table 4) and the detailed results for all genes are provided in Supplementary File S2. Figure 2 presents the grade-wise distribution of expression values of the top ten DE genes of linear modeling. Principal components of the expression patterns of the top 100 genes were calculated and found to be effective in segregating cancer samples from control samples (Figure 3). On the contrary, the principal components of the expression patterns of a random subset of 100 genes failed to demonstrate such a separation. Graphical summaries of the grade-wise distribution of expression values of the top 200 linear model genes are provided in Supplementary File S3.
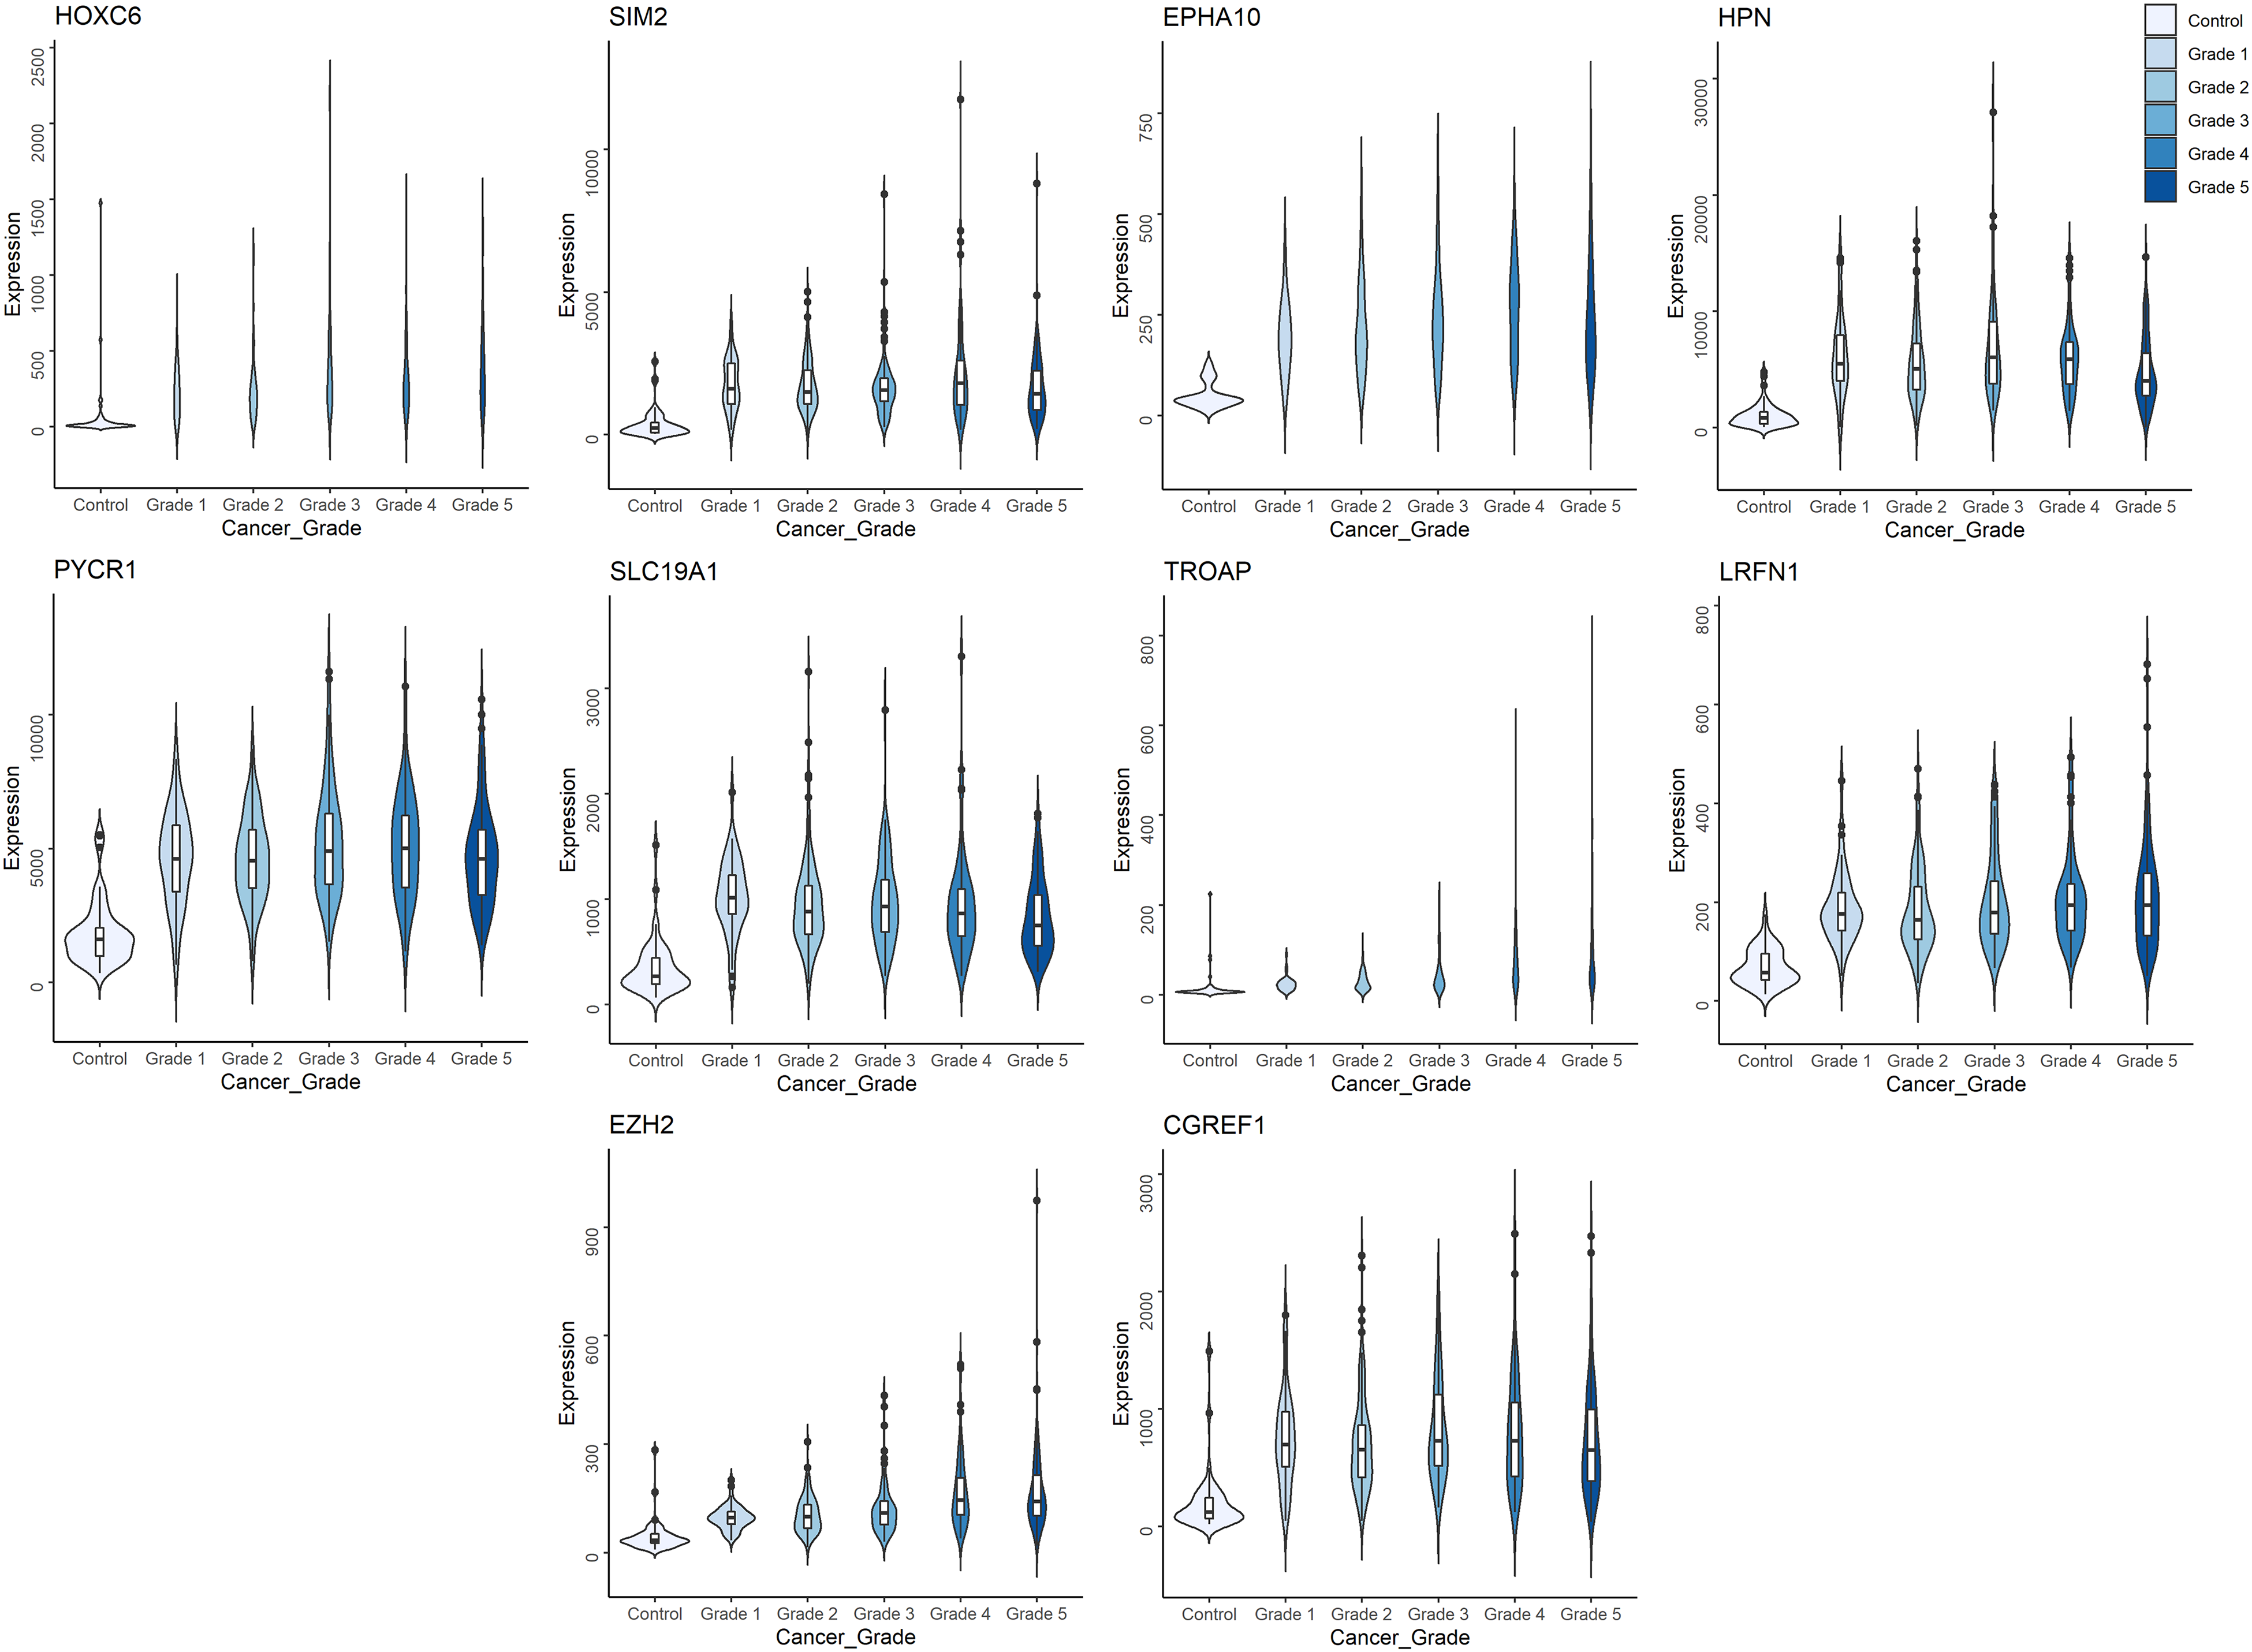
Distribution of expression values of the top ten linear model genes. The trend in gene expression could be either upregulation or downregulation in cancer relative to control, however all the top ten genes shown here are upregulated.

Principal components analysis of cancer versus control. (A) The first two principal components of 100 randomly chosen genes failed to show a distinct clustering of the control versus cancer samples. (B) The first two principal components of the top 100 genes from linear modeling demonstrated an independent clustering of the control samples (red) and cancer samples (colored by grade). It is also seen that the control samples are tightly localized in this map, whereas the cancer samples tend to diffuse and spread out, reflecting heterogeneity in individual manifestations of prostate cancer.
Top ten Genes of the Linear Model, Ranked by Significance

The lfc of mean gene expression in each grade relative to control samples is given, followed by adj. P, and inferred status of regulation in tumor.
In order to identify grade-specific genes, the significant DE genes were partitioned into different sets, shown as an Upset plot 46 in Figure 4. We then applied the filtering conditions necessary for salience, and obtained ten grade I-salient, two grade II-salient, one grade III-salient, 34 grade IV-salient and 30 grade V-salient genes. The top 10 grade-salient genes in each grade are shown in Table 5: The full set of 77 grade-salient genes is documented in Supplementary File S4. A heatmap of the grade-salient genes is shown in Figure 5, and revealed a mostly systematic trend in their expression relative to the controls, with a representation of both up- and down-regulation processes. A dendogram of the grade-annotated samples yielded a binary separation between high-grade and low-grade cancers. A dendrogram of the grade-salient genes reaffirmed this trend, showing a co-clustering among genes specific to indolent cancers (grades 1, 2, and 3) and a co-clustering among genes specific to aggressive cancers (grades 4 and 5). A volcano plot of the differentially expressed genes is shown in Figure 6.
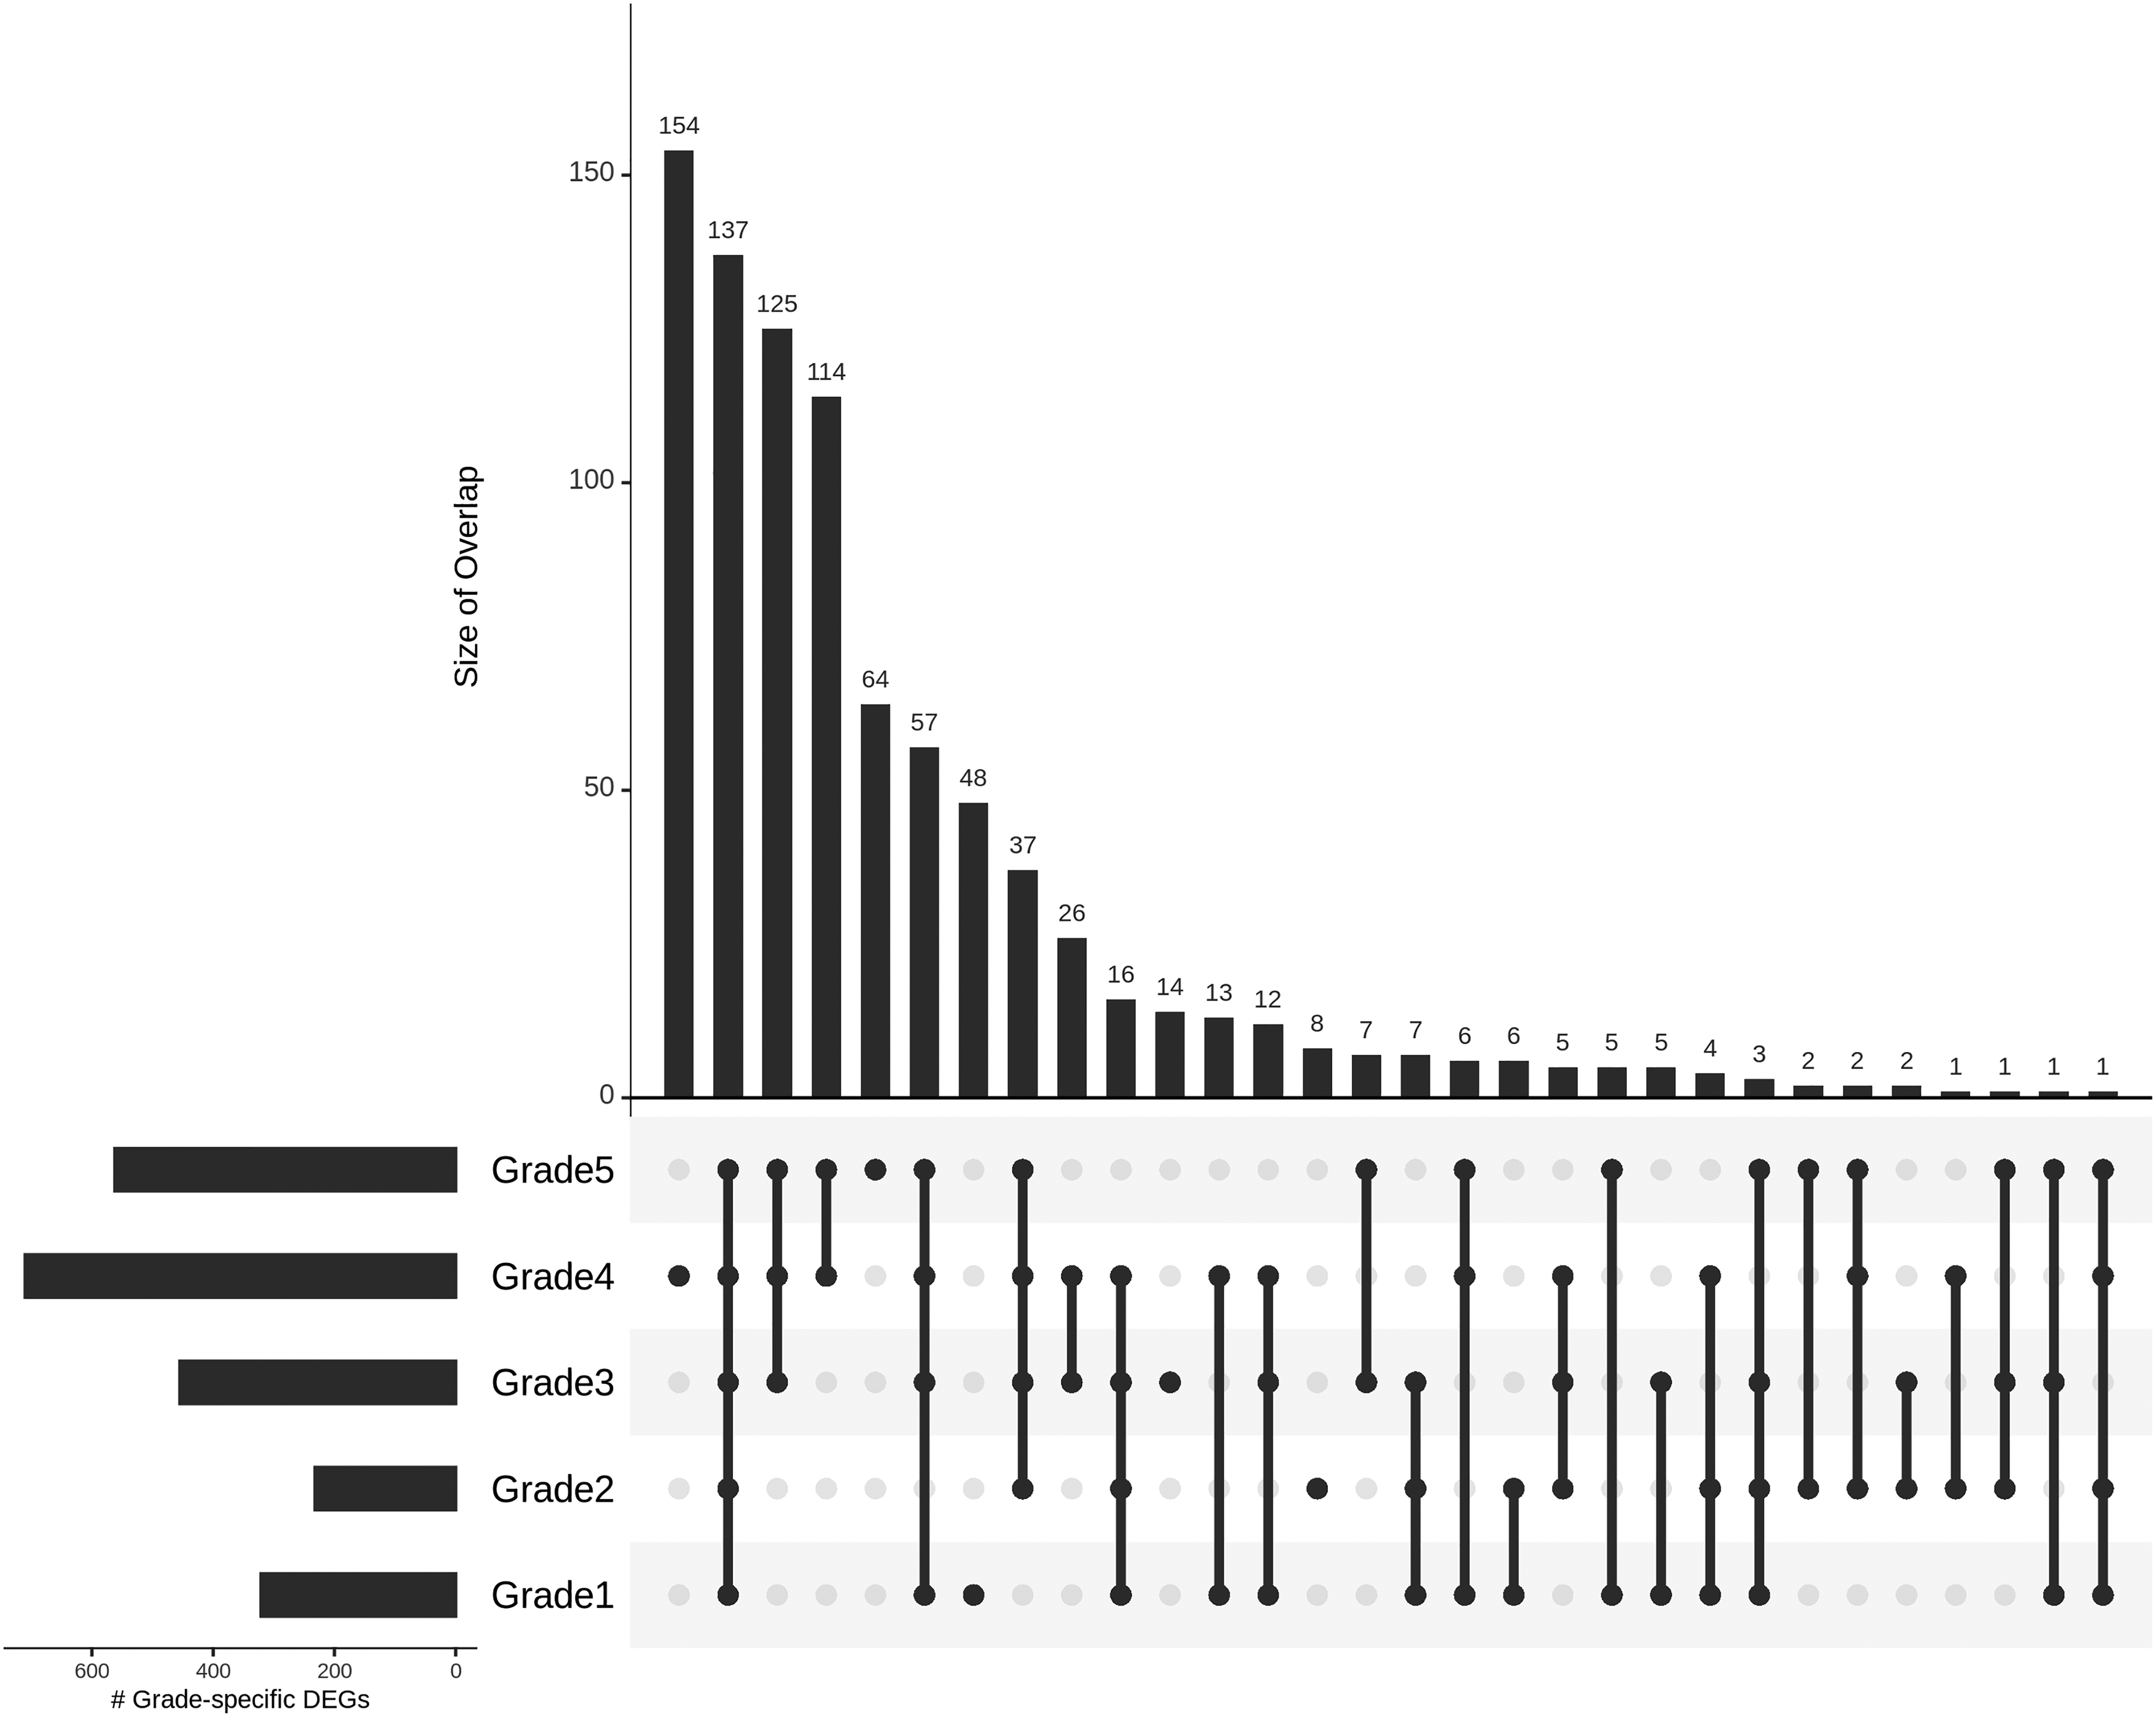
Gleason-grade distributions of the computationally identified grade-salient biomarkers, sorted by membership size. An enrichment in the advanced grades is observable.

Heatmap of the expression of grade-salient genes, with clustering in both axes. Only the top ten grade-salient genes in each grade were used to construct the heatmap (as in Table 5). The downregulation of all the ten grade-4 salient genes is evident.

Illustration of the significant DE genes using a volcano plot. The grade-salient genes are annotated.
The top Grade-Salient Genes, by Grade.

The genes are ordered by the adj. p-values of the linear model.
The top 200 genes from the numeric model (eqn. 3) are provided in Supplementary File S5. We obtained 307 monotonically expressed genes, with 112 significantly monotonic-upregulated and 126 significantly monotonic-downregulated genes. The MEGs are ranked by significance, and provided in Supplementary File S5. The intersection of significant ME genes with grade-specific genes yielded three genes: one grade-4 specific gene SERPINA5, and two grade-5 specific genes: DPYS and NKX6-1. There were eleven significant MEGs in the top 200 genes from the numeric model, namely RCBTB2, VPS36, PLCD1, HRNBP3, NUPL2, SPAG5, SCRIB, AGL, CAMK2G, WHSC1, and ZNF706.
Gene set enrichment analysis of the grade-salient genes was performed on GO and KEGG (Supplementary File S6). A search of the grade-salient genes against the CGC did not turn up any hits, suggesting that our findings could constitute novel advances in the context of prostate cancer progression. Screening the grade-salient genes against the NCG curated database of cancer drivers and healthy drivers yielded two hits, namely ANXA8L2 (grade-1 salient), and TPX2 (grade-5 salient). TPX2 is annotated as a “putative oncogene,” which agrees with the upregulation observed here. Searching the grade-salient genes in ClinicalTrials.gov, we found that eight of the grade-salient genes were used as either targets or endpoints of clinical trials (Supplementary File S7). Three among these eight (namely MUC15, UBE2C, and CD38) were targeted in prostate cancer-related clinical trials, lending weight to our findings. The top 200 genes from linear model (eqn. 1) genes were searched against the Human Protein Atlas using: “cancer related genes” or “found as prognostic markers in other cancers,” yielding the following: VAV2, BRAF, EZH2, MEN1, BUB1B, and MNX1. BRAF and EZH2 were recently shown to promote castration-resistant prostate cancers,47,48 concordant with the upregulation noticed in cancer samples here. VAV2 has been tied to poor prognosis in prostate cancer, corroborated by its oncogenic role observed here. 49 MEN1 has been noted as a tumor suppressor gene with protective effects in aggressive tumors, via increased gene expression in prostate cancer cells, thanks to inclusion in a high copy number gain region, 50 which is corroborated by the upregulation in its expression noted here. Oncogenic BUB1B was necessary for fast proliferation of tumor cells, 51 while oncogenic MNX1 has been associated with aggressive disease, 52 both results supported by the upregulation found here. The monotonic grade-salient genes in the advanced aggressive stages of PRAD, namely DPYS, NKX6-1, and SERPINA5 are documented in the prostate cancer literature. Aberrant hypermethylation of DPYS has been found to have prognostic value in stratifying early prostate cancers, 53 discordant with the overexpression observed here. NKX6-1, observed here as an oncogene with respect to prostate adenocarcinoma, has been documented with opposing functional roles depending on cancer cell-type: as tumor suppressor in colorectal cancer, gastric cancer, acute lymphoblastic leukemia, B-cell lymphoma; and as oncogene in hepatocellular carcinoma and breast cancer. 54 Loss of expression of SERPINA5 is correlated with high-grade prostate tumors and adverse prognosis 55 concordant with the significant downregulation observed in the cancer samples here. The overlap of the top 200 MEGs with the top 200 of the linear model yielded three genes (SPAG5, ZNF706, SERPINA5), and the overlap of the top 200 MEGs with the top 200 of ordinal model (eqn. 3) yielded eleven genes: SPAG5, ZNF706, RCBTB2, VPS36, PLCD1, HRNBP3, NUPL2, SCRIB, AGL, CAMK2G, and WHSC1. A discussion of the grade-salient genes and the distribution of their expression values in different Gleason grades are provided in Supplementary File S8.
Trait-Specific key Genes from Grade-Informed WGCNA
WGCNA has been used to analyze stage-specific cancer expression. 56 Here we used WGCNA for the analysis of Gleason grade-specific cancer expresion. Grade-wise preprocessed datasets were used to reconstruct Grade-specific weighted correlation networks using R WGCNA (Supplementary File S9). The β parameter was identified as 14, 9, 7, 3, and 4 for Gleason grade-I, grade-II, grade-III, grade-IV, and grade-V networks, respectively. This identification of the optimal scale-free network is illustrated for grade-I in Figure 7. Modular decomposition was effected by the dynamic tree cut algorithm, and the outlier genes in each grade were binned into a gray module. The GS and MM of each gene was calculated, and presented grade-wise in Supplementary File S10. Figure 8 shows the module-trait correlation of all modules in each grade as a heatmap, for which the source data is given in Supplementary File S11.

Finding the soft-thresholding power in WGCNA analysis, illustrated for grade-I network. (A) Scale-free fit of degree distribution (ie, p(k) ∼ k−γ) for various soft-thresholding powers to identify the optimal β. (B) Change in mean connectivity with β.

Heatmap of grade-wise module-trait relationships, depicting correlation (with P-value) between module eigengene (me) and grade for each module in the given grade. (A) Grade-I, (B) Grade-II, (C) Grade-III, (D) Grade-IV, and (E) Grade-V. The Significant Module in each grade is highlighted. Strength of correlation is indicated with a color gradient.
Based on the per-module GS values, the Significant Module of each grade was identified. A scatter of MM versus GS for all genes in each Significant Module (Figure 9) showed a strong Pearson's correlation across all the Significant Modules. The trait-specific key genes in each Significant Module were determined, yielding 67 genes in Grade-I, 46 genes in Grade-II, 204 genes in Grade-III, 603 genes in Grade-IV, and 83 genes in Grade-V (presented in Supplementary File S12 and summarized in Table 6).

Grade-wise module significance, along with the scatter of genewise correlation between MM and GS in the grade's significant module. (A) Grade-I; (B) Grade-II; (C) Grade-III; (D) Grade-IV; and (E) Grade-V.
Summary of Gleason Grade-Wise WGCNA Analysis of PRAD Transcriptome.

The top ten trait-specific key genes in the significant module in each grade were used to reconstruct driver networks using STRINGdb. The trait-specific key genes of Grade-1 WGCNA network were enriched in the catabolic processes of fatty acids and lipids (P < 1E-04). The trait-specific key genes of Grade-2 WGCNA network showed a KEGG enrichment of PPAR signaling pathway (P < 1E-2), altering androgen activity thereby driving PRAD progression. 57 The trait-specific key genes of Grade-3 WGCNA network revealed a Reactome enrichment 58 for neddylation pathway (P < 1E-04), which increases androgen receptor transcription and promotes the growth and invasion of the prostate cancer cells. 59 The trait-specific key genes of Grade-4 WGCNA network showed an enrichment in post-translational SUMOylation modifications in the pTEN/AKT and androgen-receptor signaling pathways (P < 2E-3). 60 An analysis with Reactome revealed enrichment in PPARA gene expression (P < 0.05), known to drive advanced prostate cancer. 61 The top ten trait-specific key genes of Grade-5 WGCNA network were enriched in pTEN transcription regulation (P < 1E-04), whose loss of function is well-known to be associated with aggressive and metastatic prostate cancer. 62 An analysis with Reactome showed significance for HCMV early events (P < 1E-3), known to be involved in the etiology of metastatic prostate carcinoma. 63 The grade-wise detailed results are presented in Supplementary File S13.
We now turn our attention to a discussion of the grade-saliend genes identified from statistical modeling.
Grade-I salient DEGs. PHGR1 (proline-, histidine-, and glycine-rich 1) encoding a protein of unknown function was found to be regulated by siRNA markers of castration-resistant prostate cancer-like cell. 64 MUC15 and PTPRZ1 genes have been documented as downregulated in PCa; specifically, MUC15 expression was negatively correlated with the Gleason score.65,66 The aberrant overexpression of ANXA8L2, SLC43A1 (also called as LAT3), RNF157, and PCOTH is known to be involved in macrophage M2 polarization, TAF-Iβ pathway, remodeling of extracellular matrix and other pathways in prostate cancer.67-70 The overexpression of LAT3 was also associated with poor prognosis in prostate cancer. 71 Our findings revealed that these four genes are upregulated, agreeing with literature. Overexpression of SERPINB5 was associated with better prognosis in PC patients, 72 signifying a healthy protective effect and agreeing with our findings that its downregulation is necessary for Gleason-grade progression of prostate tumors. OR52R1, an olfactory receptor, played a role in prostate cancer progression through activation of the PI3K pathway, 73 correctly identified as upregulated here.
Grade-II salient DEGs. PPM1E is essential for chromosome segregation during mitosis, and identified as an oncogene here. The association of PPM1E with PAK1 promotes cell division, tumor growth, and microinvasion.74,75 Prostate cancer-specific differential expression of PPYR1, a neuropeptide, has been noted previously, 76 agreeing with the overexpression observed here.
Grade-III salient DEGs. Overexpression of PLA2G2A, Phospholipase A2 Group IIA has been identified as a prognostic biomarker of androgen-independent prostate cancer. 77 On the contrary, it was also found to be differentially downregulated in metastatic prostate cancers. 78 Our findings supported the latter study.
Grade-IV salient DEGs. UBXN10 plays a key role in ciliogenesis, whose dysregulation of which initiates tumorigenesis.79,80 Recently, UBXN10 has been identified in an eight gene signature for predicting progression-free survival, exerting a protective effect in prostate cancer, 81 which accords with the tumor suppressor activity noted here. There is ample literature evidence supporting the downregulation of ANGPTL1, RNF175, and ASB2 in prostate cancer that is found here.82-86 Liu et al have identified KIAA1644 as a protective prognostic gene in endometrial cancer, 87 reinforced by the downregulation obtained from the analysis of the PRAD TCGA data here. Upregulation of PCYT1B has been documented in endometrial cancer, 88 suggesting an analogous oncogenic role in PCa as found in our investigations. DGKG has been identified as a tumor suppressor in colorectal cancer, 89 and its downregulation observed in our studies might point to its similar significant role in prostate cancer.
Grade-V salient DEGs. It has been recently reported that TBX2 and CBX2 were upregulated in advanced PCa, helping sustain an androgen deprivation condition through neuro-endocrine differentiation, and thereby promoting migration of PCa cells and facilitating invasion.90-93 CTHRC1 and SHCBP1 have been documented to be significantly upregulated in PCa tissues, and moreover the latter was associated with poor survival outcomes.89,94 Certain grade-5 salient genes like ASPN, CTHRC1, CD38 were found to be associated with metastatic PCa, with higher expression in the stroma or the tumor microenvironment, highlighting prognostic potential.95-97 The evidence from the present work corroborated all the above studies. UBE2C was also found to be an independent prognostic factor in prostate cancer, exhibiting increasing expression with Gleason grade, justifying its identification as Grade-V salient. 98
Discussion
We have executed parallel workflows for the statistical and network-based modeling of the TCGA PRAD transcriptome, stratified by Gleason grade. The concurrence of the results from the two workflows might represent reliable findings. The following were observed:
All the grade-salient genes were located either in the significant modules or with a module highly correlated with the grade; Grade-salient genes displaying significant upregulation with Gleason progression yielded a significant positive GS in the WGCNA analysis, except MAL; Grade-salient genes displaying significant downregulation with Gleason progression yielded a significant negative GS in the WGCNA analysis, except four: COL10A1, NOX4, FAP, and SFRP4. Regulation status of trait-specific key genes suggested by the sign of the GS was concordant with the inference from the statistical expression patterns with respect to controls, with one exception: LOC100128675. All the grade-salient genes reflected a strong and significant association with the WGCNA modules in the respective grades (MM > 0.4, P < 0.05).
The grade-wise intersection between the salient genes from the statistical modeling and the trait-specific key genes from network modeling produced two genes from Grade-1 (SLC43A1, PHGR1), 26 genes from Grade-4 (including C2orf88, ANGPT1, CAV2, TMLHE, IGSF1, PPARGC1A, LGR6, PPP1R3C, FRMD6, NECAB1; Supplementary File S14) and seven genes from Grade-5 (CBX2, FAM72B, SHCBP1, TMEM132A, TPX2, DPYS and UBE2C). The regulation status for these 35 consensus genes was concordant, underscoring their potential utility. A summary of the consensus genes is presented in Table 7. The detailed results of the consensus analysis are included in Supplementary File S14. A gene-wise analysis of the trait-specific top ten key genes in each module is presented in Supplementary File S15. The main inference remained unchanged: the bulk of the trait-specific key genes were also grade-salient, with sync in inferred regulation. It is striking that most of the consensus emerged from the aggressive forms of prostate cancer (ie Gleason grades 4 and 5). We used the 33 consensus genes from the aggressive grades to reconstruct a STRINGdb network, with 50 interactors in the first shell and 10 interactors in the second shell. This yielded a significantly enriched PPI with 542 edges (P < 1.0E-16; Figure 10). An analysis with KEGG revealed significant enrichment in oncogenic pathways like NF-kappa B signaling pathway (P < 1E-3), and p53 signaling pathway (P ∼ 0.02). An analysis with Reactome showed significant enrichment in cell cycle processes. The detailed results of these analyses are presented in Supplementary File S16. The consistency in the results between the –omics analysis and WGCNA is complete, which amplifies the significance of the findings and sets the stage for modeling the character of patient samples (benign, indolent or aggressive).

Network reconstructed using the 33 consensus biomarkers of the aggressive grades of prostate cancer. A giant component with a clique-like core could be seen. It is remarkable that 25 of the consensus biomarkers were isolated outliers, signifying their roles underpinning varied biological processes not immediately related to each other.
Grade-Wise Consensus Biomarkers from the Intersection Consensus Analysis of Grade-Salient Genes and Trait-Specific key Genes.

All genes have maximum membership values for the significant module in each Grade. The inferred regulation is based on the sign of the GS, which denotes the correlation between gene expression and trait class (Gleason grade) of interest. Only the top ten genes from Grade-4 (ranked by GS) are shown. Consensus with regulation inferred from the statistical modeling is also ascertained.
The expression subset of the 35 consensus genes in the available 538 samples comprised the dataset for developing ML models for screening PRAD and predicting its aggressiveness. The mapping between this feature space and the sample annotation (benign, indolent or aggressive) was modeled using various classifiers (Table 8). Hyperparameters were optimized using 10-fold cross-validation. Different kernels were explored for the SVM classifier (viz. linear, radial and polynomial), and the results for the kernel with the best performance are shown. The RandomForest model with optimal hyperparameters showed a balanced accuracy ∼ 100.00% among the three outcome classes during cross-validation. SVM with radial kernel and XGBoost were also effective models, with >90% cross-validated balanced accuracy. A feature importance analysis of the RandomForest model using R caret 99 identified the top ten features based on mean decrease in Gini score 100 as: SLC43A1, FAM72B, CBX2, UBE2C, SHCBP1, TMEM132A, LOC100128675, TPX2, PHGR1, and DPYS (Figure 11). The consensus grade-I salient genes (SLC43A1 and PHGR1) were key features in the RandomForest solution, as were all the seven consensus grade-V salient genes (FAM72B, CBX2, UBE2C, SHCBP1, TMEM132A, TPX2, and DPYS), validating the significant contribution of differential Gleason grade-specific biomarkers to the aggressive character of PRAD cancers. LOC100128675, known as HPN-AS1, is the only grade-IV salient gene, coding for an androgen responsive lncRNA with prognostic value in hormone-related cancers, particularly prostate cancer. 101

Importance ranking of the features used in building PRADclass. The top ten features are shown, collectively representing the greatest contribution to PRADclass. The scores are normalized with the importance of SLC43A1, a Gleason grade-I consensus biomarker. Other features represented here include consensus Gleason grade-V biomarkers (FAM72B, CBX2, UBE2C, SHCBP1, TMEM132A), and one consensus Gleason grade-IV biomarker (LOC100128675).
Hyperparameters and Performance Measures of Different Models Investigated for the Ternary Classification Problem of Sample as Normal (Possibly Benign Hyperplasia), Indolent Prostate Cancer or Aggressive Prostate Cancer, Based on Expression Levels of Consensus Genes.

Performance was measured using 10-fold cross-validation balanced accuracy for the ternary classification problem.
We searched cBioPortal with the keyword “prostate,” and retrieved the DKFZ Prostate Cancer study 102 with 100 indolent and 18 aggressive samples (https://www.cbioportal.org/study/summary?id=prostate_dkfz_2018). The dataset was missing expression measurements for two out of the 35 features, namely LOC100128675 and EMX2OS, which were imputed with missRanger 103 using the other predictor variables. Post-imputation, the model was evaluated on this external dataset (Table 9), yielding the following performance: (i) balanced accuracy: 0.814, (ii) AUROC: 0.83, and (iii) weighted F1-score: 0.81. We used another dataset to evaluate the model performance on normal samples, namely Suntsova et al, 104 which provided expression profiles of three prostate tissue samples from healthy donors (GSE120795). All the three samples were correctly predicted as normal, providing evidence for discrimination of normal samples and model generalization on out-of-domain data.
Composite Confusion Matrix for the Model Performance on External Datasets. the Model was Evaluated on PRAD-DKFZ and GSE120795, Yielding a Balanced Accuracy of ∼ 0.86.

Encouraged by these results, we sought to further validate the consensus biomarkers. We performed a contrast analysis of gene expression in aggressive versus indolent PRAD samples in the TCGA dataset. Applying an unsigned lfc threshold ∼1.0 and adj. p value <0.05, we obtained 166 DEGs. This included six consensus biomarkers: DPYS, TPX2, UBE2C, FAM72B, CBX2, and PHGR1; as well as twelve more grade-salient genes. A similar contrast analysis was executed on the PRAD-DKFZ dataset, yielding 2010 DEGs with 13 consensus biomarkers: SLC43A1, PHGR1, CBX2, UBE2C, SHCBP1, TPX2, FAM72B, DPYS, TMEM132A, UBXN10, CAPN6, PCYT1B, and KIAA1644; as well as 19 more grade-salient genes. These results are given in Supplementary File S17. We also explored the novelty of our findings against published biomarker panels for prostate cancer management. Decipher is a 19-gene signature for treatment monitoring of prostate cancers, 105 and shared one consensus biomarker: UBE2C. Oncotype DX GPS 17-gene panel is used for monitoring prostate tumor aggressiveness 106 and shared two consensus biomarkers: SFRP4 and TPX2. Prolaris has published a 46-gene panel for monitoring prostate tumor aggressiveness, 107 and shared one consensus biomarker: PGC. Further panels explored included ProMark (used for typing tumor aggressiveness 108 ) and ConfirmMDx (used for predicting true negative prostate biopsies based on methylation patterns 109 ), but no consensus biomarkers were shared in these panels.
The better-performing models, viz. RandomForest, SVM (radial kernel) and XGBoost, were re-built using the full dataset. A command-line interface including the RDS binaries of these models has been provided for academic and not-for-profit use at: https://github.com/apalania//PRADclass. The hyperparameter-optimized best-performing RandomForest model, PRADclass, has been deployed as a web-server (https://apalania.shinyapps.io/pradclass/). Features from expression profiling have been earlier used to build predictive models of cancers, for eg breast cancer. 110 PRADclass may assist in risk stratification of prostate cancers, especially in settings where availability of Gleason grading expertise is constrained. Such software as medical device solutions could act as handy alternative decision support tools, 111 but further clinical validation of PRADclass is necessary. The robustness of the biomarker panel to the heterogeneity of prostate cancers needs to be ascertained, ensuring that the biomarker assay correctly stratifies patient samples presenting aggressive tumor foci, including those not encountered during model training. Prospective cohort studies could validate and improve PRADclass for future use in real-time point-of-care settings. We note that the identified grade-wise consensus biomarkers could further suggest potential targets for therapeutic interventions. Future research may address the fine discrimination among Gleason grades to enable a more refined three-way prostate cancer prognosis (low, intermediate or high-risk).
Conclusions
Gleason grading is the gold standard for risk stratification of prostate cancer patients, and molecular biomarkers specific to different Gleason grades could enable the stratification of high-risk prostate cancers that require active management versus low-risk prostate cancers. In this study, we have applied parallel computational pipelines, based on statistical modeling and network analysis of TCGA expression data, and identified grade-wise consensus biomarkers. Statistical modeling yielded ten grade-I salient genes (PHGR1, OR52R1, PCOTH, SLC43A1, ANXA8L2, RNF157, MUC15, SLC46A2, PTPRZ1, and SERPINB5), two grade-II salient genes (PPM1E and PPYR1), one grade-III salient gene including (PLA2G2A), 34 grade-IV salient genes (including UBXN10, ATCAY, ANGPTL1, DGKG, NECAB1, ASB2, KIAA1644, LOC2824276, PCYT1B, RNF175), and 30 grade-V salient genes (including CBX2, FAM72B, SLC7A4, ASPN, UBE2C, SHCBP1, TPX2, IL1F5, CTHRC1, CD38). WGCNA modeling yielded 1003 genes. The consensus analysis yielded 35 biomarkers, viz. two genes in Grade 1 (SLC43A1, PHGR1), 26 genes in Grade 4 (LOC100128675, PPP1R3C, NECAB1, UBXN10, SERPINA5, CLU, RASL12, DGKG, FHL1, NCAM1), and seven genes in Grade 5 (CBX2, DPYS, FAM72B, SHCBP1, TMEM132A, TPX2, UBE2C). To explore the histoprognostic value of these molecular markers, we constructed various machine learning models using these candidate biomarkers as feature spaces. PRADclass, a RandomForest model, obtained near-perfect ten-fold cross-validation performance on the ternary problem of classifying a patient sample as benign, indolent prostate cancer or aggressive differentiation. Validation of PRADclass on external out-of-domain datasets yielded >85% balanced accuracy. Further work is essential to assess the clinical utility of PRADclass as a decision support aid especially for prostate cancer stratification. PRADclass is experimentally available for academic and non-commercial use at https://apalania.shinyapps.io/pradclass. The candidate biomarkers might represent novel chemotherapy target hypotheses, ripe for experimental validation.
Footnotes
Acknowledgements
We would like to thank Amrutha Karthikeyan and Shivathmika Ramanathan for assistance with the WGCNA analysis. We are grateful to the School of Chemical and Biotechnology, SASTRA Deemed University, for infrastructure and computing support.
Abbreviations
Declaration of Conflicting Interests
The authors declared no potential conflicts of interest with respect to the research, authorship, and/or publication of this article.
Funding
The authors received no financial support for the research, authorship, and/or publication of this article.
Ethical Statement
Our study did not require an ethical board approval because it did not contain human or animal trials. Our study uses public-domain de-identified TCGA datasets for analysis, and other public-domain de-identified datasets for validation.
Availability of data and materials
Public-domain datasets were used in this study. Data generated during the study are included as supplementary information to the published article as well as deposited in an online repository at: https://doi.org/10.6084/m9.figshare.22549621.v2.