
Abstract
Objectives
The respiratory variations will lead to inconsistency between the actual delivery dose and the planning dose. How the minor interfractional amplitude changes affect the geometry and dose delivery accuracy remains to be investigated in the context of lung adaptive radiotherapy.
Methods
Planning 4-dimensional-computed tomography and kV-cone beam computed tomography were scanned based on the Computerized Imaging Reference Systems phantom, which was employed to simulate the minor interfractional amplitude variations. The corresponding synthetic computed tomography for a particular motion pattern can be generated from Velocity program. Then a clinically meaningful synthetic computed tomography was analyzed through the geometrical and dosimetric assessment.
Results
The image quality of synthetic computed tomography was improved obviously compared with cone beam computed tomography. Mean absolute error was minimized when no significant interfractional motion occurs and Velocity can be qualified for dealing with the regular breathing motion patterns. The mean percent hounsfield unit difference of the synthetic hounsfield unit values per organ relative to the planning 4-dimensional-computed tomography image was 22.3%. Under the same conditions, the mean percent hounsfield unit difference of the cone beam computed tomography hounsfield unit values per organ, relative to the planning 4-dimensional-computed tomography image was 83.9%. Overall, the accuracy of hounsfield unit in synthetic computed tomography was improved obviously and the variability of the synthetic image correlates with the planning 4-dimensional-computed tomography image variability. Meanwhile, the dose-volume histograms between planning 4-dimensional-computed tomography and synthetic computed tomography almost coincided each other, which indicates that Velocity program can qualify lung adaptive radiotherapy well when there were no interfractional respiratory variations. However, for cases with obvious interfractional amplitude change, the volume covered at least by 100% of the prescription dose was only 59.6% for that synthetic image.
Conclusion
The synthetic computed tomography images generated from Velocity were close to the real images in anatomy and dosimetry, which can make clinical lung adaptive radiotherapy possible based on the actual patient anatomy during treatment.
Introduction
Radiotherapy is a method used to treat cancer by precisely localizing the tumor using information about its shape and density obtained from computed tomography (CT) scans. 1 However, the accuracy of delivering the radiation dose is often hindered by variations in patients’ breathing pattern during lung cancer radiotherapy.2–6 These irregularities in respiration can have a significant impact on the effectiveness of treatment outcomes and may lead to side effects, especially in the context of lung stereotactic body radiation therapy (SBRT). 7 Irregular breathing patterns are common and complex in clinical practice, and they can even differ for the same patient. 8 While coaching may help maintain consistent breathing pattern throughout the course of radiotherapy, it cannot completely eliminate irregular target motion during the imaging and treatment. 3 Respiratory variations can be categorized into contain intrafractional and interfractional components, each affecting the radiotherapy of mobile lung tumors in different ways. One of the major factors contributing to uncertainties during treatment is interfractional anatomical changes caused by irregular target motion. 9 Studies have shown that interfractional variations can be up to 10 times larger than the intrafractional variations in the movement of chest wall for lung cancer patients. 10 Changes in the anatomical structure during interfractional radiotherapy can result in variations of the lung's mean central distance ranging from 0.59 to 2.94 cm. 11 Additionally, Momin et al found that the motion of lung tumors due to respiration can vary from 0.5 cm to 2.5 cm. 12 These respiratory variations ultimately lead to discrepancies between the actual delivery dose and the planning dose. 13
Generally, lung radiotherapy planning involves using CT scans in shallow breathing or 4-dimensional computed tomography (4D-CT) in free breathing.14–16 4-dimensional-computed tomography scan, which is based on the synchronization between the acquisition parameters and corresponding respiratory cycle, can be used to assess the movement of the tumor caused by breathing and aid with the realization of the motion-management strategy during treatment. 17 While it is assumed that the tumor motion captured by 4D-CT scans during the simulation stage represents the motion throughout the entire treatment, changes in respiratory patterns have been observed in lung patients undergoing conventionally fractionated radiotherapy.18–20 This is important because 4D-CT scans are sensitive to variations in respiratory patterns and lung patients may experience changes in breathing motion between treatment sessions due to coughing or discomfort. The impact of irregular breathing patterns on the accuracy of geometry and dose delivery has not been extensively evaluated in most studies, particularly for lung adaptive radiotherapy (ART) with minor variations in breathing amplitude between treatment sessions. 3
Although it is possible to use a repeated 4D-CT (rCT) scans to assess the dose discrepancy between the planned and delivered dose when there are changes in the interfractional amplitude, this approach requires more resources, time, and increases the imaging dose to patients. Nowadays the inevitable interfractional variation highlights the need for lung ART21–24 and the accurate dose calculation capability of synthetic CT (sCT) based on the actual patient anatomy during treatment makes ART possible.25–27 Since a single pretreatment plan is insufficient to reflect the real dose distribution on the tumor and its surroundings throughout the treatment, systematic feedback of images during daily treatment is required to monitor treatment variation. Cone beam computed tomography (CBCT) often produces poor image quality due to scattered, cupping, and streaking artifacts, thus limiting its application.28–31 Therefore, improving the quality of CBCT images is necessary before implementing ART to enhance the accuracy of radiotherapy planning and subconsequent treatment. 32 In the past 30 years, various strategies have been implemented to correct relative electron density values from CBCT Hounsfield unit (HU) values, including analytical method, 33 Monte Carlo-based method, 34 histogram matching method, 35 artificial intelligence method, 36 and image registration method. 37 Studies have shown that using the sCT can yield similar conclusion for lung cancer plan adaptation compared to repeat fan-beam CT scans. 38 The differences in dose between sCT and planning CT have been evaluated in the chest areas, with varying levels of mean error (ME) and mean absolute error (MAE) reported. 39 Additionally, sCT generated from CBCT for lung cancer ART has been compared to rescanned CT, demonstrating certain levels of ME and MAE at −6 ± 13 HU and 66 ± 18 HU, respectively. 40
In this work, the Velocity program was used to generate a corresponding sCT in order to evaluate the effect of minor interfractional amplitude changes on the geometry and dose of the target in the context of lung ART. The Adapt Volume option in the Velocity program allows for deformations of CBCT images and the inclusion of correct HU values to generate sCT.41,42 The accuracy and feasibility of using the sCT for offline ART with interfractional variations was preliminarily analyzed, which carries high significant clinical importance.
Materials and Methods
Planning 4D-CT (pCT) and 3 different breathing pattern kV-CBCTs were scanned on a CIRS (Computerized Imaging Reference Systems, Model 008A) phantom and a corresponding rCT was also scanned in advance. The 4D-CT was performed on a GE LightSpeed RT Scanner (GE Healthcare) with a resolution 0.977 × 0.977 × 2.5 mm using 120 kVp and 300 mA. The TrueBeam imaging system (v2.7, XI imaging system, GS-1542 x-ray tube) consists of a kV x-ray source and a kV amorphous silicon detector with a sensitive area of 30 × 40 cm2. A standard thorax CBCT protocol, with settings of 125 kVp, half-fan collimation, and 360° rotation, was applied to acquire CBCT images. These CBCT images had a resolution of 0.908 × 0.908 × 2.0 mm (512 × 512 × 88 pixels). Once the above images (pCT and CBCT) are acquired, sCT image corresponding to a special motion pattern can be generated based on Velocity (Varian Medical Systems, Inc.). Stereotactic body radiation therapy treatment plans were created using the Eclipse treatment planning system (TPS) (Version 15.6, Varian Medical Systems) and then they were copied to the sCT images derived from ground truth CT images (pCT or rCT) once the optimized plans met the clinical requirements. The dynamic thorax phantom, respiratory simulation method, treatment plans, sCT image generation, and geometrical and dosimetric analysis are described in more detail below.
Phantom and Simulation of Respiratory
In order to reproduce different respiratory motion patterns, a complex and anthropomorphic 4D motion phantom was used to simulate the minor interfractional respiratory variations during treatment stage. It is designed for comprehensive analysis of image acquisition, planning, and dose delivery in image-guided radiation therapy.43,44 This phantom is made of tissue-equivalent material and can provide known and repeatable transverse and rotational movement of an internal target. A 3-cm diameter and soft tissue-equivalent spherical insert was placed inside the phantom to simulate a tumor. The phantom and section view are shown in Figure 1, and the breathing cycle, movement speed, and movement direction can be set by programming in a specified range. Studies have shown that the superior–inferior direction (SI) motion range for lung patients in a free-breathing state is 1 to 31.9 mm. 45 Therefore, a peak-to-peak amplitude of 15 mm in the SI direction was chosen based on sinusoidal curves, and the respiratory cycle was set as 4 s, which remained constant in both stages in this work.46–48 Considering the interfractional amplitude changes, the amplitude variation range of the phantom on the treatment couch was set from 5 mm to 15 mm. For simplicity, 10 mm and 5 mm were chosen as the 2 peak-to-peak amplitudes for comparisons in the treatment stage.
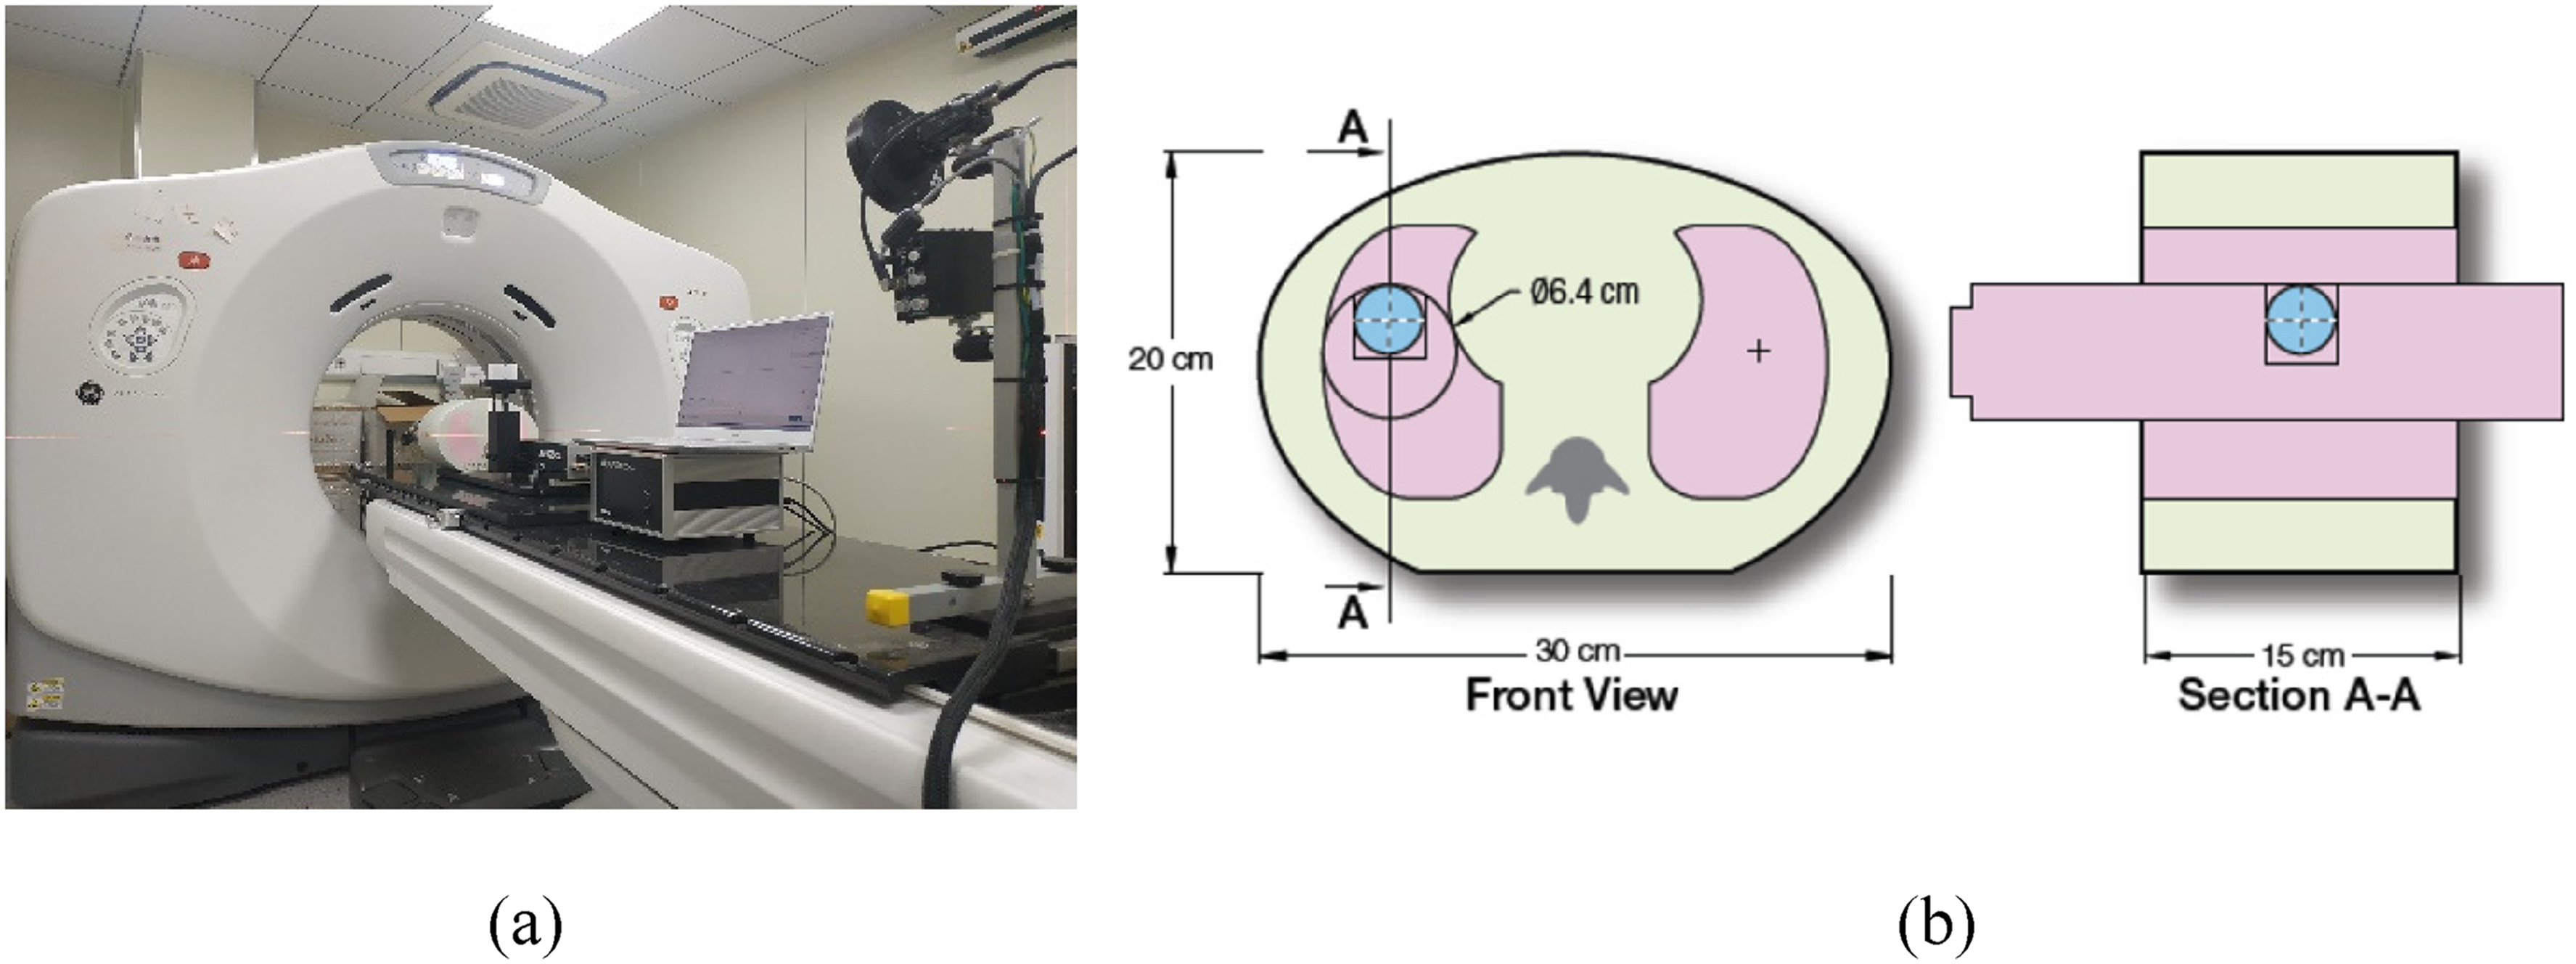
(a) Dynamic thorax phantom for CT simulation. (b) Phantom design.
Imaging and Treatment Plans
The experiments were conducted on a GE scanner with 4D-CT and real-time position management device (Varian Medical Systems). The respiratory signal representing the vertical motion of the abdominal surface was recorded with the aid of reflective markers placed on the phantom's holder and an infrared camera available in a commercial respiratory management system. This phantom was scanned under cine mode using 2.5-mm interslice distance with the protocol routinely used for lung radiation therapy planning. Typically, a cine 4D-CT scan takes approximately 2 min to cover 30 cm or 15 cine CT positions. During the scan, there was no interruption, and the duration of each cine CT scan was at least 1 s longer than the duration of the average breath cycle. 49
Then CT images were imported into Eclipse for contouring and treatment planning. Maximum intensity projection and average intensity projection images were generated from 4D-CTs. The internal target volume (ITV) was defined as the gross target volume (GTV) envelope delineated in the selected respiratory cycle phases. The ITV included all GTV phases in this work. Planning target volume (PTV) was generated by applying an additional isotropic margin of 5 mm to the ITV. For treatment planning and delivery of the plans, a TrueBeam linear accelerator with a Millennium multileaf collimator (Varian Medical Systems) was used. The SBRT plans consisted of 11 coplanar beams at gantry angles of 179°, 160°, 140°, 120°, 100°, 80°, 60°, 40°, 20°, 200°, and 220°, without collimator rotation. Beam energies of 6 MV flattening filter free beams and Acuros XB algorithms (Varian Medical Systems, v13.6.23) for dose calculation were used. The dose calculation grid size was 1.25 mm for all calculations. All plans were optimized to ensure that at least 95% of the PTV encompassed by 100% of prescribed dose and at least 99% of the PTV receiving doses 95% of the prescribed dose during optimization. The critical organ dose-volume limits and dose conformity and gradient quality parameters were controlled according to the Radiation Therapy Oncology Group 0813/0915 report. Before each plan delivery, the peak-to-peak amplitude was intentionally changed to either 10 mm or 5 mm, and a corresponding half-fan full rotation kV-CBCT scan was performed to generate sCT images.
Velocity and Adapt Volume Option
Adaptive radiotherapy is one main technology to achieve precise treatment currently. Deformable registration, sCT generation, replanning technology, and dose accumulation are crucial steps to implement ART. The movement of the target volume and organs at risk (OARs) may have an unpredictable influence on the dose distribution between treatment fractions for lung SBRT treatment. However, the introduction of the Velocity program offers an ideal solution for the dynamic dose assessment based on CBCT.
Velocity adopts a B-spline deformation algorithm for image registration and has an advantage of fast calculation speed, which allows users to generate sCT by integrating the pCT with the CBCT. The sCT leverages the geometry of the CBCT along with the HUs of the pCT to the CBCT for dose calculation during ART planning. Once the sCT is created, the original approved plan can be copied onto it and dose calculation can be performed. The Create Reshaped operation generates a new volume with volume boundaries matching those of the pCT. Within the overlap of the pCT and CBCT volumes, the operation deforms the pCT using the inverse deformation from the registration process. Outside the overlap region, the operation simply copies the pCT without any deformation. All image processing steps are based on the motion CIRS phantom.
With the help of operations such as deformable registration, plan comparison and dose evaluation provided by Velocity, oncologists and medical physicists can track the actual dose delivered to patients cooperatively. In addition, for SBRT patients who received different fractionation schemes sequentially, the biological effective dose assessment tool can also be employed to evaluate the dose volume histogram for target volume and organ at risk from the perspective of radiobiology.
Geometrical and Dosimetric Assessment Metrics
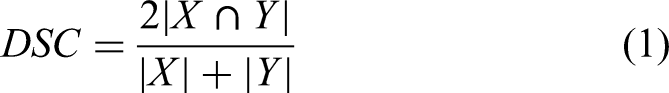
Generally, the accuracy of the synthetically generated images is assessed by considering the preservation of anatomical structures, image quality and HU accuracy. Two metrics, namely the 95% Hausdorff distance (HD95) and the Dice similarity coefficient (DSC), are used to quantitatively compare the accuracy of delineation. The metric HD95 evaluates the shape difference and DSC describes the spatial overlap between the sCT delineation and the ground truth CT image delineation (it refers to pCT or rCT). The well-established metrics such as ME, MAE, structural similarity index (SSIM), peak signal to noise ratio (PSNR), and spatial nonuniformity (SNU) are used to assess the image quality of the synthetic images compared to the ground truth images. Since the CBCT-based sCT focus on improving the HU accuracy and removing the image artifacts caused by patient breathing and internal organ movement, MAE is considered as the primary metric to evaluate the sCT images quality.
50
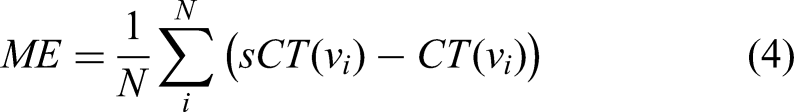
Mean error and MAE reflect the difference in HU value between pCT and sCT, with smaller MAE indicating, better image quality. Structural similarity index is a full-reference image quality evaluation index that measures image similarity in terms of brightness, contrast, and structure. Its numerical range is from 0 to 1. Peak signal to noise ratio is a commonly used objective evaluation index for images. It is the logarithm of the mean square error between sCT and pCT relative to the square of the maximum signal. Spatial nonuniformity is another metric used for image assessment, which measures the difference between the maximum and minimum HU values in regions of interest (ROIs) between the same materials. These metrics are defined as below (1-8).
51
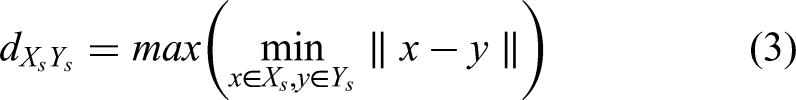
X denotes the ground truth CT image delineation, and Y denotes the sCT delineation volume in formula (1). In formula (2), HD95 measures the 95th percentile distance of all distances between points in X and the nearest point in Y. Let


The pCT/rCT or sCT image corresponding to a particular motion pattern was imported into the Eclipse TPS, wherein the former CT was selected as the ground truth CT image in terms of dosimetry. The SBRT plans were verified by maintaining the same monitor units according to the original treatment plans. A quick dose recalculation was performed on the sCT images to assess dosimetric accuracy based on isodose line comparisons, dose-volume histogram (DVH) parameters, and gamma index evaluation.52,53 Isodose line comparison offers spatial information about the dose distributions. The difference in DVH metrics for target volumes and OARs between pCT/rCT and sCT was assessed for quantitative dosimetric evaluation. The DVH metrics for the target volumes, including D90, D95, and V95, were analyzed. Target coverage was defined as the dose received by 90% and 95% of the target volume (D90, D95) and the percent volume receiving 95% of the prescribed dose (V95) for PTV. ΔD90, ΔD95, and ΔV95 are defined as below (9-11). Additionally, V5, V10, V20, V30, Dmean (the mean dose) for lung, and Dmax (the maximum dose) for the spinal cord were evaluated for quantitative dosimetric accuracy. The gamma pass rates were calculated with the criteria of 1%/1 mm within the body, and gamma values were not calculated for doses below 10% of the maximum dose:


Results
Accuracy of the Synthetic Image
Preservation of Anatomical Structures
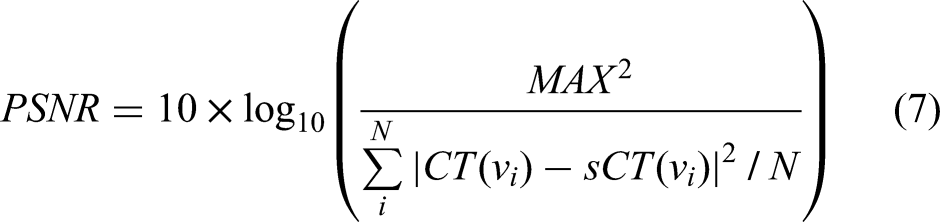
95% Hausdorff distance and Dice similarity metrics were used to establish a quantitative comparison between structures contoured independently on the sCT and the pCT images, with the pCT contours serving as the ground truth CT. It was observed that the contours in the sCT were consistently closer to pCT contours as listed in Table 1 by the mean HD95 values. Furthermore, the DSC demonstrated a strong correlation between the synthetic contours and the pCT contours, with all DSC values exceeding above 0.9. Additionally, the checkerboard method was employed to establish a detailed comparison of fine-image structures between the CBCT and the sCT or pCT. A comparison of anatomical preservation between the sCT/pCT and CBCT images is shown in Figure 2. The images were divided into an 8-by-8 checkerboard pattern of squares, with alternating squares displaying the sCT and CBCT images (top) and, the pCT and CBCT images (bottom). Axial, coronal, and sagittal slices from left to right in that order.
Anatomical preservation comparison for sCT/pCT and CBCT images was presented. Checkerboard pattern for the synthetic and CBCT image (top), CBCT image (middle), and checkerboard pattern for pCT and CBCT images (bottom). sCT, synthetic CT; pCT, planning 4D-CT; CBCT, cone beam computed tomography.
Comparisons of Hausdorff Distance and Dice Similarity Metrics.

Abbreviations: pCT, planning 4D-CT; sCT, synthetic CT; ITV, internal target volume; PTV, planning target volume.
Cone Beam Computed Tomography–Based sCT Quality Evaluation
To evaluate the performance of the synthetic image, 5 fundamental evaluation criteria were employed: ME, MAE, PSNR, SSIM, and SNU. The pCT image was used as the ground truth image for these calculations. Comparisons of the ME, MAE, PSNR, SSIM, and SNU values among CBCT, sCT, and pCT images are shown in Table 2. It was evident that the image quality of sCT exhibited significant improvement compared to CBCT. The MAE within the lung region was less than 40 HU, confirming consistency with previous research. Additionally, minimal MAE was observed in cases without significant interfractional motion, indicating the suitability of Velocity for regular breathing motion scenarios in lung ART. High PSNR and SSIM values indicated high image quality. In this study, deformable registration was performed on the sCT/CBCT to align with the pCT, and the metrics were calculated within the body mask of the sCT/CBCT. The SNU in sCT was found to be similar to that in the pCT, which suggested that the sCT had sufficient quality for contour delineation and dose calculation. As shown in Figure 3, the synthetically generated images had improved contrast resolution, as well as reduced noise and artifacts severity compared to the CBCT.
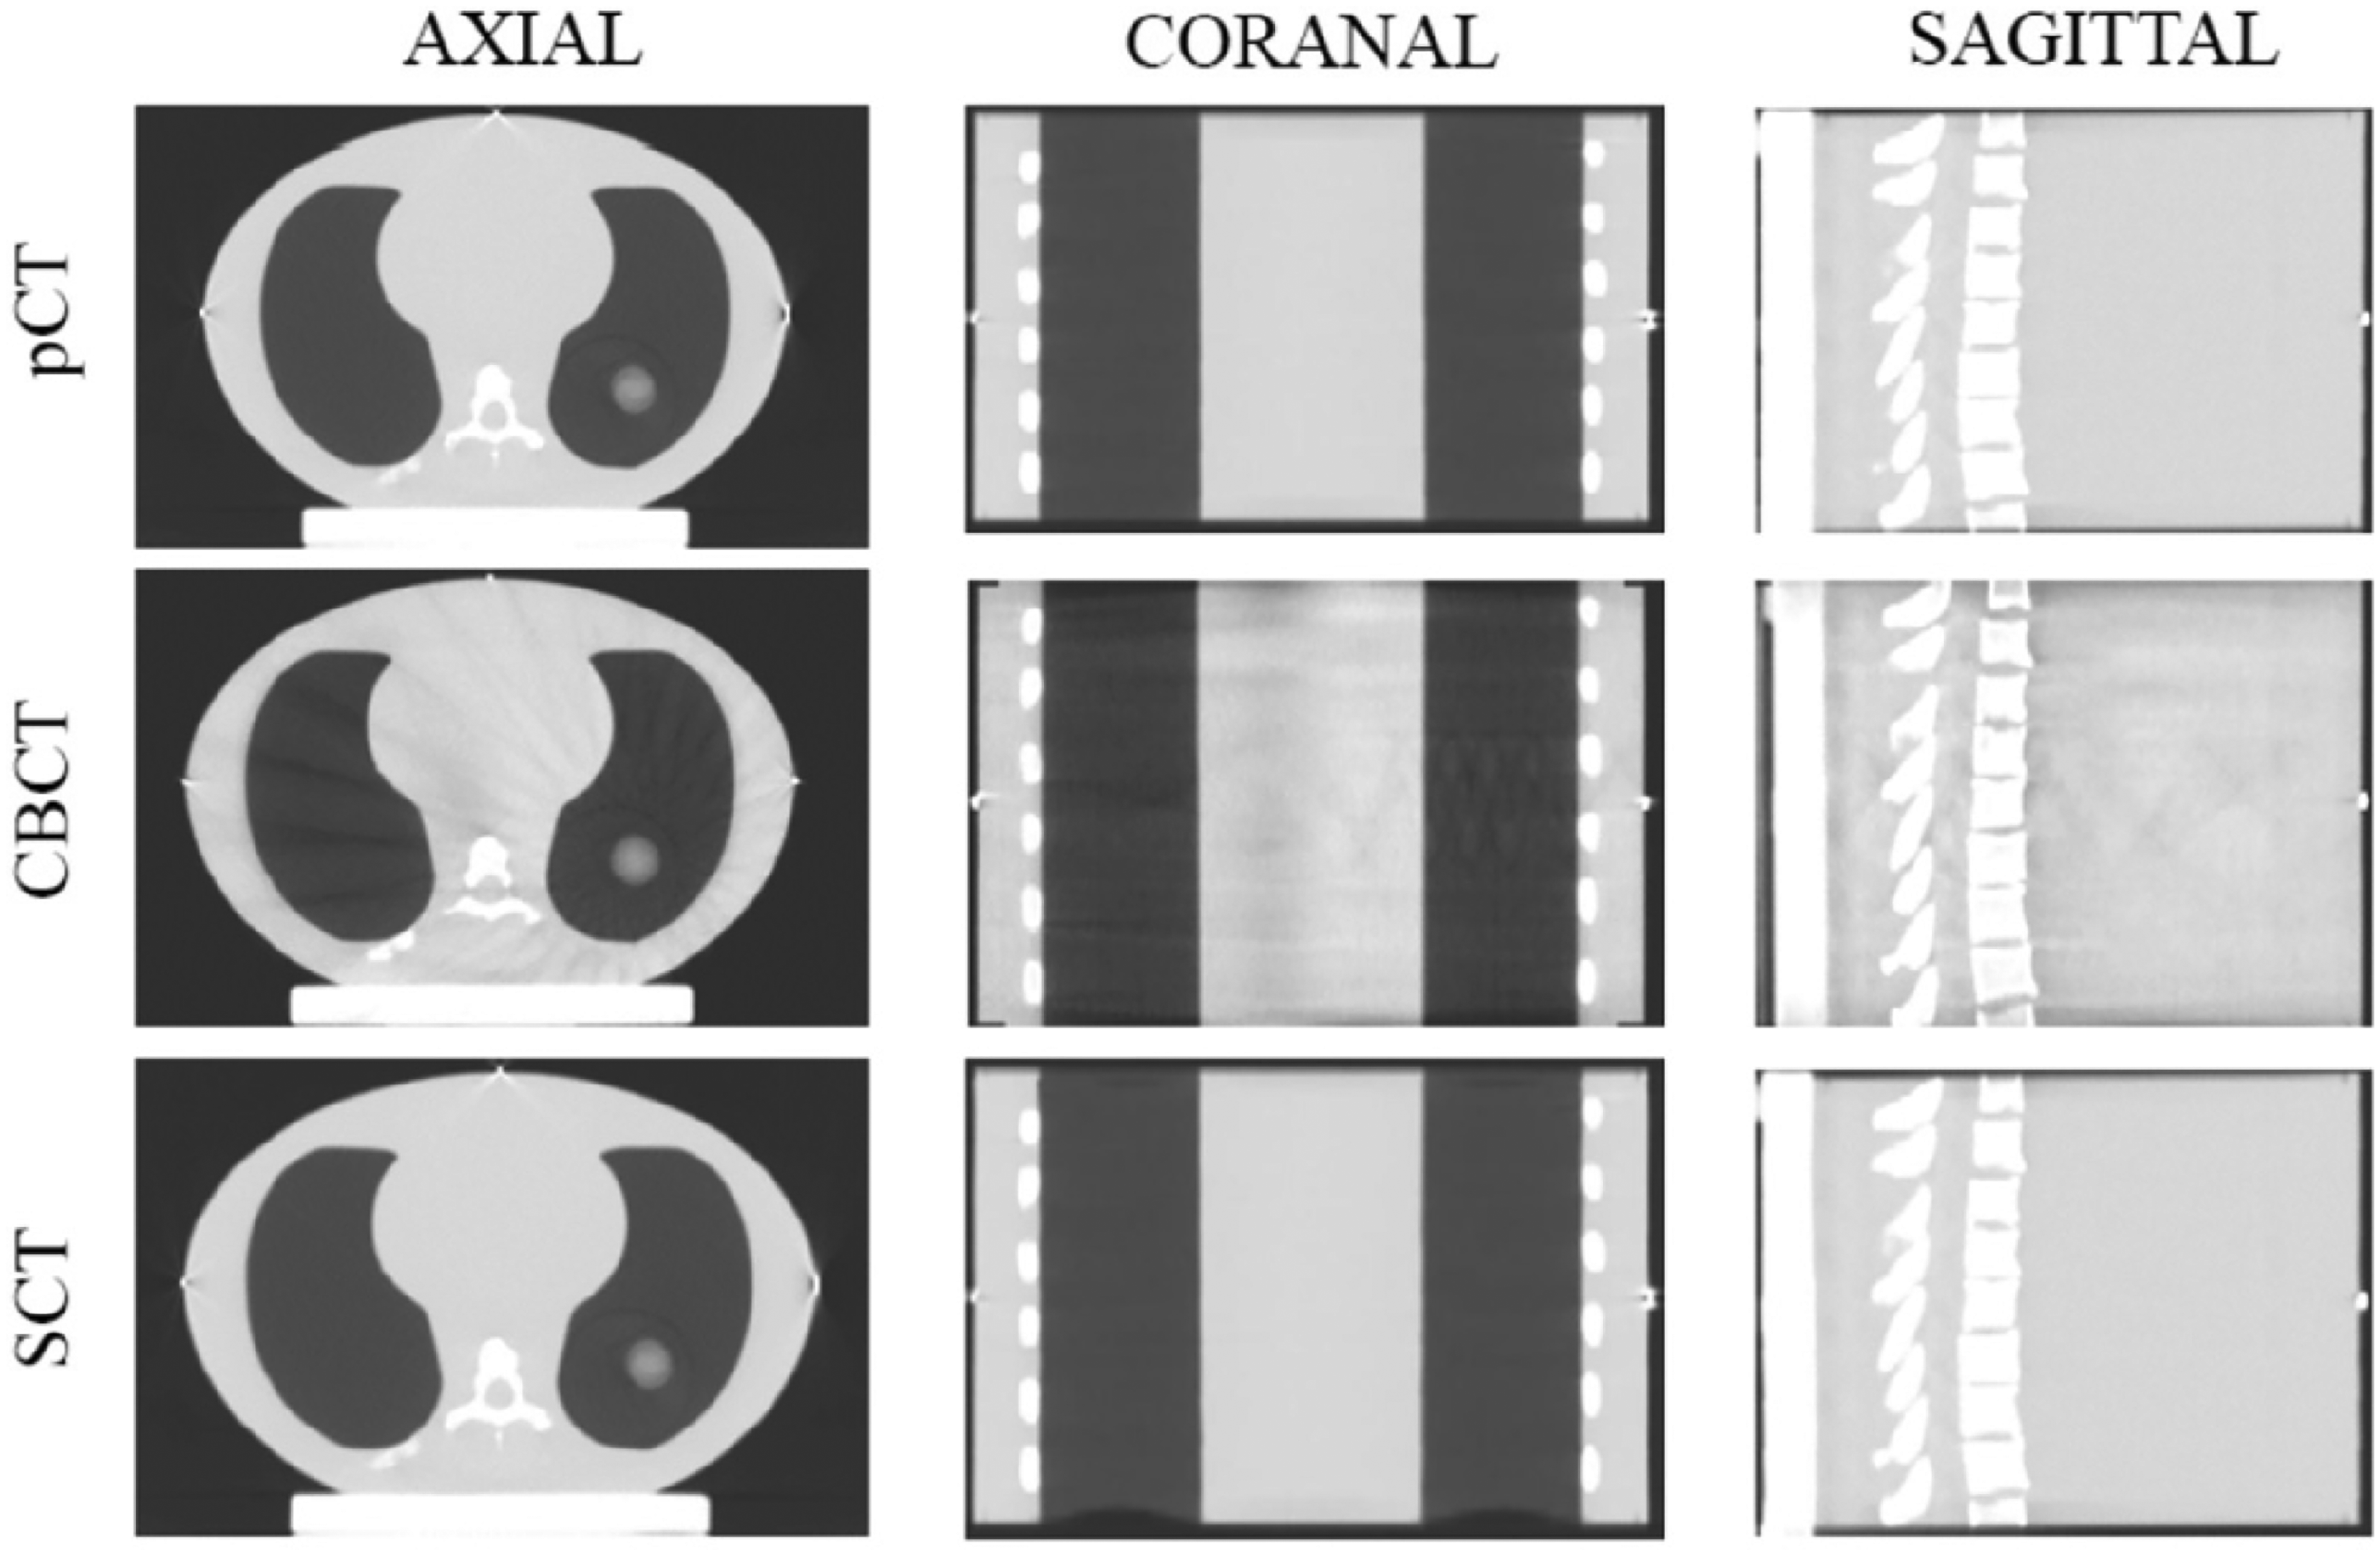
Image quality visualization.
Quantitative Similarity Analysis Between CBCT and Registered pCT, sCT, and Registered pCT.

Abbreviations: pCT, planning 4D-CT; sCT, synthetic CT; CBCT, cone beam computed tomography; HU, hounsfield unit; ME, mean error; MAE, mean absolute error; SSIM, structural similarity index; PSNR, peak signal to noise ratio; SNU, spatial nonuniformity.
Accuracy of Hounsfield Units
Hounsfield unit accuracy was assessed globally by plotting histograms of the 3D volumes for sCT, pCT, and CBCT, respectively. As shown in Figure 4, the histograms illustrated the distribution of HU values for the respective testing volumes. The vertical axis represented the counts and the horizontal axis represented the HU range. The histogram of the synthetic volumes closely tracked the pCT histogram volume, and the sCT histogram showed a better differentiation of bone marker compared to the CBCT volume. In Figure 4, the lower-right section showed that the HU distribution was more variable in Spinal cord on CBCT compared to pCT and sCT. Additionally, the histogram peak on CBCT showed a relatively larger shift compared to pCT and sCT. Therefore, the HU distribution of sCT was more consistent with pCT than that of CBCT. Mean and standard deviation values are shown in Table 3. The mean percent HU difference of the synthetic HU values per organ relative to the pCT image was 22.3% (max 70%—spinal cord; min 1.5%—left lung). Under the same conditions, the mean percent HU difference of the CBCT HU values per organ relative to the pCT image was 83.9% (max 482%—spinal cord; min 8.8%—left lung). Overall, the accuracy of HUs in sCT was improved obviously, and the variability of the synthetic image correlates with the variability of the pCT image. The HU profile of sCT was most consistent with that of the pCT image.
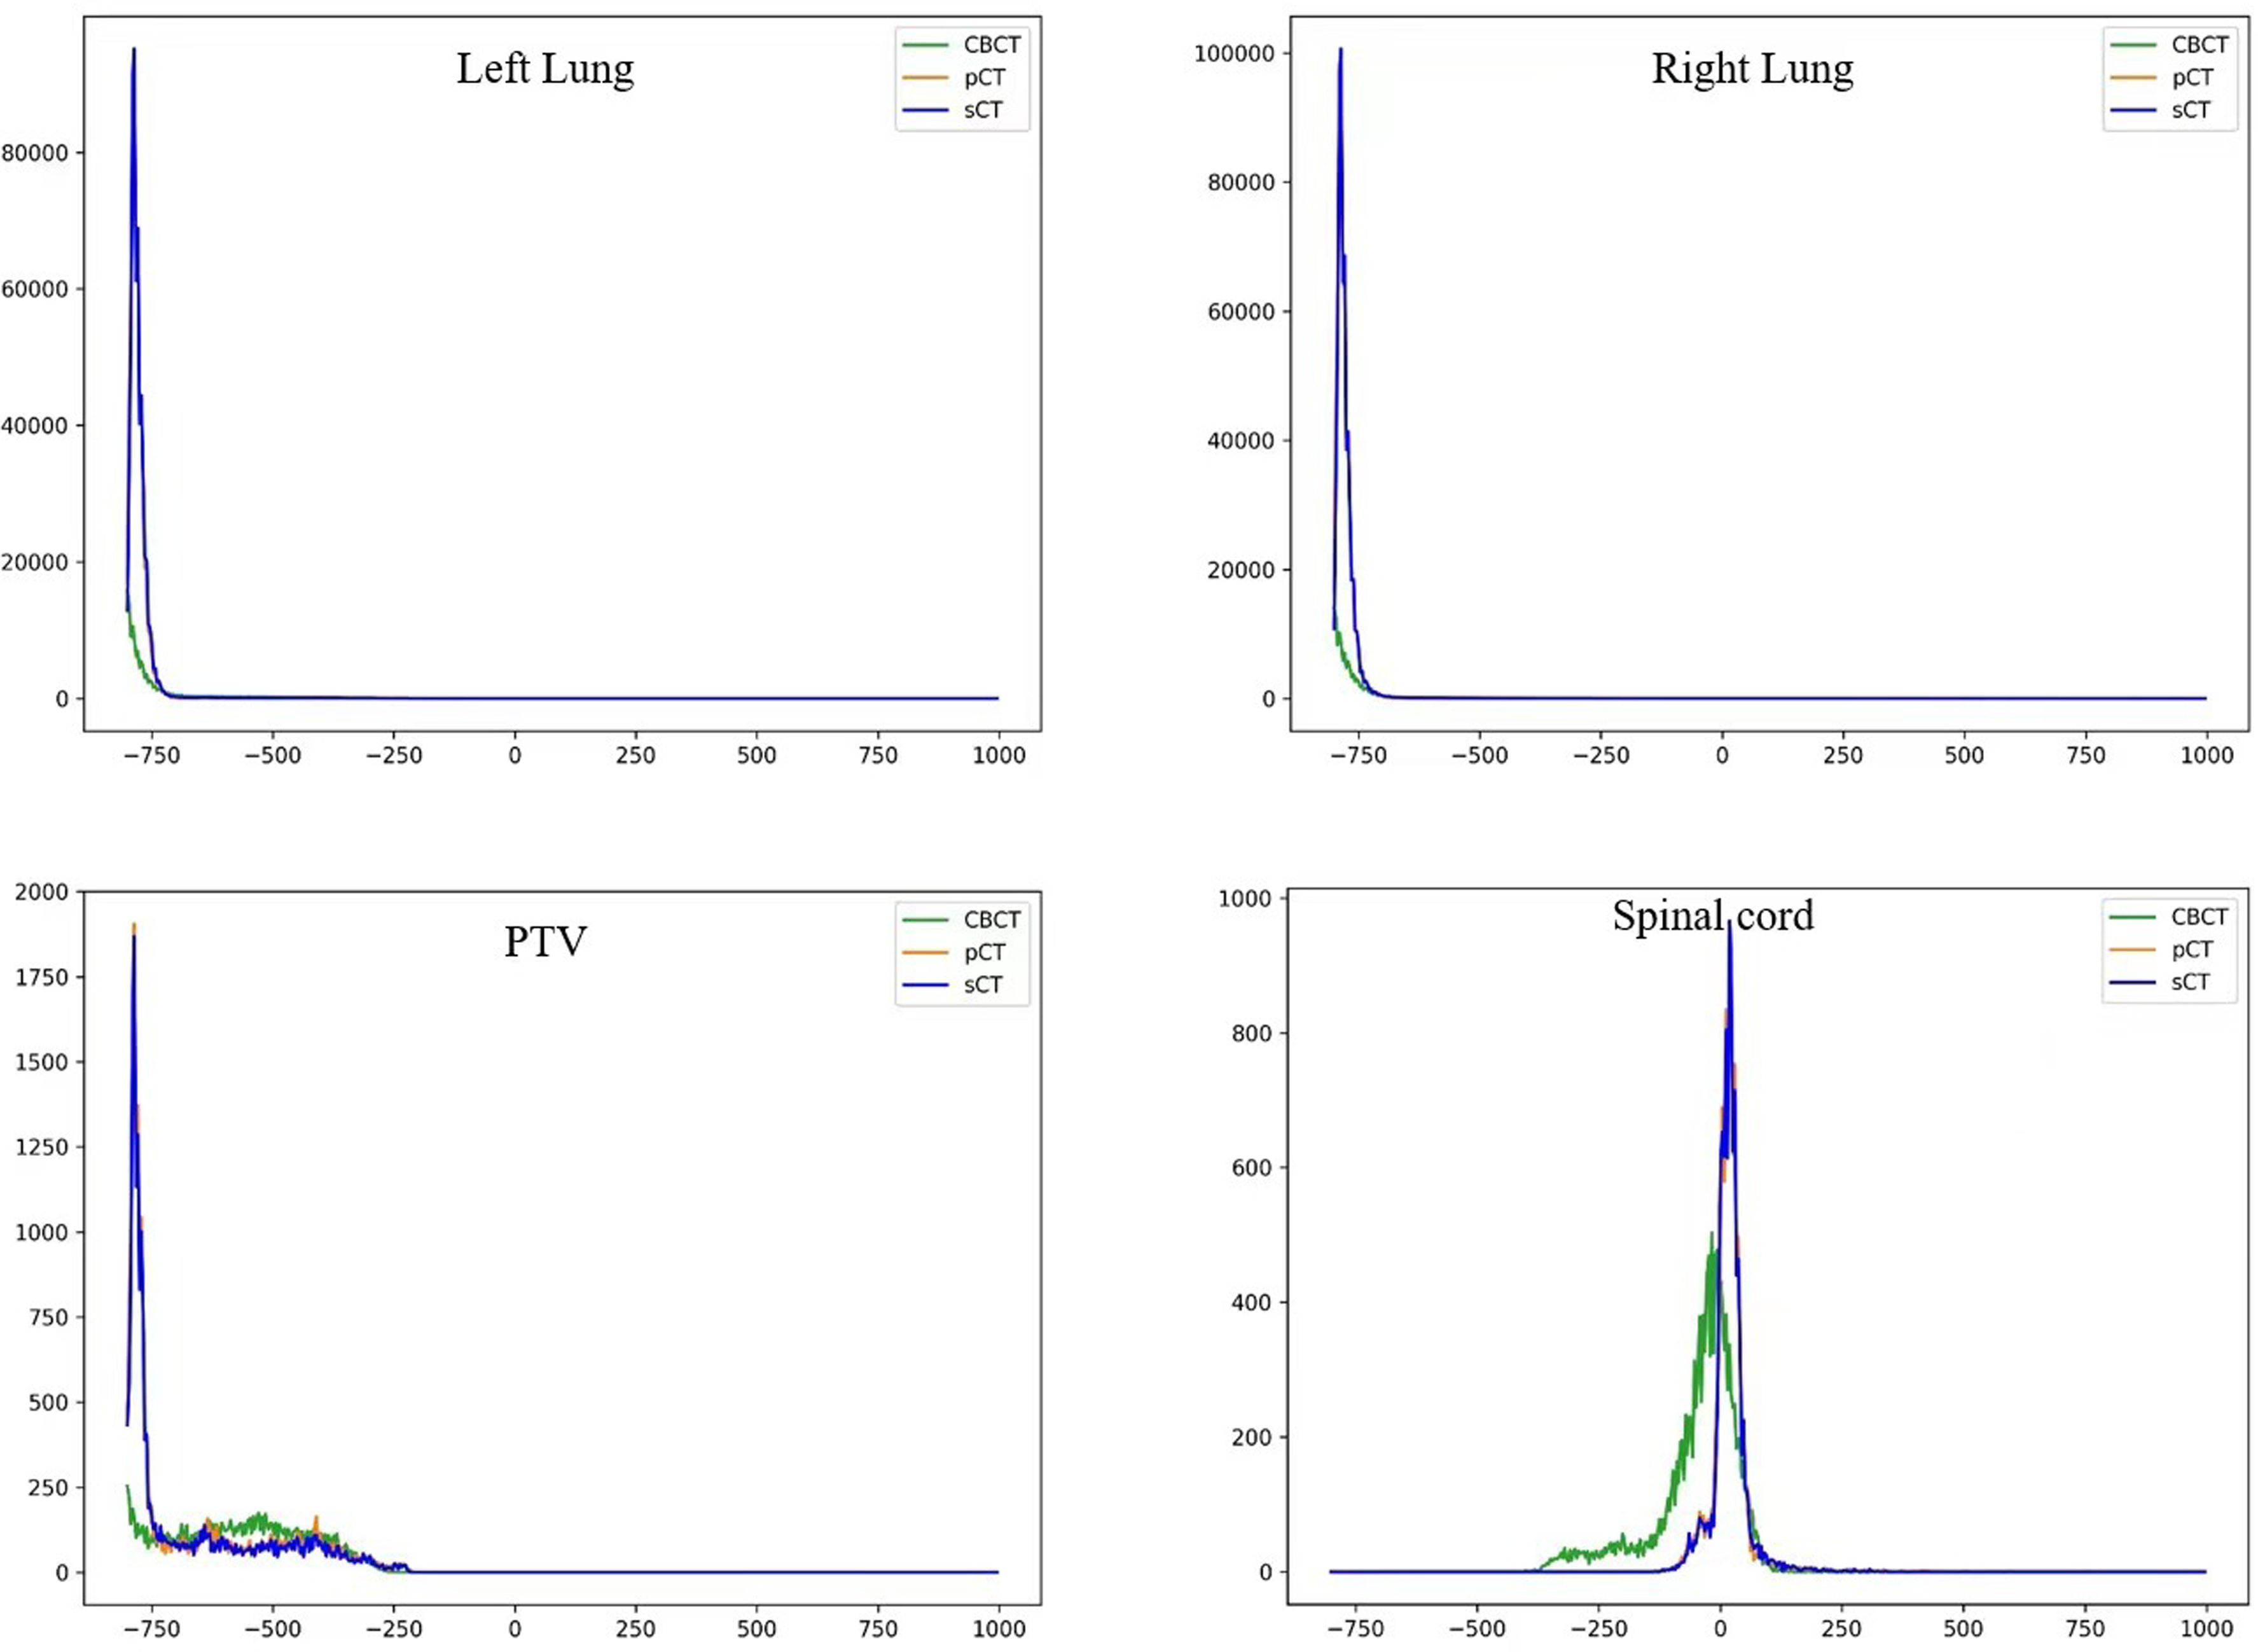
HU histograms for the testing volumes corresponding to the pCT, CBCT, and sCT, respectively. The vertical axis represented the counts and the horizontal axis represented the HU range. sCT, synthetic CT; pCT, planning 4D-CT; CBCT, cone beam computed tomography; HU, hounsfield unit.
HU Mean, STD Values for Specific ROIs.
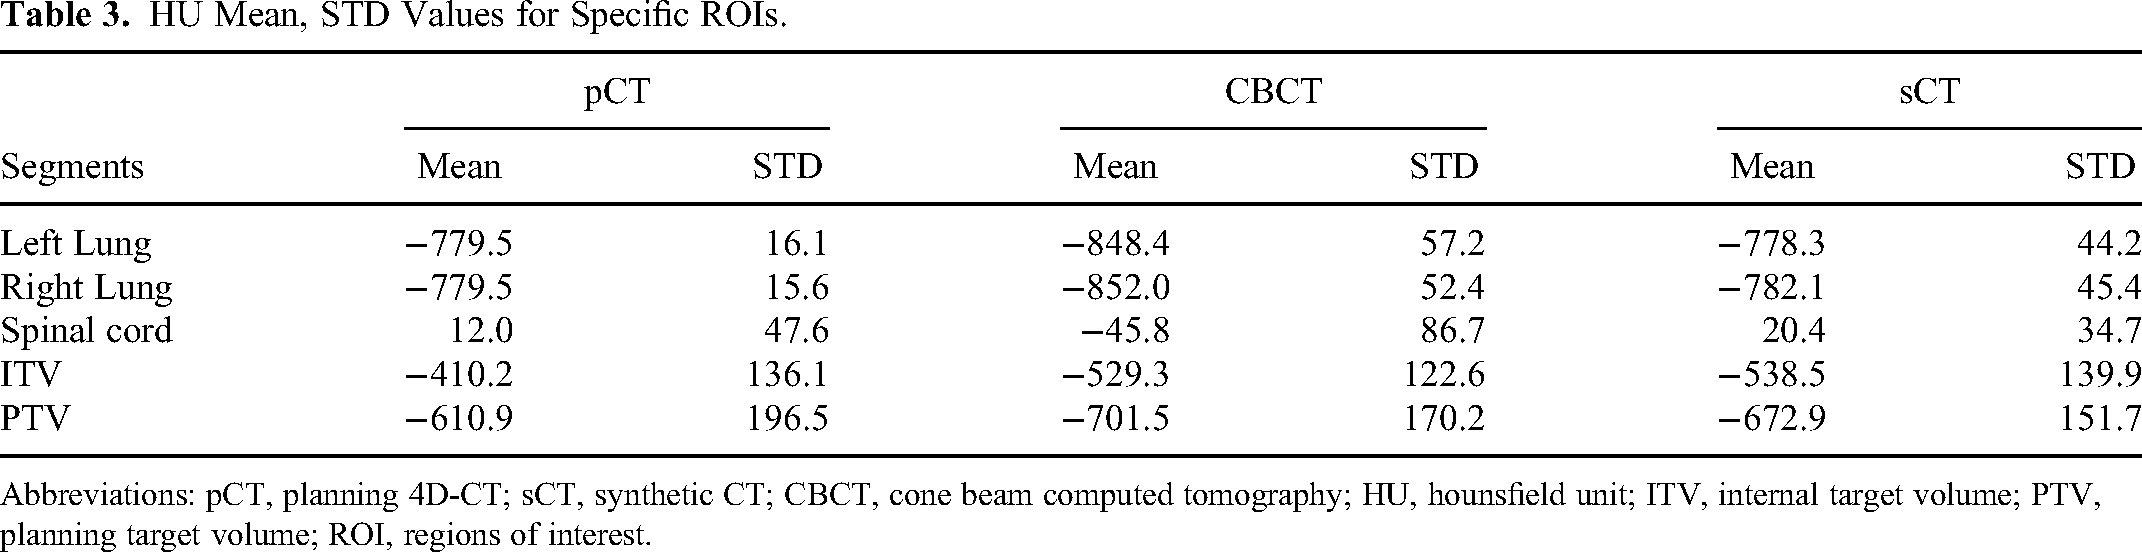
Abbreviations: pCT, planning 4D-CT; sCT, synthetic CT; CBCT, cone beam computed tomography; HU, hounsfield unit; ITV, internal target volume; PTV, planning target volume; ROI, regions of interest.
Dosimetric Accuracy Evaluation
Dose Volume Histograms Analysis
Dose-volume histograms were one of the most common plan evaluation tools to compare doses from different plans. To simplify the visualization, we only included the PTV and the Spinal cord in the plots. We compared DVHs between pCT and sCT under different motion patterns: a 15 mm constant, a peak-to-peak amplitude of 10 mm (δ = 5 mm), and a peak-to-peak amplitude 5 mm (δ = 10 mm). Cumulative DVHs for pCT/rCT and sCT are shown in Figure 5. The DVHs between pCT and sCT almost coincided with each other for case δ = 0, indicating that Velocity can qualified CBCT-based lung offline ART well when there were no interfractional respiratory variations. However, as the interfractional respiratory variation increased, the offline adaptive capacity of Velocity deteriorated noticeably and the greatest difference in case δ = 10 mm was observed in the PTV structure. For case δ = 10 mm, the volume covered at least by 100% of the prescription dose was 95% for rCT5 (δ = 10 mm) and only 59.6% for the one-to-one synthetic image. Additional dose statistics per volume are listed in Table 4 for pCT/rCT-based and synthetic-based calculation. The data also showed that the adaptive effect of Velocity deteriorated obviously when minor interfractional respiratory variations occurred. The results of the synthetic-based calculation were found to be quite similar to those of the pCT-based calculation. However, the calculations using sCT5 (δ = 10 mm)/ sCT10 (δ = 5 mm) showed a significant deviation from the ground truth plans. It was observed that the difference in dosimetry statistics became more pronounced as the motion amplitude varied. The difference in DVH metrics of lung and spinal cord between pCT/rCT and sCT, such as V5, V10, V20, V30, Dmean for Lung, and Dmax for the Spinal cord, are also listed in Table 5 for quantitative dosimetric accuracy.
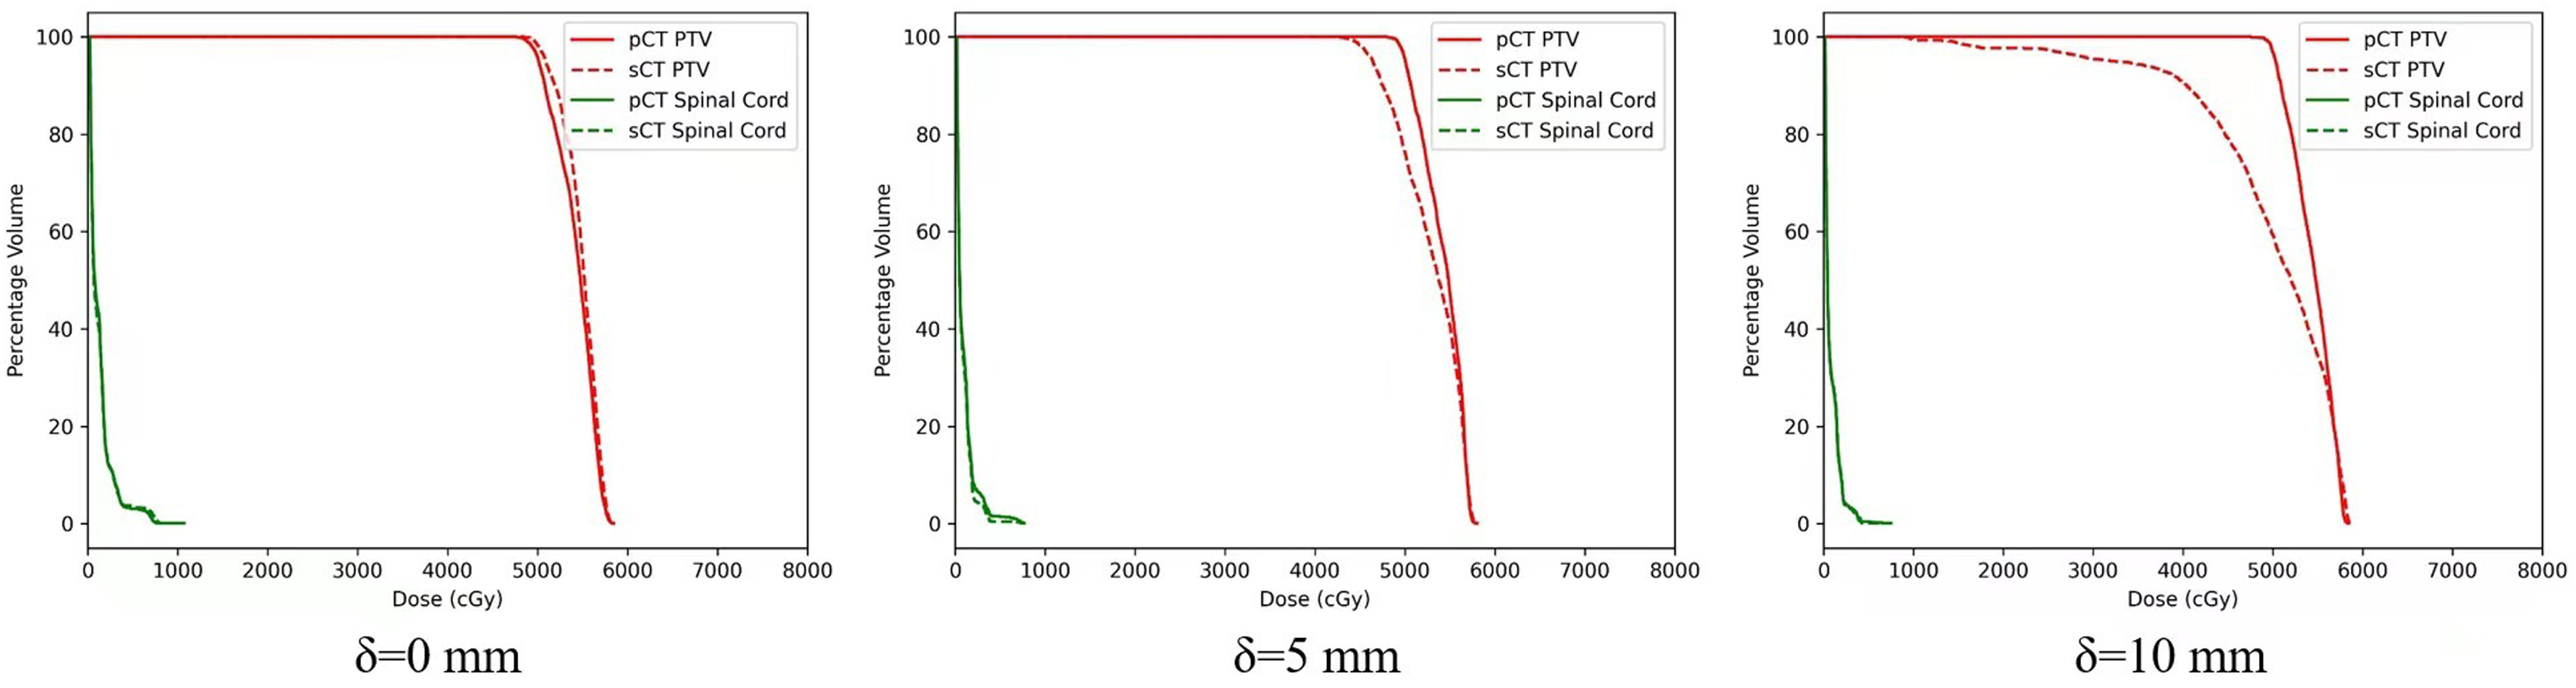
Cumulative DVHs for pCT/rCT-based (solid line) and sCT-based (dotted line) dose calculations. δ = 0 indicates the motion pattern kept amplitude 15 mm constant and then changed the peak-to-peak amplitude to 10 mm (δ = 5 mm) or 5 mm (δ = 10 mm) intentionally for comparisons. The DVHs between pCT and sCT almost coincided with each other for case δ = 0 and with the interfractional respiratory variation increasing, the offline adaptive capacity of Velocity will deteriorate obviously and the greatest difference in case δ = 10 mm was observed in the PTV structure. sCT, synthetic CT; pCT, planning 4D-CT; rCT, repeated 4D-CT; PTV, planning target volume; DVH, dose-volume histogram.
DVH Metrics of the PTV for Synthetic Image and pCT/rCT.

Abbreviations: pCT, planning 4D-CT; sCT, synthetic CT; rCT, repeated 4D-CT; PTV, planning target volume; DVH, dose-volume histogram.
The Difference in DVH Metrics of Lung and Spinal Cord Between pCT/rCT and sCT, Such as V5, V10, V20, V30, Dmean for Lung, and Dmax for the Spinal Cord, Were Also Listed for Quantitative Dosimetric Accuracy.

Abbreviations: pCT, planning 4D-CT; sCT, synthetic CT; rCT, repeated 4D-CT; DVH, dose-volume histogram.
Isodose Lines Comparison
When interfractional motion variation occurs, the dose distribution of the sCT will differ from the corresponding ground truth dose. To assess the spatial differences, we compared axial, sagittal, and coronal isodose distributions for the case δ = 0 and case δ = 10 mm, since the application of DVH was not sufficient for evaluating the pros and cons of tangled cases for high-precision treatment planning. Figure 6 showed the comparisons of isodose lines between the pCT/rCT and the corresponding sCT. For the case δ = 0, the isodose distribution was similar and consistent, which suggested that Velocity was capable of effectively managing CBCT-based ART when the patient's breathing remained regularly. However, for the δ = 10 mm case, only a portion of the PTV was encompassed by the 100% prescribed dose. Region with significant deviations from the rCT5 was highlighted with a yellow arrow. Overall, the sCT isodose lines showed better agreement with the pCT isodose lines when the motion pattern remained constant.
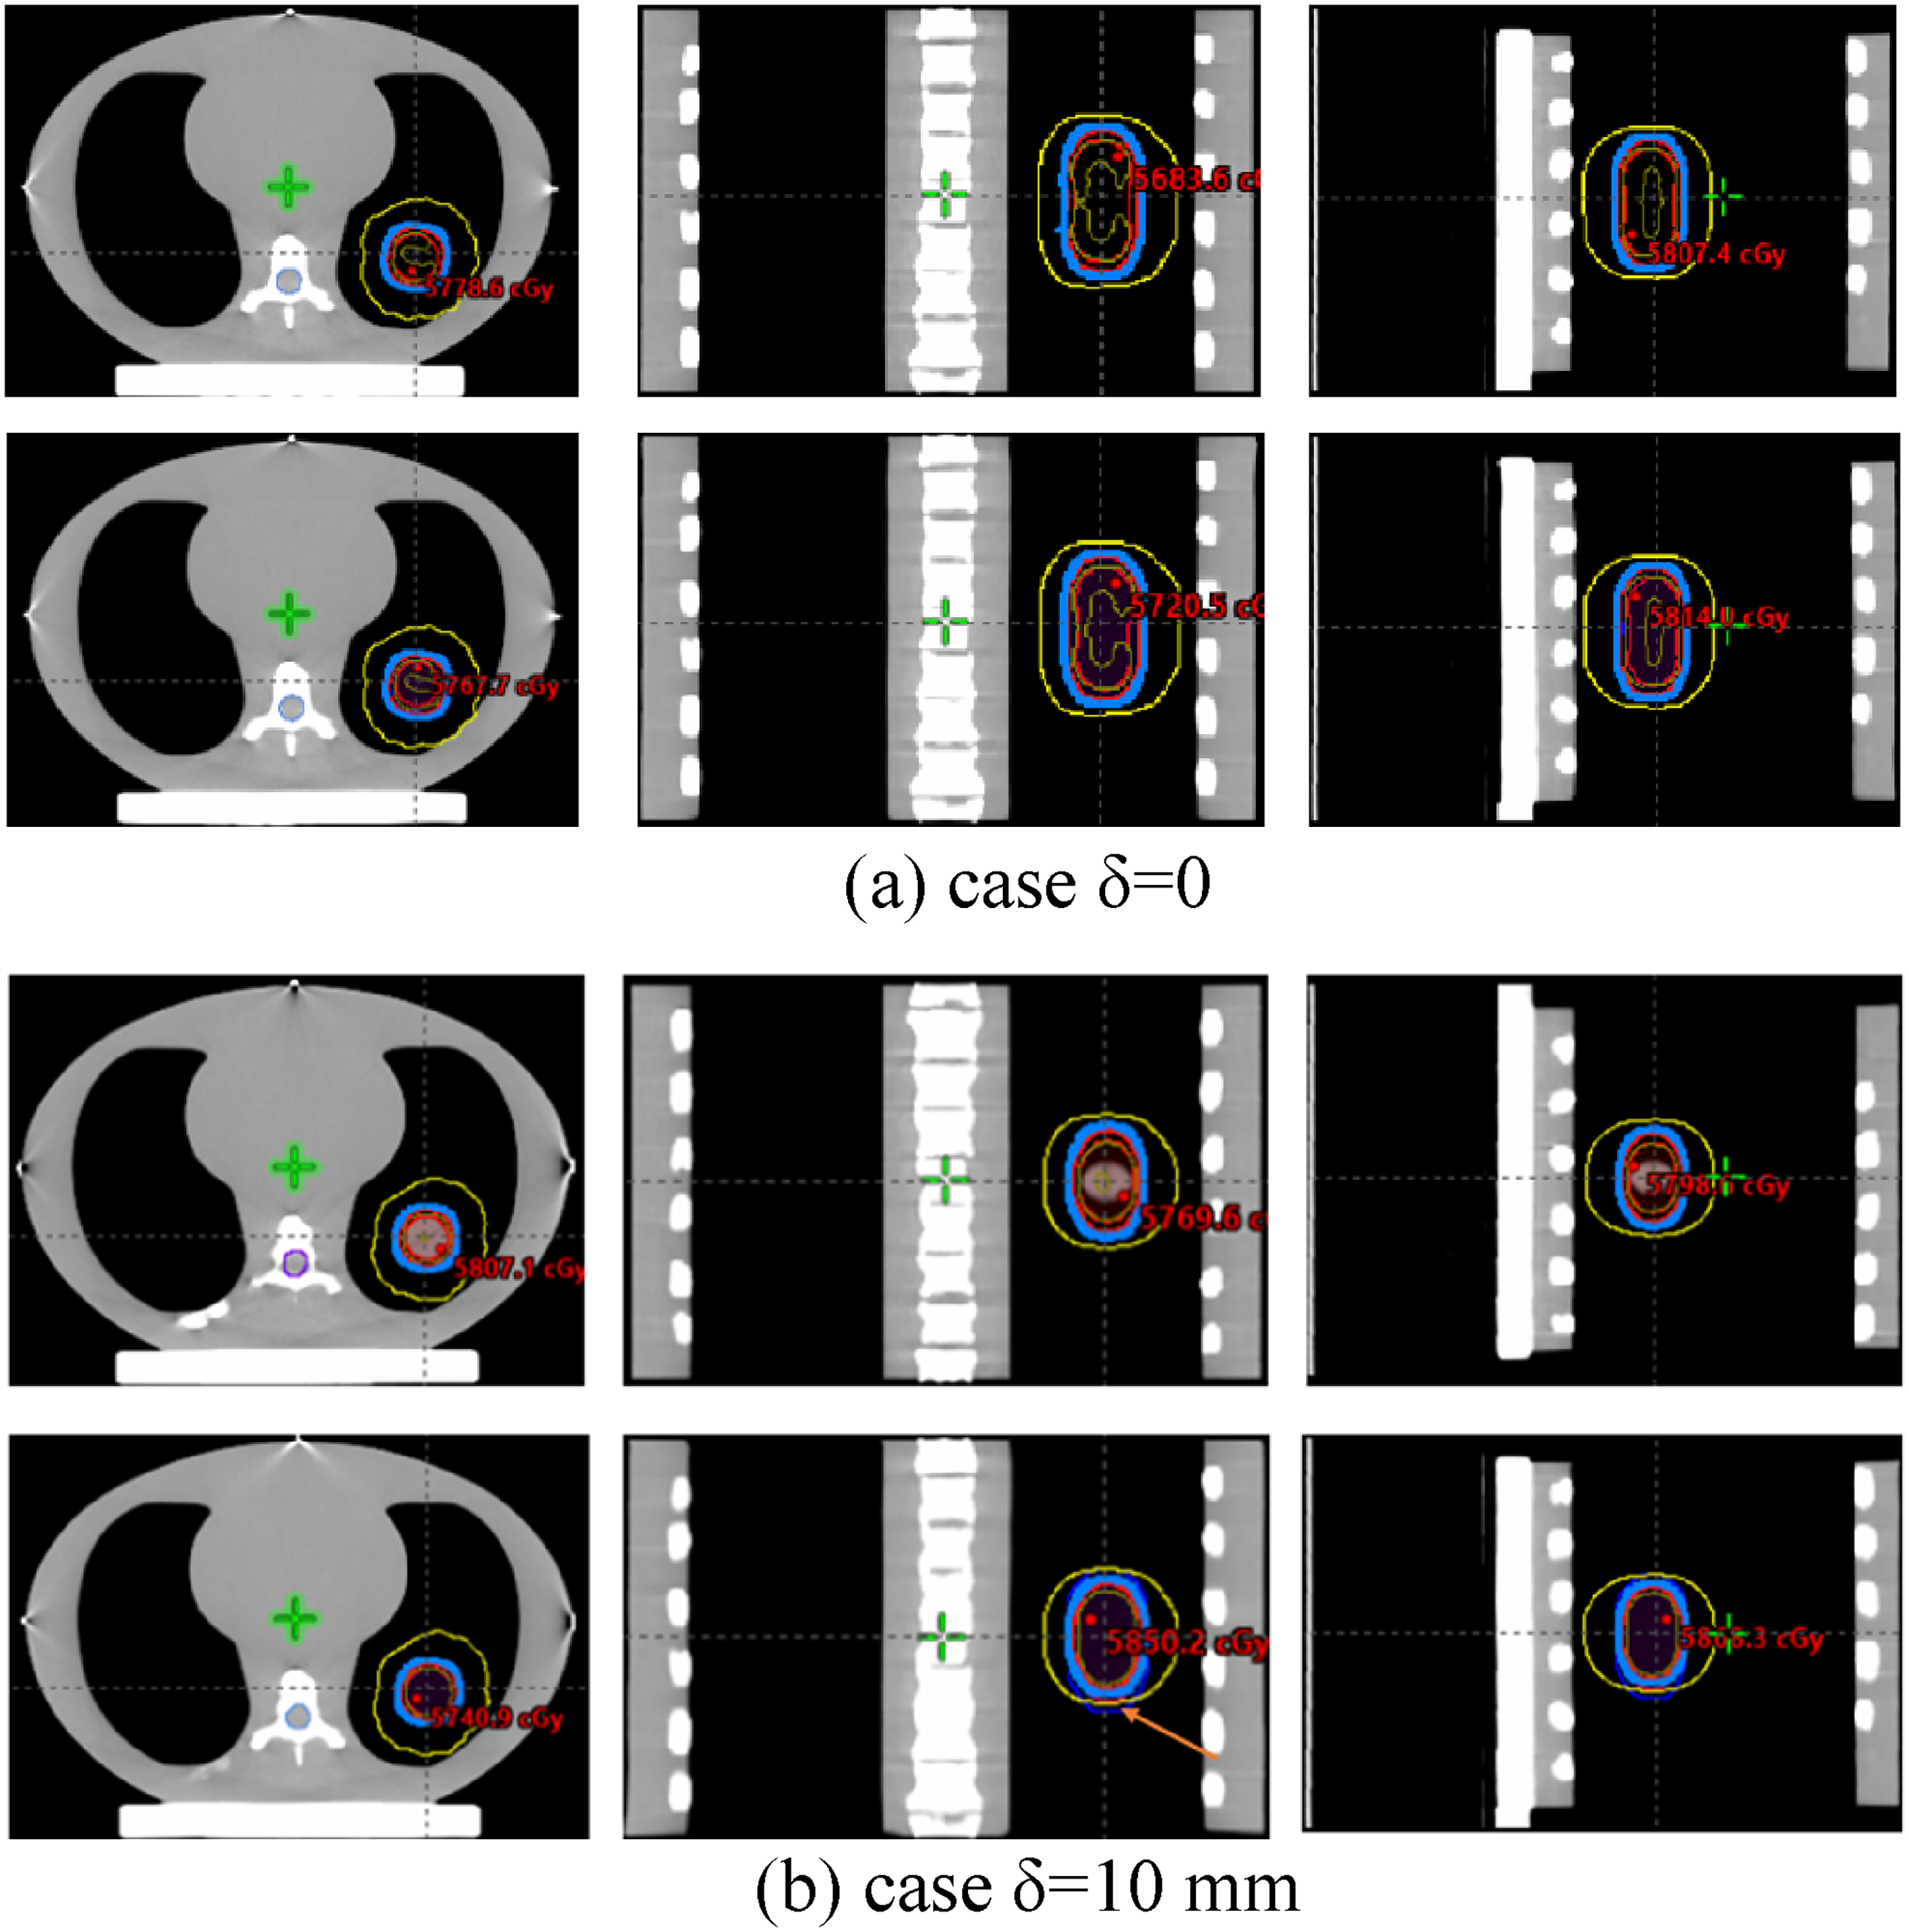
Isodose lines comparisons between the pCT/rCT and the one-to-one sCT. The isodose distribution for the case δ = 0 was similar and consistent, however, only partial PTV in case δ = 10 mm was encompassed by the 100% prescribed dose. sCT, synthetic CT; pCT, planning 4D-CT; rCT, repeated 4D-CT; PTV, planning target volume.
Two-Dimensional Gamma Analysis
The gamma index evaluation is commonly used to quantitatively compare 2 dose distributions. We exported orthogonal slices at the isocenter for the dose verification plans (pCT/rCT and synthetic) and the parameter criteria were 1%/1 mm. When the motion pattern remained constant during both the simulation and treatment stages, the gamma passing rates were 99.3%, 89.8%, and 95.0% for axial, sagittal, and coronal slices, respectively. The gamma passing rates for case δ = 10 mm were 100%, 83.1%, and 90.5% for axial, sagittal, and coronal slices, respectively. It was evident that the gamma passing rate for sagittal plane deteriorated when there was a significant change in peak-to-peak amplitude, which was due to the irregular target motion in SI direction.
Discussion
The occurrence of breathing irregularities between treatment sessions can lead to anatomical changes that cannot be completely avoided. These changes can result in inconsistencies between the actual delivered dose and the planning dose during interfractional lung radiotherapy. Studies have been estimated that a 1-mm deviation in tumor segmentation could impact the dose calculations by up to 15%. 54 Currently, the preferred method in clinical practice involves deforming the planning CT image and contours to match the daily acquired CBCT. This allows for the recalculation of the dose to enable adaptive monitoring or replanning. 55 In this study, we generated sCT images using the Velocity program and then assessed the quality of these images and the accuracy of dose calculation in the context of lung ART. We focused on an anatomical region with high interfraction variability as it poses the greatest challenge for image registration algorithms. To quantitatively investigate the impact of reasonable interfractional respiratory variations on dose and target geometry, we utilized a 4D motion lung phantom. This phantom maintained a characteristic motion pattern consistently throughout the simulation stage, allowing for the introduction of minor interfractional motion variations during the treatment stage.
In this work, we utilized Velocity to generate sCT images from kV-CBCT images for offline dose calculations using the CIRS phantom. We evaluated the quality of sCT image through qualitative image similarity metrics and dosimetric metrics. Firstly, we assessed the accuracy of synthetic images by examining the preservation of anatomical structures, image quality, and HU accuracy. The quantitative metrics, such as HD95 and DSC, demonstrated a higher correlation between the contours of synthetic images and pCT contours (Table 1). Furthermore, the synthetically generated images exhibited improved image quality compared to the CBCT images. Table 2 shows an increase in image quality reflected by higher PSNR and lower MAE values. Mean absolute error was considered the primary metric for evaluating the quality of sCT images. Our results showed an improvement in image quality compared to previous studies, with MAE 94.2 ± 31.7 HU for the thorax proposed by Eckl et al. 39 Liu et al 50 recommended focusing on enhancing HU accuracy and reducing image artifacts caused by patient breathing and organ movement when synthesizing CBCT into CT. Our findings indicate that the sCT generated from Velocity not only achieves high HU accuracy but also exhibits fewer image artifacts. As shown in Figure 3, sCT has fewer image artifacts compared to pCT. Comparison of 3D volume HU histograms in Figure 4 reveals that synthetic images and pCT images have similar HU histograms, which significantly differ from the CBCT HU histogram. The mean percent HU difference for synthetic HU values per organ relative to the pCT image was 22.3%. Under the same conditions, the mean percent HU difference for CBCT HU values per organ relative to the pCT image was 83.9%. Additionally, the overall variability of synthetic images corresponds to the variability observed in pCT images, whereas CBCT images exhibited significantly increased variability.
The evaluation of the performance of sCT should not only focus on geometric differences but also include a dosimetric assessment.56,57 In this study, corresponding sCT verification plans were created to compare with the original treatment plans. Dose-volume histograms statistics were calculated, and a dose comparison between sCT and pCT was performed to investigate the dosimetric accuracy. The results showed that the synthetic-based calculation yielded comparable results to the pCT-based calculation. The maximum mean deviation for the DVH statistics was 2.2%. These findings are consistent with a previous study. 58 Furthermore, additional quantitative analysis was conducted by introducing minor interfractional motion magnitude variations during the treatment. The largest difference was observed in the PTV for a special case (δ = 10 mm). The PTV volume receiving the prescription dose was only 59.6% for the synthetic. Isodose lines were also presented to provide spatial information for dosimetric accuracy assessment. Overall, the prescription dose regions and DVHs between sCT and pCT were highly coincident. Gamma analysis was also performed between the dose on the sCT and pCT. It is important to note that the deformable registration from pCT to CBCT depends on image quality and may not accurately accounted for large anatomical changes. Therefore, CBCT-based lung ART may not applicable in cases with significant peak-to-peak amplitude changes. In lung radiotherapy, patient respiration management strategies play a crucial role throughout treatment process. The maximum tumor motion caused by respiratory motion is typically limited to 5.0 mm for external-beam radiation therapy. 59 Adaptive technique may not fully address the challenges posed by severe irregular respiratory in lung cancer radiotherapy.
Conclusion
The use of CBCT for patient setup and adaptive radiation therapy is common practice. The Velocity program's generation of sCT images yields higher image similarity and dosimetric accuracy compared to ground truth images, as long as irregular breathing can be disregarded. The precise dose calculation capability of sCT, with minor error, enables the implementation of ART for lung cancer, utilizing CBCT.
Footnotes
Acknowledgments
This work was beneficial from useful discussions with Professor Xufei Wang from Institute of Modern Physics, Fudan University. The authors also acknowledge the technical support from Bin Su, Nanfeng Zhou, Lvping Li and useful clinical advice from Professor Yaping Xu in Shanghai Pulmonary Hospital, Tongji University School of Medicine.
Declaration of Conflicting Interests
The author(s) declared no potential conflicts of interest with respect to the research, authorship, and/or publication of this article.
Ethics Statement
An ethics approval was not required for this study as the study did not involve clinical samples or animals.
Funding
The author(s) disclosed receipt of the following financial support for the research, authorship, and/or publication of this article: The work was supported by Science and Technology Commission of Shanghai Municipality (18441905600).