
Abstract
Purpose
The malignant transformation of cells can lead to aerobic glycolysis, an important form of metabolic reprogramming in colon cancer cells, which can cause the accumulation of lactate and accelerate the proliferation of tumor cells also enhance their chemotherapy drug resistance. The aim of this study was to investigate the possible molecular mechanisms responsible for the increased lactate expression in colon cancer.
Methods
Several bioinformatics methods, including differential analysis, gene ontology enrichment, univariate and multivariate Cox regression analysis were used to find the lactic acid–related gene carnitine palmitoyltransferase 2. We analyzed the relationship between carnitine palmitoyltransferase 2 and clinical features as well as immune microenvironment. To further explore the mechanism of carnitine palmitoyltransferase 2 in colon cancer, we performed methylation analysis and constructed a competitive endogenous RNA network, which was validated in cell lines and clinical specimens.
Results
We used bioinformatics to select the lactic acid–related gene carnitine palmitoyltransferase 2 and found low expression of carnitine palmitoyltransferase 2 was associated with poor prognosis in colon cancer. An inhibitory tumor microenvironment was created when carnitine palmitoyltransferase 2 expression was reduced, with decreased CD4 T cells, CD8 T cells, dendritic cells, and B cells but increased cancer-associated fibroblasts. Methylation analysis showed that the abnormal decrease in carnitine palmitoyltransferase 2 might be caused by hypermethylation. We constructed a network of SGMS1-AS1/microRNA-106a-5p/carnitine palmitoyltransferase 2 and verified their expression in cell lines and clinical specimens.
Conclusion
Our work revealed the possible mechanism of lactate accumulation in colon cancer and explored a new potential treatment for colon cancer by cutting off aerobic glycolysis in tumor cells.
Introduction
It is generally agreed that colon cancer is one of the most common cancers of the digestive system. It is the second leading cause of death in the United States after lung cancer, with a higher incidence than breast cancer, lung cancer, and prostate cancer.1,2 In China, colon cancer is one of the top 5 cancers and is one of the main causes of cancer-related deaths. 3 The details of colon carcinogenesis remain unclear, and it is crucial to understand the molecular mechanisms of colon carcinogenesis so that early diagnosis can be achieved and treatment can be conducted in time.
The energy requirements of our bodies are mainly derived from gluconeogenesis. Gluconeogenesis can be divided into 2 parts: aerobic glycolysis and anaerobic glycolysis. Under normal conditions, the body's gluconeogenesis is predominantly aerobic. However, when cellular metabolism is highly active, glycolysis is enhanced, and lactate is produced to provide more energy in a short period. In malignant tumors, to obtain more energy for proliferation, malignant cells tend to experience metabolic reprogramming.4,5 This metabolic change can support the survival of tumor cells and help them evade the surveillance of immunity. The Warburg effect is a form of metabolic reprogramming characterized by enhancing glucose uptake at a rate close to 100 mm/h, which is 10 to 100 times faster than the complete oxidation of glucose in the mitochondria, 6 and then converting the surplus carbon to lactate.
Lactate metabolism is associated with invasion, metastasis, drug resistance, and immune evasion of tumor cells. Antitumor immunity is strongly affected by lactate release. 7 Lactate can act as a signaling molecule secreted into the extracellular environment to regulate cellular interactions. 8 Studies of gastric and liver cancers have shown that lactate can promote tumor development by suppressing the body's antitumor immune response.9,10 Given the important role of lactate in tumorigenesis and the immunosuppressive tumor microenvironment (TME), targeting its metabolism may become an effective tool for cancer therapy in the future.
In this study, 47 upregulated and 35 downregulated differentially expressed genes (DEGs) related to lactate metabolism were detected in colon cancer using a bioinformatic approach. Low carnitine palmitoyltransferase 2 (CPT2) expression in colon cancer was significantly associated with an adverse prognosis and was identified as a key lactate metabolism–related gene (LMRG) in colon cancer. Low expression of CPT2 in colon cancer resulted in decreased infiltration of CD4+ T cells, CD8+ T cells, dendritic cells (DCs), and B cells but increased infiltration of cancer-associated fibroblasts (CAFs). Methylation analysis showed that high methylation levels in colon cancer patients were related to low CPT2 expression and a high methylation site cg01810926, which was positively correlated with a poor survival prognosis. In addition, the SGMS1-AS1/microRNA-106a-5p/CPT2 network was constructed, and the expression of these 3 genes was verified in cell lines and clinical specimens. In this study, we observed CPT2, a key oncogenic LMRG, and explored its possible expression mechanism in colon cancer to provide a new therapeutic target for reducing lactate in the microenvironment of colon cancer.
Materials and Methods
Data Sources and Preprocessing
The mRNA-seq data of COAD were downloaded from TCGA (https://portal.gdc.cancer.gov/) using the “TCGAbiolinks” package in R. 11 In addition, clinical information and methylation data were downloaded from the UCSC Xena platform (https://xenabrowser.net/datapages/), and no clear prognostic information was discarded. Subsequently, the samples (n = 469) were divided into a normal group (n = 39) and a tumor group (n = 430), and the details are shown in Table 1. A total of 282 LMRGs were downloaded from the Molecular Signatures Database (MSigDB; https://www.gsea-msigdb.org/gsea/msigdb/index.jsp). 12
Clinical and Pathological Characters of COAD Patients in TCGA Cohort.

Screening Differentially Expressed LMRGs
We performed data quality control to evaluate the separation between the tumor and normal groups. We screened DEGs of COAD using the “deseq2” package 13 in R with an adjusted P value <.05 and |log2foldchange| > 1. Then, the intersection of DEGs and 282 LMRGs was obtained by Venn diagrams.
Functional Enrichment, Interaction Network Analysis, and Hub Gene Identification
To investigate the biological pathways of lactate metabolism–associated DEGs, we used the clusterProfiler R package 14 to carry out Gene Ontology (GO) functional annotation and Kyoto Encyclopedia of Genes and Genomes (KEGG) enrichment analyses. Then, the PPI network was constructed using a search tool for retrieving the online database of interacting genes (https://string-db.org/). The confidence score was set to 0.40. Then, the PPI network was further analyzed using Cytoscape's "CytoHubba" plug-in to identify the hub genes. 15 We selected the intersection of the top 10 genes with MCC, EPC, DMNM, and DEGREE scores as hub genes for the following analysis.
Univariate and Multivariate Cox Regression Analyses
To investigate the prognostic value of DEGs in COAD patients, a univariate Cox analysis was performed with the survival package. Genes with a P value <.05 were considered candidate prognostic factors. Then, multivariate Cox regression analysis was implemented to identify independent prognostic indicators. In addition, we intersected these indicators with the hub genes and used GEPIA (http://gepia2.cancer-pku.cn/) to validate the overall survival (OS) prognosis.
Analysis of CPT2 Expression and Clinical–Pathologic Features
We used the TIMER dataset (https://cistrome.shinyapps.io/timer/) to explore CPT2 expression in 34 types of common human cancer. The Wilcoxon rank-sum test was used to analyze the expression difference of CPT2 in nonpaired samples (430 tumor samples and 39 adjacent samples) and paired samples (39 pairs). A total of 291 samples with complete clinical information were included to evaluate the relationships between the clinical–pathologic features and the expression of CPT2. 16 Then, we selected clinical features that were significantly different between the CPT2 high and low expression groups and combined them with the CPT2 expression for survival analysis.
Methylation and Expression Analysis of CPT2
We investigated the association between CPT2 gene expression and the methylation sites on the DNA sequences using MEXPRESS (https://mexpress.be) and matched the Illumina HumanMethylation450 microarray data with the transcriptome data to obtain 166 samples for subsequent analysis. Then, we validated the highly correlated methylation sites in the 166 samples and performed survival analysis.
Correlation Analysis of Immune Infiltration and MutationData Sources and Preprocessing
The IOBR package 13 was used for immunoinfiltration analysis. Five immune infiltration scores were evaluated by the deconvolution algorithm on 430 samples by CIBERSORT, TIMER, MCP counter, xCell, and EPIC, and we selected immune cells with abundance >0 in half of the samples (215 cases) for subsequent analysis. Subsequently, we explored the differences in immune cell infiltration among the CPT2 subgroups. In addition, immune checkpoint–related genes that were differentially expressed in the CPT2 subgroups were identified. Finally, we downloaded mutation-related data from cBioPortal (https://www.cbioportal.org/datasets). After matching these data with the transcriptome data, 138 samples were subjected to mutation analysis between groups, and we showed the top 20 genes with the highest mutation frequency in the groups.
Prediction of miRNA and lncRNA and Construction of ceRNA Correlation
The StarBase 17 and TarBase 18 databases were used to predict the CPT2-related upstream miRNAs. Because CPT2 has low expression in COAD, we artificially chose the miRNAs with different levels of expression in the normal and tumor groups and those with high expression in the tumor group in the StarBase database, and hsa-miR-124-3p was removed because there was no expression information. Then, long noncoding RNAs (lncRNAs) with lower expression in the tumor group were predicted based on the data of miRNAs from the StarBase database. The coexpression analysis of miRNA‒mRNA, miRNA‒lncRNA, and mRNA‒lncRNA pairs identified in our study was evaluated in COAD cohorts from the starBase database. Gene pairs with |r| > 0.1 and P value <.05 were considered potential pairs and were selected for further analysis.
Validation with qRT-PCR
We validated the expression of SGMS1-AS1, microRNA-106a-5p, and CPT2 in cell lines as well as in clinical specimens. The number of clinical specimens is 24 cases, detailed information is located in Supplemental Material Table S3. All human clinical specimens researches were reviewed and approved by the Medical Ethics Committee of Tianjin Medical University General Hospital (Tianjin, China, IRB2022-WZ-142, September 2022), and informed consent of all participants was obtained. There are no human subjects in this article and informed consent is not applicable. Quantitative real-time polymerase chain reaction (qRT-PCR) was used to detect the expression of the genes mentioned above. Colon cancer cell lines SW480 and RKO and the normal colonic epithelial cell line NCM460 were selected. Cell lines were cultured in RPMI medium (Gibco, Cat. 11875093) containing 10% fetal bovine serum (Corning, Cat. 35-081-CV). The clinical specimens and cell lines were fully lysed using TRIzol (Invitrogen, Cat. 15596026CN), and total RNA was extracted. The extracted RNA was reverse transcribed into cDNA using a cDNA reverse transcription kit (Vazyme, R323-01). Real-time polymerase chain reaction was used to evaluate the expression of the 3 genes with a Real Universal Color PreMix (SYBR Green) kit (Vazyme, Cat. Q711-03). The relative expression of the 3 genes was analyzed by the 2−ΔΔCt method. Primers for the 3 genes are displayed as follows:
CPT2
Forward primer (5′-3′)-AAAGAAGCAGCAATGGGCCAG
Reverse primer (5′-3′)-CCAGGTAGAGCTCAGGCAAG
MiR-106a-5p
Forward primer (5′-3′)-GATGCTCAAAAAGTGCTTACAGTGCA
Reverse primer (5′-3′)-TATGGTTGTTCTGCTCTCTGTCTC
SGMS1-AS1
Forward primer (5′-3′)-GGCTGTGTTTCTGCATACTCC
Reverse primer (5′-3′)-ACGACCCAGCATACATACTGA
Immunohistochemical Staining for CPT2
Carnitine palmitoyltransferase 2 in colon tissues was examined with a streptavidin–biotin peroxidase complex-based immunohistochemical technique. The colon tissues were fixed with 10% formalin, embedded in paraffin, and cut into 5-μm sections for staining. The colon sections were incubated with the primary antibodies: anti-CPT2 (1:1000, Affinity, DF7089). Under a light microscope, the numbers of CPT2-positive cells in 5 different fields (400×) in each section were counted.
Results
Data Collection
A flowchart of the entire analysis pipeline is shown in Figure 1. A total of 469 cases with transcriptome mRNA-seq count data were downloaded from the TCGA database for differential analysis, and the mRNA-seq count data were converted to TPM for subsequent analysis of their association with the phenotypic characterization. The clinical characteristics of the colon cancer cohort, including age, gender, clinical stage, TNM classification, and lymphatic invasion, are presented in Table 1.
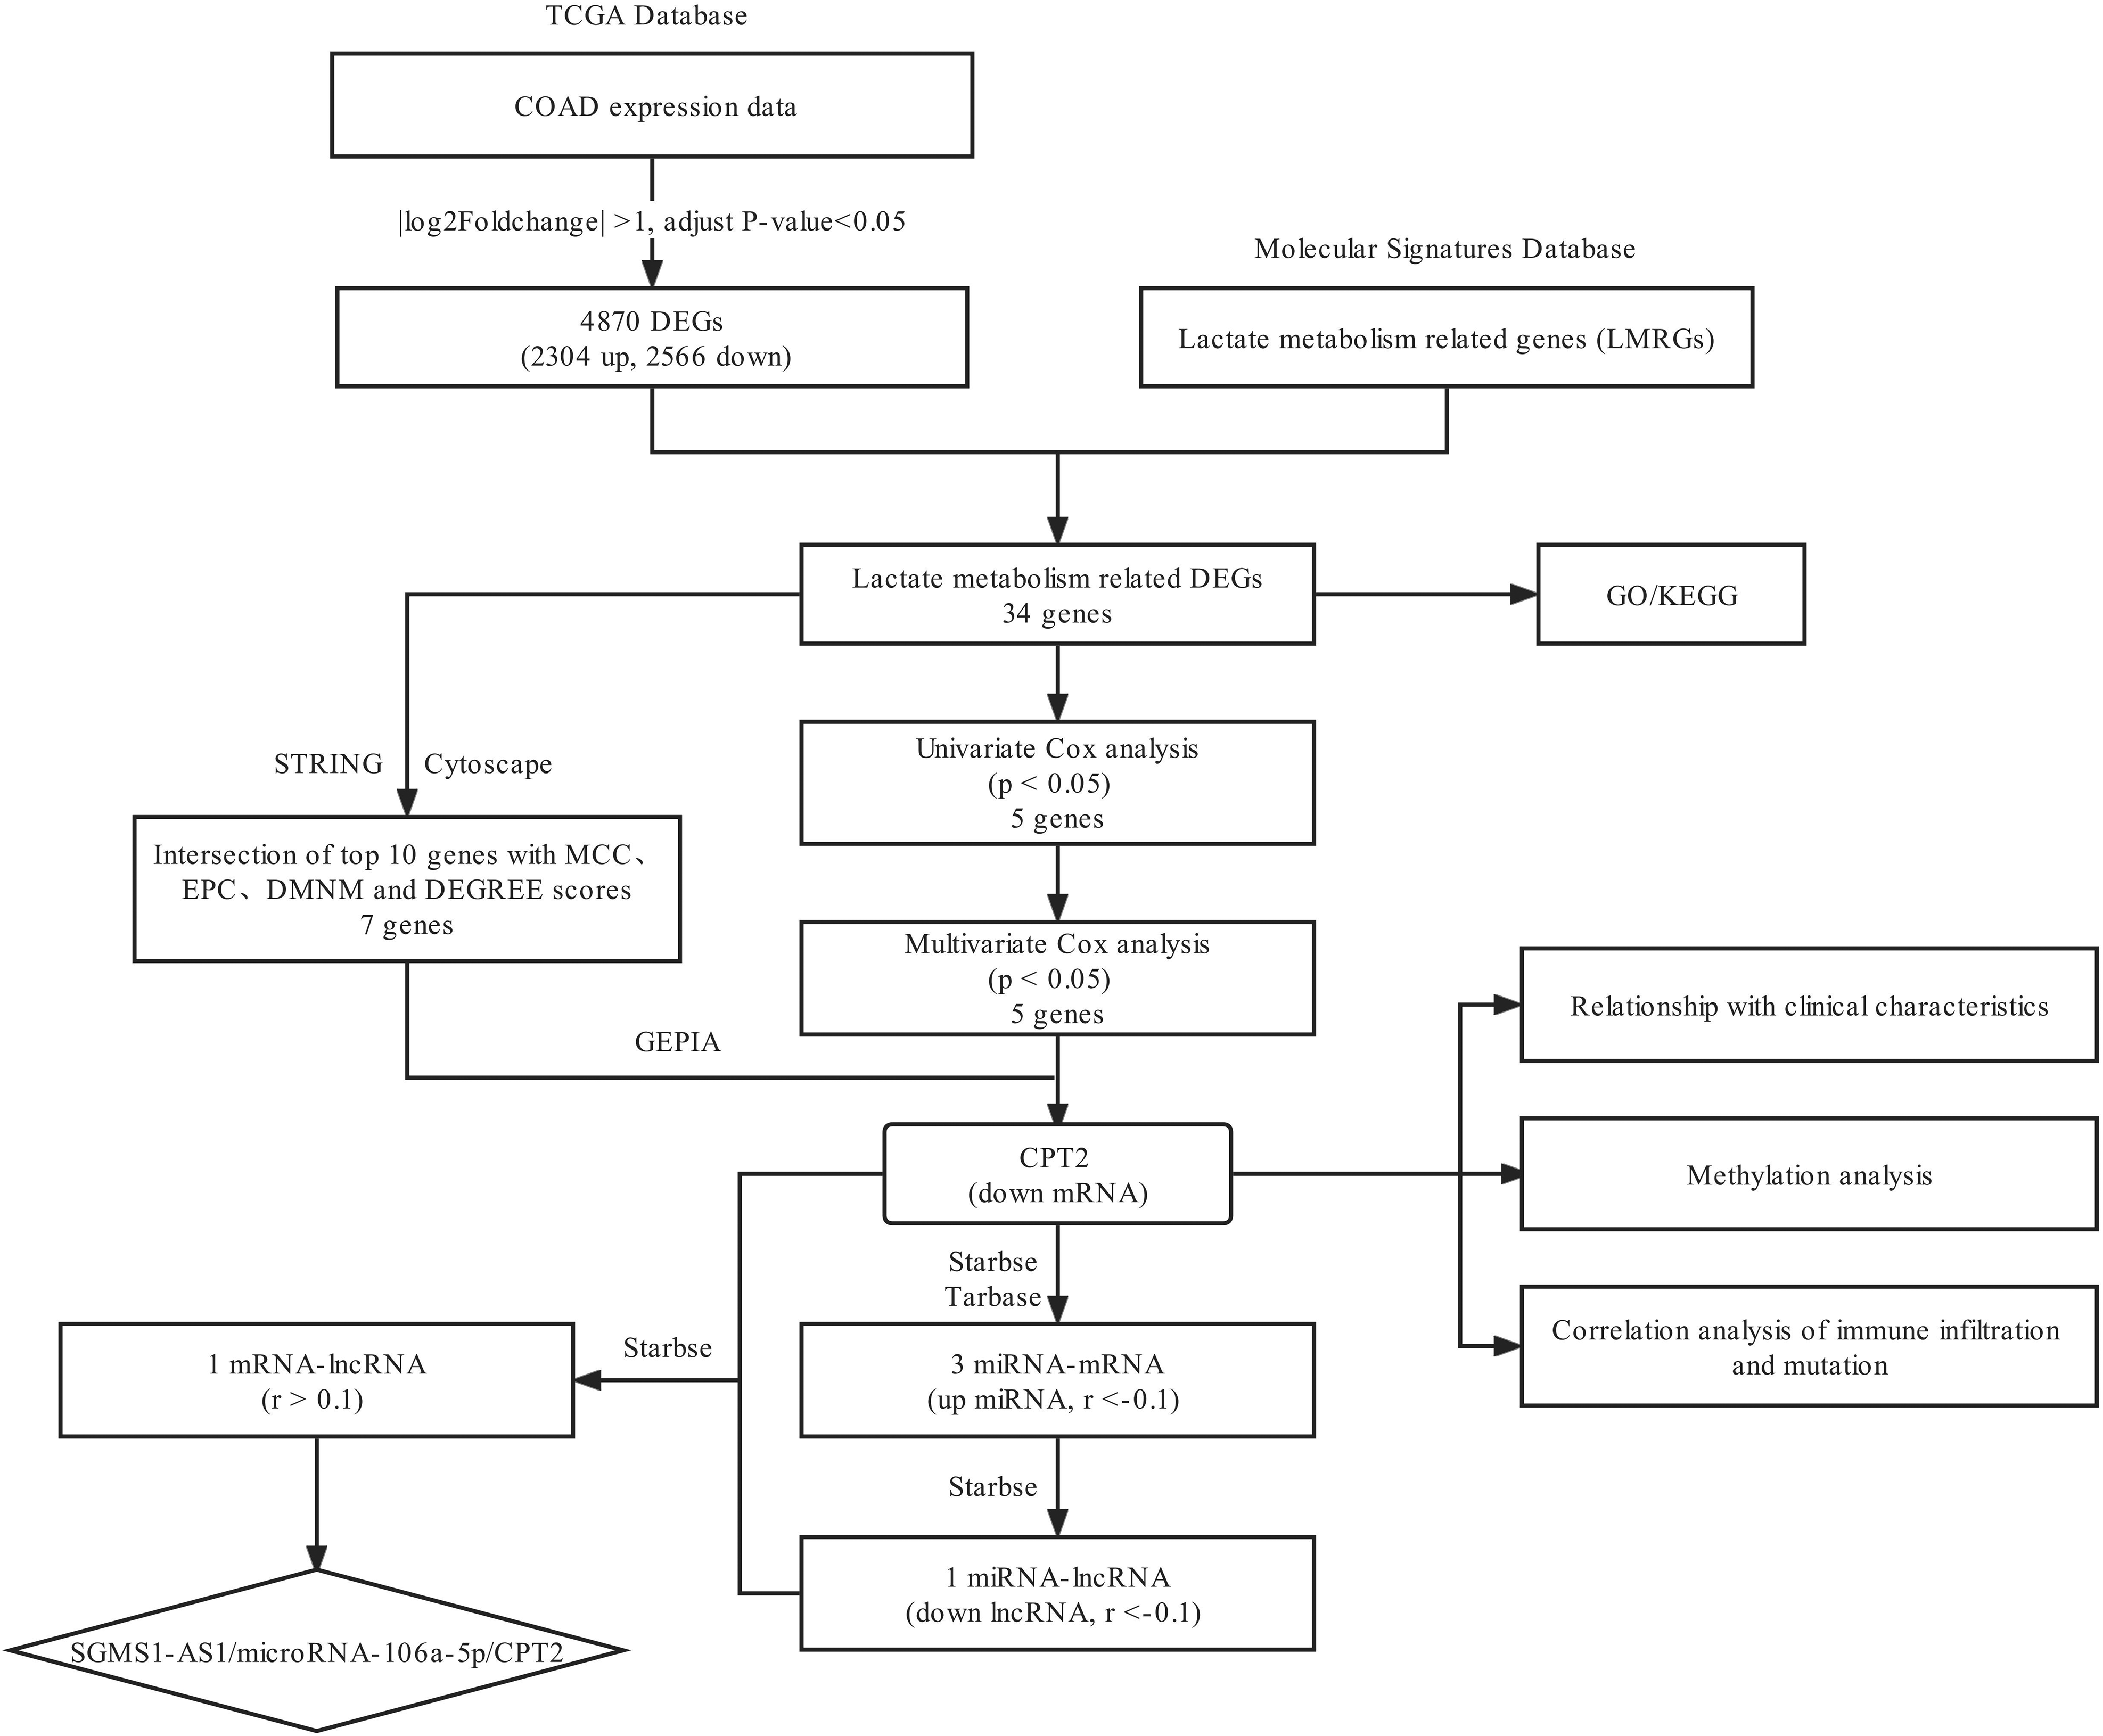
The flowchart of data analysis in this study.
Identification of Lactate Metabolism–Related DEGs
We used box plots and PCA to evaluate the separation between the tumor and normal groups (Supplemental Figure S1). We screened 2304 upregulated DEGs and 2566 downregulated DEGs between the COAD and normal groups, setting the parameters of |log2foldchange| > 1 and adjusted P value <.05, and the results are shown in the volcano plot (Figure 2A). Five priority LMRG sets, including 282 genes, were obtained from the MSigDB database. Taking the intersection of DEGs and LMRGs, 19 upregulated and 15 downregulated lactate metabolism–related DEGs were finally selected and used for the following analysis (Figure 2B). Subsequently, to explore the biological functions of these DEGs, we performed GO and KEGG pathway enrichment analyses using the clusterProfiler R package. The results of the GO and KEGG analyses showed that lactate metabolism–related DEGs were significantly enriched in terms related to the enrichment of metabolic pathways and metabolic diseases (Figure 2C). Gene Ontology analysis confirmed that these DEGs were associated with metabolic processes (Figure 2D).

Analysis of lactate metabolism–related DEGs. (A) The volcano plot of all DEGs between the tumor and normal samples. The blue dots represent downregulated genes, while the red dots represent upregulated genes. (B) The Venn diagram of the intersection between the DEGs and LMRGs. (C) KEGG pathway enrichment analysis of lactate metabolism–related DEGs. (D) GO analysis of lactate metabolism–related DEGs. LMRG, lactate metabolism–related gene; DEG, differentially expressed gene; GO, Gene Ontology; KEGG, Kyoto Encyclopedia of Genes and Genomes.
Determination of the Hub Genes and Survival Analysis
We used Cytoscape and the “string” plugin to construct the PPI network of lactate metabolism–related DEGs (Figure 3A). Then, 7 hub genes were screened by Cytoscape and the “CytoHubba” plugin in the intersection of the top 10 genes with the MCC, EPC, DMNM, and DEGREE scores (Figure 3B). To explore the prognostic value of the lactate metabolism–related DEGs, we performed univariate Cox regression analysis (Supplemental Table S1). A total of 5 genes (P < .05) were significantly related to OS status and were subjected to multivariate Cox regression analysis (Figure 3C). Carnitine palmitoyltransferase 2, LDHAL6A, MPC1, SLC19A1, and SPP1 were considered independent prognostic factors. CPT2 and SPP1 were selected by taking the intersection of the hub genes and the independent prognostic factors (Figure 3D). GEPIA is a website by which we verified the prognostic value of the above genes (Figure 3E, Supplemental Figure S2). Finally, we chose CPT2 for subsequent analysis.

Determination of hub genes and survival analysis. (A) PPI network of lactate metabolism–related DEGs. (B) Intersection of the top 10 genes with MCC, EPC, DMNM, and DEGREE scores as hub genes. (C) Multivariate Cox regression analysis found independent prognostic indicators. (D) The Venn diagram of the intersection between the independent prognostic factors and hub genes. (E) GEPIA verified the prognostic value of CPT2. *P < .05; **P < .01; ***P < .001. DEG, differentially expressed gene; CPT2, carnitine palmitoyltransferase 2.
Analysis of CPT2 Expression and Clinical–Pathologic Features
To evaluate the CPT2 expression effect in patients, we performed differential expression analysis of CPT2 in tumor and pancancerous tissues from the TIMER database (Figure 4A) and found significant changes in CPT2 expression in a variety of tumors (P < .05). Furthermore, the results of the Wilcoxon rank-sum test indicated that the expression of CPT2 in COAD was significantly lower than that in the normal samples (P < .001, Figure 4B). Similar results were observed in the pairing analysis between the normal tissues and COAD derived from the same patient (P < .001, Figure 4C). From the GEPIA database, we obtained the same result (P < .05, Supplemental Figure S3).

Analysis of CPT2 expression and clinical–pathologic features. (A) Differential expression analysis of CPT2 in tumor and pancancerous tissues from the TIMER database. (B) Differentiated expression of CPT2 in the normal and tumor samples. (C) Paired differentiation analysis for the expression of CPT2 in normal and tumor samples. (D) Evaluation of the relationships between clinical–pathologic features and the expression of CPT2. (E) Survival analysis between clinicopathological features and CPT2. *P < .05; **P < .01; ***P < .001. CPT2, carnitine palmitoyltransferase 2.
Furthermore, based on multiple clinical–pathologic features, we used the Wilcoxon rank-sum test to explore the CPT2 expression changes, finding that CPT2 had low expression in tumor tissues and was associated with adverse clinical features. We found that as the disease progressed, the expression level of CPT2 became significantly lower in the N stage (P < .05), M stage (P < .05), and advanced tumor pathologic stage (P < .05). In addition, lymphatic invasion was accompanied by a significant decrease in CPT2 expression (P < .01) (Figure 4D). Although there was no significant difference in the expression of CPT2 in the subgroup analysis in the T stage, it was found that the expression in T3 and T4 was generally lower than that in T1 and T2 (Supplemental Figure S4). These results indicated that low CPT2 expression was associated with poor clinical pathological features.
We then performed survival analysis of the clinical features associated with significant differences in CPT2 expression in the subgroup analysis. Among the survival groups, the subgroups with low CPT2 expression, concomitant lymph node metastasis (P < .0001), distal metastasis (P < .0001), increased tumor malignancy (P < .0001), and lymph node infiltration (P < .0001) had relatively shorter OS times and worse prognoses in each group (Figure 4E).
Correlation Analysis of Immune Infiltration and Mutants
As shown in the above analysis, patient outcomes between CPT2 subgroups were significantly different. To determine the reasons for this and to shed light on the use of immunotherapy, 5 methods were used to analyze the differences in the levels of immune infiltration between groups (Supplemental Figure S5). The results with statistical meanings were filtered and displayed (Figure 5A). In the low CPT2 expression group, the infiltration of CAFs was increased, while in the high CPT2 expression group, CD4+ T cells, CD8+ T cells, DCs, and B cells infiltration were significantly elevated.

Immune infiltration analysis and mutation landscape. (A) Heatmap of immune cell infiltration in the high CPT2 group and low CPT2 group. (B) Expression of immune checkpoint–related genes in the high CPT2 group and low CPT2 group. (C) Mutation landscape in the high CPT2 group. (D) Mutation landscape in the low CPT2 group. *P < .05; **P < .01; ***P < .001. CPT2, carnitine palmitoyltransferase 2.
Next, the genes associated with the immune checkpoint program were investigated. As shown in Figure 5B, BTLA, CD160, CD96, and IL10RB in the high CPT2 group had higher expression levels, so patients in the high CPT2 group might benefit more from immune checkpoint inhibitors. Subsequently, we separately analyzed the mutations in the top 20 mutated genes in the high and low CPT2 expression groups. The results showed that the mutation incidence of the top 20 mutated genes in the 2 groups was 98.44% and 100%. The most significantly mutated gene in both groups was APC, but the mutation rates of APC and TP53 in the low CPT2 expression group were higher than those in the high expression group (Figure 5C and D).
Relationship Between Methylation and Expression of CPT2
To further clarify the regulatory mechanism of CPT2 in COAD, we explored the relationship between the expression level of CPT2 and its methylation status. We found that the most significant methylation sites (cg01810926) in the DNA sequences of CPT2 were negatively associated with the CPT2 expression levels from MEXPRESS (P < .05, r = −0.288, Figure 6A). Consistent results were obtained in the Illumina Human Methylation 450 microarray (Figure 6B and C). Kaplan-Meier survival analysis based on methylation status showed that cg01810926 site hypermethylation was associated with poor survival in COAD (P = .016, Figure 6D).

Methylation analysis of CPT2. (A) The methylation site of the CPT2 DNA sequence associated with gene expression was visualized using MEXPRESS. (B) Differentiated expression of methylation sites (cg01810926) in the high CPT2 group and low CPT2 group. (C) Expression correlation between methylation sites (cg01810926) and CPT2. (D) Survival analysis of methylation sites (cg01810926) in CPT2 in COAD patients. *P < .05; **P < .01; ***P < .001. CPT2, carnitine palmitoyltransferase 2.
Prediction of miRNA and lncRNA and Construction of Competitive Endogenous RNA
We wanted to explore the regulatory network associated with CPT2 in COAD. Forty upstream miRNAs of CPT2 were predicted by StarBase and TarBase (Supplemental Table S2). At the same time, we found 3 inversely correlated miRNA‒mRNA pairs (Pearson r < −0.1, P < .05), including 3 higher-expressed miRNAs (hsa-miR-30a-5p, hsa-miR-30b-5p, and hsa-miR-106a-5p) in the tumor group (P < .05, Figure 7A). Next, we predicted the upstream potential lncRNAs of hsa-miR-30a-5p, hsa-miR-30b-5p, and hsa-miR-106a-5p through the StarBase database. LncRNA-miRNA regulatory networks, consisting of 170 lncRNA‒miRNA pairs, were constructed and visualized by Cytoscape (Figure 7B). Then, only one lncRNA (SGMS1-AS1) in these pairs with lower expression in the tumor group (P < .05) was selected, and the negatively correlated miRNA‒lncRNA pair in COAD was evaluated (Pearson r < −0.1, P < .05, Figure 7C). At the same time, the lncRNA (SGMS1-AS1) had a positive correlation with the corresponding mRNA (CPT2) (Pearson r > 0.1, P < .05, Figure 7D). Based on these findings, we constructed a new competitive endogenous RNA (ceRNA) network (SGMS1-AS1/microRNA-106a-5p/CPT2).
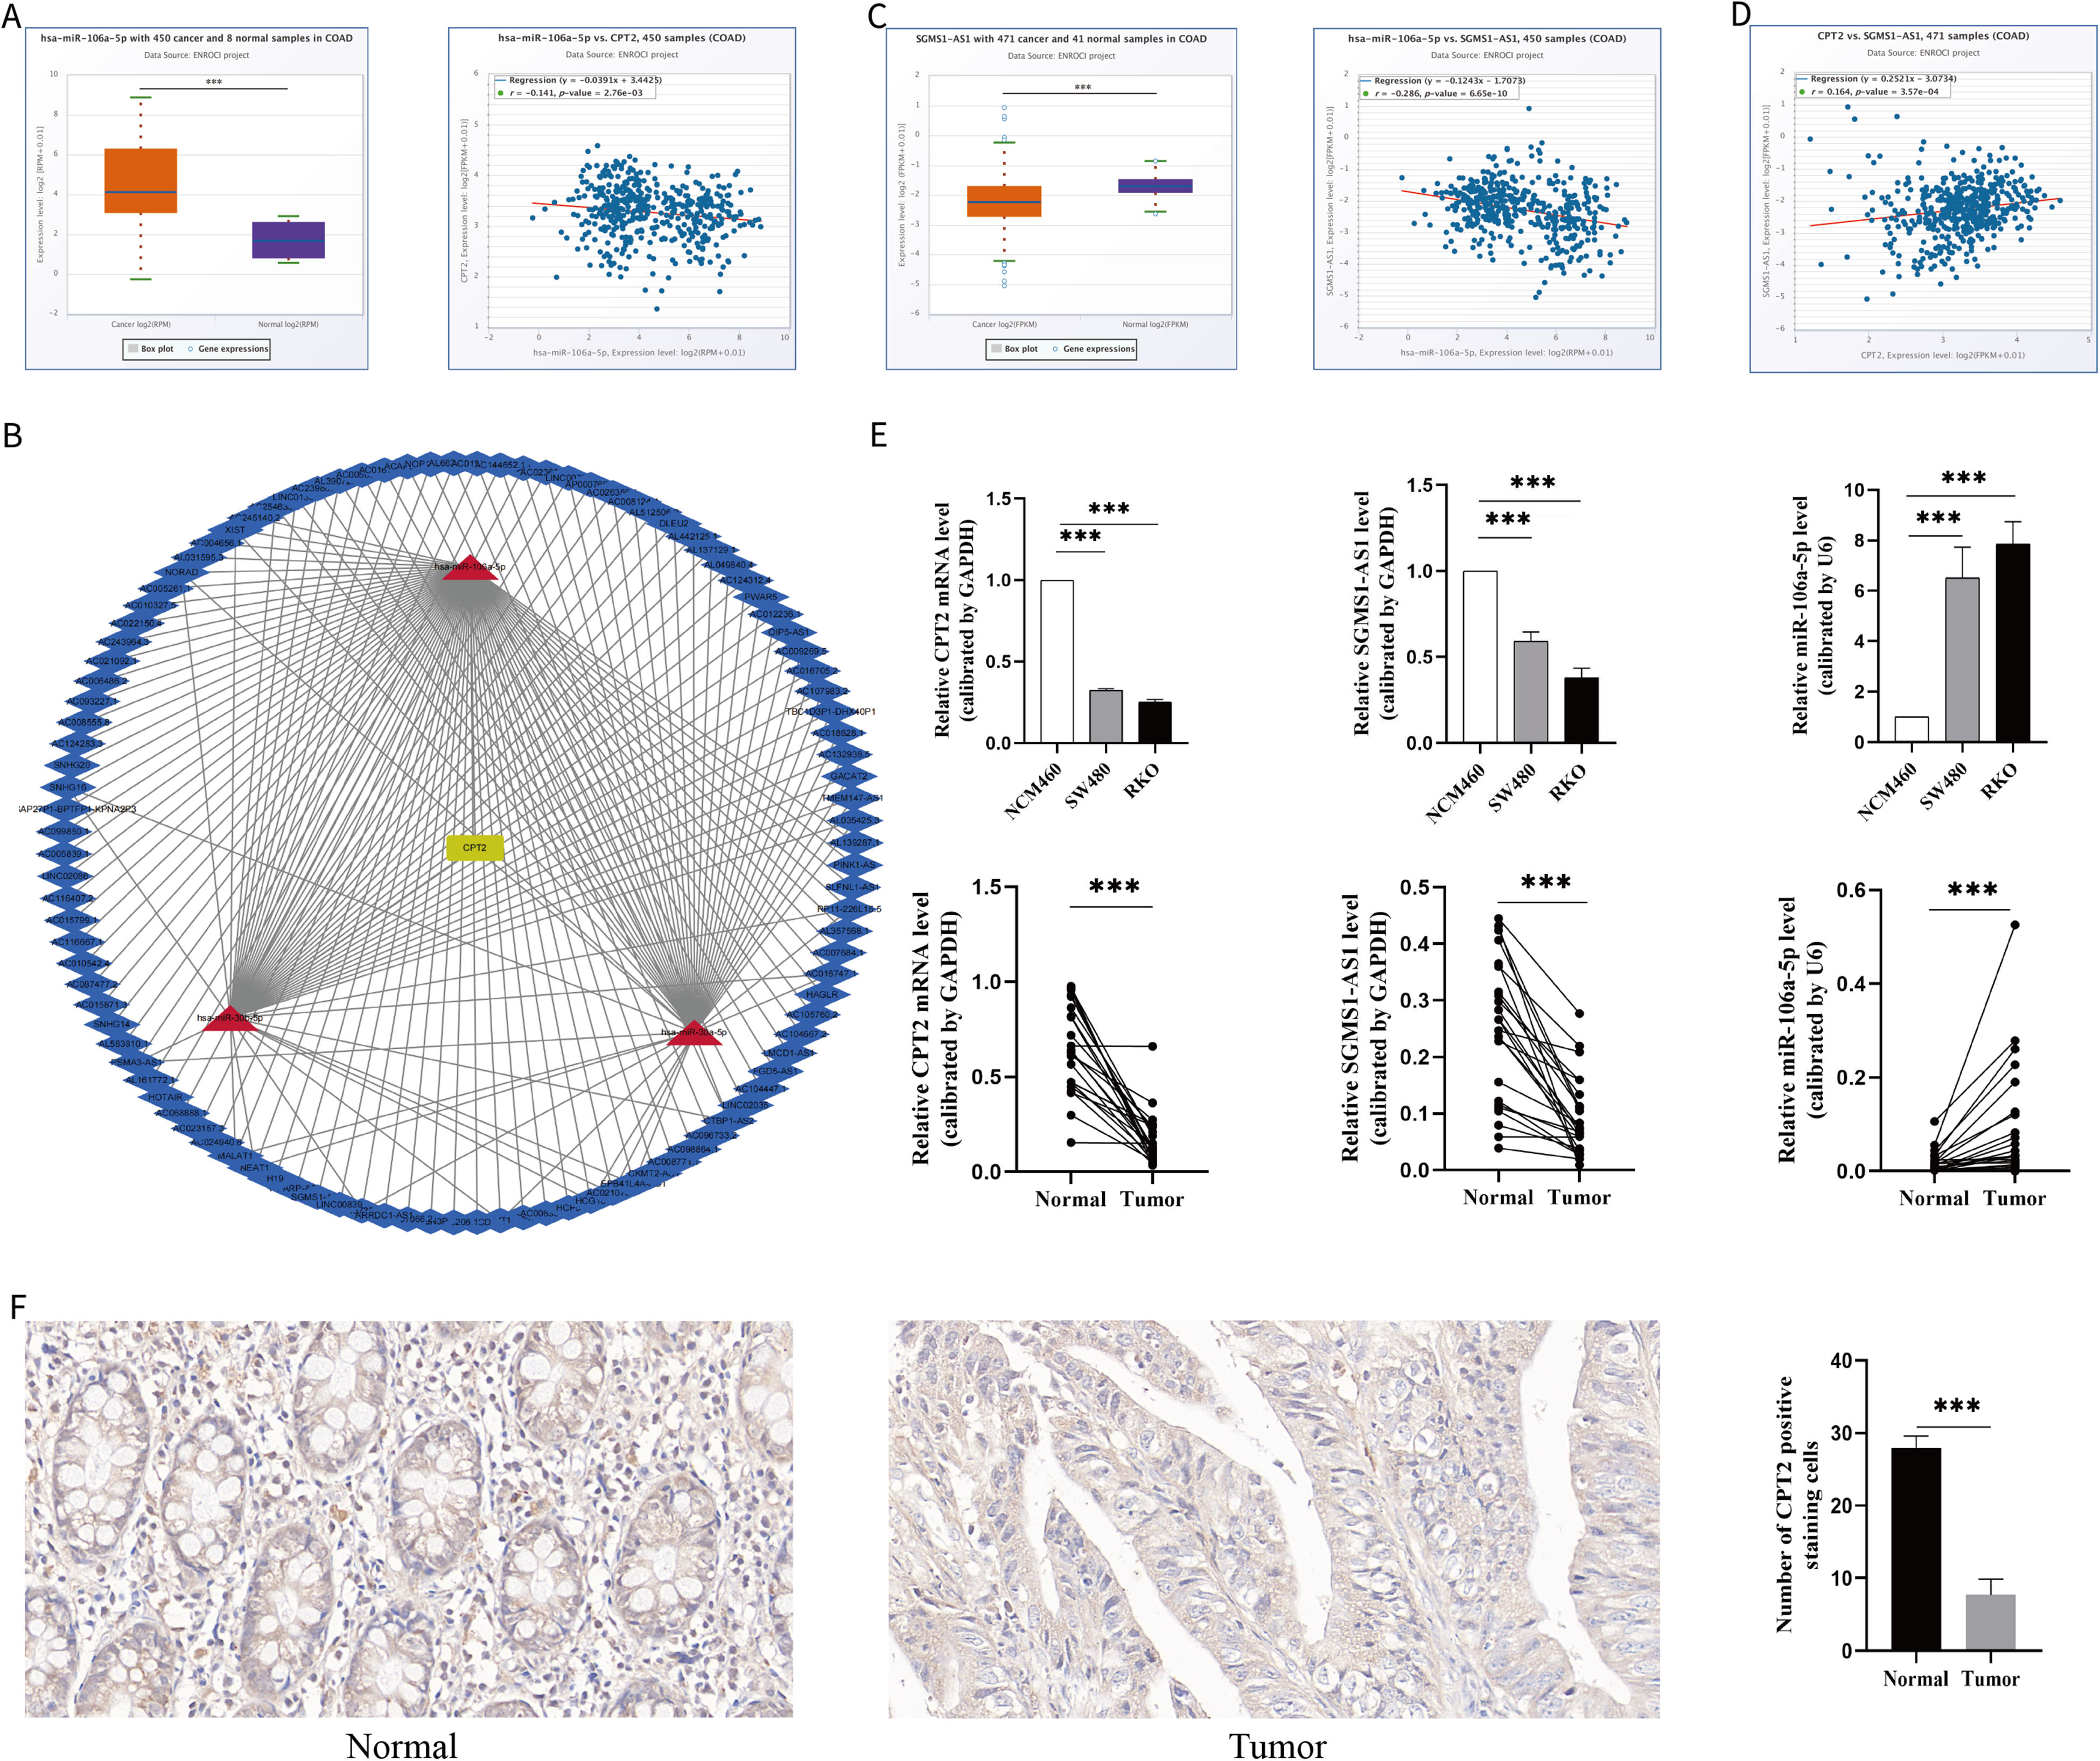
Prediction of miRNAs and lncRNAs and construction of ceRNAs. (A) Expression of miRNA (hsa-miR-106a-5p) between tumor and normal samples and analysis of the expression correlation between miRNA (hsa-miR-106a-5p) and mRNA (CPT2). (B) Interaction network of miRNAs and reverse-predict lncRNAs as well as mRNA (CPT2). (C) Expression of lncRNA (SGMS1-AS1) between tumor and normal samples and analysis of the expression correlation between lncRNA (SGMS1-AS1) and miRNA (hsa-miR-106a-5p). (D) Expression correlation between lncRNA (SGMS1-AS1) and mRNA (CPT2). (E) Expression of mRNA (CPT2), lncRNA (SGMS1-AS1), and miRNA (hsa-miR-106a-5p) in cell lines and tissues. The number of clinical specimens is 24 cases, and detailed information is located in Supplemental Material Table S3. (F) Representative infiltration of CPT2-positive cells in colon tissue (400×) and data showing CPT2-positive cells in colon tissue, n = 12. *P < .05; **P < .01; ***P < .001. CPT2, carnitine palmitoyltransferase 2; ceRNA, competitive endogenous RNA; LncRNA, long noncoding RNA.
To verify the results of the bioinformatics analysis, we performed qRT-PCR analysis in cell lines and tissues. As expected, the results showed that CPT2 and SGMS1-AS1 were remarkably downregulated in RKO and SW480 compared with normal colon epithelial cell lines (NCM460), while miR-106a-5p was highly expressed in RKO and SW480. In addition, we collected tumors as well as paracancerous tissues from 24 patients with colon cancer (Supplemental Table S3) to detect the expression of the above 3 genes. The results showed that CPT2 and SGMS1-AS1 were significantly downregulated in COAD and microRNA-106a-5p was significantly overexpressed in COAD compared with normal colon tissues (Figure 7E), and the immunochemical histological results also suggested that CPT2 expression was reduced in COAD (Figure 7F).
Discussion
Metabolic reprogramming refers to altered metabolic models driven by oncogenes to meet the demands of bioenergy, biosynthesis, and redox homeostasis, enhancing tumor cell adaptation. 19 Aerobic glycolysis occurs in colon cancer cells as a form of metabolic reprogramming. Glycolysis of tumor cells is significantly enhanced in the presence of sufficient oxygen, which gives cancer cells a growth advantage and leads to the accumulation of lactic acid in the TME. In this study, we screened LMRGs in colon cancer by bioinformatics methods and targeted CPT2 as a key LMRG in colon cancer.
Carnitine palmitoyltransferase 2 belongs to the carnitine palmitoyltransferase (CPT) system. This system consists of 2 distinct proteins, CPT1 and CPT2, which transport long-chain fatty acids from the cytosol to the mitochondrial matrix. Carnitine palmitoyltransferase 2 is the enzyme that limits the transport speed of mitochondrial fatty acids, plays a key role in controlling the oxidation of fatty acids, and is essential for the actual oxidation of fatty acids. 20 Recent studies have shown that CPT2 upregulation reduces glucose uptake and lactate release by colon cancer cells and decreases the levels of glucose transporters and metabolic enzymes, suggesting that CPT2 inhibits colon cancer cells. 21
In this study, we found that the expression of CPT2 was decreased in tumor tissues of colon cancer patients, and the expression of CPT2 was significantly changed in a variety of tumors, including cholangiocarcinoma, rectal adenocarcinoma, squamous lung cancer, and hepatocellular carcinoma, and increased in breast invasive carcinoma, prostate cancer, and endometrial cancer. This suggests a potential role for CPT2 in the development of many tumors. In fact, several studies have suggested that decreased CPT2 can promote the growth of hepatocellular carcinoma cells22,23 as well as rectal cancer cells 24 and mediate oxaliplatin resistance in rectal cancer, 21 thus identifying CPT2 as an important potential therapeutic target.
We found that in colon cancer the expression of CPT2 further decreased as the patients’ clinical disease progressed. In addition, low expression of CPT2 results in reduced infiltration of cells, such as CD4+ T cells, CD8+ T cells, DCs, and B cells, creating an inhibitory TME, while tumor-associated fibroblast infiltration increases, which could promote tumor cell proliferation and metastasis. Meanwhile, low expression of CPT2 is accompanied by high mutation rates of the oncogenes TP53 and APC, both of which may lead to gene inactivation and loss of oncogene suppressor function. Considering the oncogenic effect of CPT2, it is particularly important to study the mechanism of its decreased expression in colon cancer.
Epigenetics is usually defined as genome-related functional alterations that do not imply changes in nucleotide sequences, and DNA methylation is a type of epigenetic modification. Methylation analysis showed that the CPT2 sequence possesses an important methylation site, cg01810926, that is negatively correlated with the CPT2 expression level, and its modification level is significantly higher in colon cancer patients with low CPT2 expression. High methylation at the cg01810926 site is associated with low survival rates of COAD. Thus, methylation might be the mechanism leading to reduced CPT2 expression in colon cancer.
To explore other possible mechanisms for the reduced CPT2 expression in colon cancer, microRNAs (miRNAs/miRs) targeting CPT2 and its ceRNA were predicted in this study. Competitive endogenous RNA networks are associated with the progression and metastasis of several cancers, including colon cancer.25–30
MicroRNAs are a class of small, noncoding, single-stranded RNAs consisting of approximately 18 to 25 nucleotides. 31 They regulate the translation of protein-coding genes at the posttranscriptional level by binding to complementary sequences in the 3-untranslated regions of target mRNAs, 32 leading to inhibition of translation or degradation of mRNA.33,34 Competitive endogenous RNA has miRNA target sites and competitively binds to miRNAs, thereby indirectly regulating the expression of miRNA target genes. 35 This competitive miRNA binding effect is also called the miRNA sponge effect. Among them, lncRNAs can act as miRNA sponges to regulate the expression of target genes.36,37 Long noncoding RNAs are noncoding RNAs 38 that are expressed in most cells39,40 and play a critical role as transcription factors to regulate a variety of biological processes.41–43
By bioinformatics methods, a microRNA-106a-5p/SGMS1-AS1/CPT2 ceRNA network was constructed in this study. MicroRNA-106a-5p, a member of the microRNA-17 family, has been reported to be aberrantly regulated in many types of tumors. 44 SGMS1-AS1 is a newly identified lncRNA transcribed in 25 tissues, including the testis and thyroid. 45 In this study, based on bioinformatic analysis, we found that the expression of microRNA-106a-5p was negatively correlated with the expression of CPT2 and SGMS1-AS1, while the expression of SGMS1-AS1 was positively associated with the expression of CPT2 in colon cancer. In addition, RT-PCR results showed that in both cell lines and clinical specimens, the expression of CPT2 and SGMS1-AS1 was decreased in tumor cell lines and tumor tissues compared with normal colon epithelial cell lines or paraneoplastic tissues, but the expression of microRNA-106a-5p was significantly increased, and the expression level of CPT2 protein was also decreased in colon cancer tissues. Therefore, we suggest that the inhibitory effect of microRNA-106a-5p will be diminished when SGMS1-AS1 expression is reduced in colon cancer cells, resulting in an increase in microRNA-106a-5p expression levels. High levels of microRNA-106a-5p lead to a decrease in the mRNA levels of CPT2. The decrease in CPT2 expression enhances the uptake of glucose by colon cancer cells, resulting in enhanced aerobic glycolysis and increased lactate release. Cellular uptake of glucose results in enhanced aerobic glycolysis and increased lactate release, and the accumulation of lactate in the microenvironment contributes to the formation of an immunosuppressive TME, which ultimately promotes the development of colon cancer.
The ceRNA network constructed in this paper can regulate lactate metabolism in colon cancer, and we hypothesize that reversing the reduced CPT2 expression in colon cancer by regulating this network may provide a new target for improving the metabolic reprogramming of colon cancer and thus treating colon cancer. To clarify the effect of this ceRNA network in regulating lactate metabolism of CPT2 in colon cancer, more experiments and clinical specimens are necessary, which will be the main research direction. In addition, to find feasible therapeutic means through the regulation of this ceRNA network is also the focus of subsequent research. Based on the significant differential expression of CPT2 in various tumors, this study will continue to investigate the possible mechanisms of differential CPT2 expression in other tumors to better understand the important role of lactate metabolism in tumor development.
Conclusion
In this study, we analyzed LMRGs in colon cancer and explored possible mechanisms of lactate accumulation in colon cancer. We identified CPT2, a key gene that inhibits aerobic glycolysis and thus reduces lactate release in colon cancer and successfully constructed a ceRNA network consisting of the SGMS1-AS1/microRNA-106a-5p/CPT2 axis. However, this study also has the limitation that it did not regulate multiple key nodes of this ceRNA network. This will be the focus of our follow-up work to determine whether colon cancer can be treated by regulating aerobic glycolysis in tumor cells, which will ultimately provide valuable clues and guidance for basic and clinical research as well as future diagnosis and treatment of colon cancer.
Supplemental Material
sj-docx-1-tct-10.1177_15330338231212071 - Supplemental material for SGMS1-AS1/MicroRNA-106a-5p/CPT2 Axis as a Novel Target for Regulating Lactate Metabolism in Colon Cancer
Supplemental material, sj-docx-1-tct-10.1177_15330338231212071 for SGMS1-AS1/MicroRNA-106a-5p/CPT2 Axis as a Novel Target for Regulating Lactate Metabolism in Colon Cancer by Yan Ruochen, Ji Wenbin, Gao Chao, Yuan Yuhua and Qi Feng in Technology in Cancer Research & Treatment
Footnotes
Author Contributions
Ruochen Yan: Conceptualization, Methodology, Software, Investigation, Writing – review & editing. Wenbin Ji: Methodology, Investigation, Writing – review & editing. Chao Gao: Collection specimens. Feng Qi and Yuhua Yuan: Funding acquisition. All authors discussed results and commented on the manuscript.
Authors’ Note
All human clinical specimens researches were reviewed and approved by the Medical Ethics Committee of Tianjin Medical University General Hospital (Tianjin, China, IRB2022-WZ-142, September 2022), and informed consent of all participants was obtained. There are no human subjects in this article and informed consent is not applicable. Publicly available datasets were analyzed in this study. This data can be found here: https://portal.gdc.cancer.gov/, https://xenabrowser.net/datapages/, https://![]() . The data and r codes of this article have been uploaded to https://github.com/YanRuochen1/000.git.
. The data and r codes of this article have been uploaded to https://github.com/YanRuochen1/000.git.
Declaration of Conflicting Interests
The author(s) declared no potential conflicts of interest with respect to the research, authorship, and/or publication of this article.
Funding
The author(s) disclosed receipt of the following financial support for the research, authorship, and/or publication of this article: This work was supported by The National Natural Science Foundation of China (grant number 82 170 399). This work was also supported by the Tianjin Research Innovation Project for Postgraduate Students (2021YJSS167).
Supplemental Material
Supplemental material for this article is available online.
Abbreviations
References
Supplementary Material
Please find the following supplemental material available below.
For Open Access articles published under a Creative Commons License, all supplemental material carries the same license as the article it is associated with.
For non-Open Access articles published, all supplemental material carries a non-exclusive license, and permission requests for re-use of supplemental material or any part of supplemental material shall be sent directly to the copyright owner as specified in the copyright notice associated with the article.