
Abstract
Introduction
Lung cancer is one of the most common types of cancer and is currently the leading cause of cancer deaths worldwide, with approximately 2.2 million new cancer cases and 1.8 million deaths recorded in 2020. 1 At present, surgery and radiotherapy are the primary treatment modalities for lung cancer. The emergence of immune checkpoint inhibitors (ICIs), which mainly includes anti-programmed cell death ligand 1 (PD-1)/PD-L1 inhibitors and anti-cytotoxic T lymphocyte-associated antigen-4 (CTLA-4) monoclonal antibodies, has markedly advanced cancer treatment and resulted in a paradigm shift in lung cancer. 2 Further, several clinical trials are also ongoing to further investigate the role of ICIs as neoadjuvant or adjuvant therapy in patients with lung cancer. 3
Some studies on non-small cell lung cancer (NSCLC) have shown that chemotherapy can alter the expression of immune checkpoint ligands (ICLs) in tumor cells. For example, platinum drugs,4–7 pemetrexed, 8 and gemcitabine 9 can induce the increase of PD-L1 expression in NSCLC tumor cells. Moreover, PD-1/PD-L1 inhibitors can counteract the immunosuppressive effect of these chemotherapy agents. The expression of high-mobility group box protein 1 (HMGB1), a ligand for T-cell immunoglobulin and mucin domain-containing protein-3 (TIM-3), is also affected by cisplatin.10,11 In addition, cisplatin also upregulates the expression of galectin-3, a ligand of lymphocyte activation gene-3 (LAG-3). 12 Overall, these findings provide a theoretical basis for the subsequent choice of chemotherapy agents in combination with immune checkpoint (ICP) blockade. However, most studies were on lung adenocarcinoma, and there had been few studies on squamous cell carcinoma and large cell carcinoma. Additionally, most studies are limited to the PD-L1 checkpoint.
Thus, the purpose of this study was to ascertain the impact of various chemotherapeutic drugs on ICP expression in NSCLC. Toward this goal, we selected six commonly used clinical chemotherapeutic agents (ie, cisplatin, carboplatin, paclitaxel, gemcitabine, vinorelbine, and pemetrexed) to treat different NSCLC cell lines with different pathological subtype, namely, H1703 (lung squamous cell carcinoma), A549 (lung adenocarcinoma), and H460 (large cell carcinoma). Subsequently, the expression of PD-1 ligand (PD-L1, programmed cell death ligand 2 [PD-L2]), TIM-3 ligand (galectin-9, HMGB1), LAG-3 ligand (major histocompatibility complex-II [MHC-II], galectin-3, α-synuclein, fibrinogen-like protein 1 [FGL1]), and T-cell immunoreceptor with Ig and ITIM domains (TIGIT) ligand (CD155 and CD112) was measured using flow cytometry. Concurrently, MHC-I expression after treatment with different chemotherapy agents was also detected.
Materials and Methods
Antibodies and Additional Reagents
The following antibodies were used for flow cytometry analysis: anti-human PD-L1 antibody- PerCP/Cyanine5.5 (29E.2A3, 1:20 dilution; BioLegend; San Diego, CA, USA), anti-human PD-L2 antibody-allophycocyanin (APC)/cyanine 7 (MIH18, 1:20 dilution; BioLegend), anti-human MHC-I antibody-APC (A17082A, 1:20 dilution; BioLegend), anti-human MHC-II antibody-PE (LN3, 1:20 dilution; BioLegend), anti-human galectin-9 antibody-PE (9M1-3, 1:20 dilution; BioLegend), anti-mouse/human galectin-3 antibody-APC (M3/38, 1:120 dilution; BioLegend), anti-human CD155 antibody-PerCP/Cyanine5.5 (SKII.4, 1:20 dilution; BioLegend), anti-human CD112 antibody-PE (TX31, 1:20 dilution; BioLegend), anti-human α-synuclein antibody (MJFR1, 1:200 dilution; Abcam; Cambridge, MA, USA), anti-human FGL1 antibody (EPR24018-27, 1:100 dilution; Abcam), anti-human HMGB1 antibody (1E6-E10, 1:100 dilution; Abcam), goat anti-rabbit IgG-FITC (1:200 dilution; Beyotime; Shanghai, China), and rat anti-mouse IgG-FITC (RMG1-1, 1:20 dilution; BioLegend). The Zombie NIR Fixable Viability kit (1:200 dilution; BioLegend) was used to exclude dead cells. The FoxP3 staining buffer set (eBioscience; San Diego, CA, USA) was used for intracellular staining. The Cell Counting Kit-8 (CCK-8; C0043, Beyotime) was used to measure cell growth. All chemotherapeutic drugs (cisplatin [S1166], carboplatin [S1215], paclitaxel [S1150], gemcitabine [S1714], vinorelbine [S4269], and pemetrexed [S5971]) were purchased from Selleck Chemicals (Houston, TX, USA).
Cells and Culture Conditions
H1703 (human lung squamous cell carcinoma cell line), A549 (human lung adenocarcinoma cell line), and H460 (human large cell lung cancer cell line) were obtained from the American Type Culture Collection (ATCC, USA). The cells were cultured in RPMI-1640 (Cat. L220KJ; Basal Media, Shanghai, China) media containing 10% fetal bovine serum (Cat. F801-500; Biocode Biotechnology, Zhejiang, China), 100 units/mL of penicillin, and 100 µg/mL of streptomycin. The culture conditions were 5% CO2 at 37 °C in a humidified incubator.
Cell Viability Assays
Cells were seeded in a complete growth medium at a density of 2000–5000 cells per well in 96-well tissue culture plates and cultured for 24 hours. Then, the cells were cultured under different concentrations of chemotherapeutics (0, 0.01, 0.1, 0.5, 1, 5, and 10 µmol/L). After 72 hours, 10 µL CCK-8 (CT0043, Beyotime Biotechnology, Shanghai, China) solution was added to each well (100 µL medium). The incubation was continued for 2 hours at 37 °C and 5% CO2, and absorbance was measured in a 450-nm microplate reader (BioTek, VT, USA). GraphPad Prism V8.0 was used to determine the medicines’ 50% inhibitory concentrations (IC50).
Flow Cytometry Analysis
The cells were seeded in 10-cm dishes for 24 hours and then exposed to different concentrations (0, 1/4 IC50, 1/2 IC50, and IC50) of chemotherapeutic agents for 72 hours. They were then thoroughly washed thrice with phosphate-buffered saline to remove extracellular drugs, digested with pancreatin (Cat. S310JV; Basal Media, Shanghai, China), and counted. One million cells per sample were collected into flow cytometry tubes for staining. Cells were first stained for live cells (Zombie NIR Fixable Viability kit, BioLegend) and for surface staining with antibodies (PD-L1, PD-L2, MHC-I, MHC-II, galectin-3, CD155, and CD112) for 20 minutes at 4 °C in the dark. Cells were fixed and permeabilized using the FoxP3 staining buffer set (eBioscience) and then stained with intracellular antibodies (galectin-9, α-synuclein, FGL1, and HMGB1) for 30 minutes at 4 °C. Cells were washed and resuspended in the permeabilization buffer throughout. For indirect labeling, samples were first stained with diluted primary antibody solution (α-synuclein, FGL1, and HMGB1) and then incubated with secondary antibodies. Flow cytometry analysis was performed using a BD FACSCanto II (BD Biosciences), and data were analyzed using FlowJo V10 software.
Statistical Analysis
At least three times each of the experiments were repeated. Information was presented as the mean and standard deviation (SD). Statistical significance was determined using a one-way analysis of variance test. All statistical analyses were performed using GraphPad Prism V8.0 software, and P < .05 was considered statistically significant.
Ethical Statement
This study was approved by the Medical Ethics Committee of Tianjin Cancer Hospital (Ethics Number: EK2020214).
Result
Expression of ICLs and MHC-I in Untreated NSCLC Cell Lines
The expressions of PD-L1, galectin-9, galectin-3, α-synuclein, and FGL1 were significantly different among the different NSCLC cell lines. As shown in Table 1, PD-L1 expressions in H1703 and A549 were 44.8% and 7.45%, respectively, similar to the results of two previous retrospective studies.13,14 In these two studies, immunohistochemical staining of surgically resected lung cancer samples revealed that PD-L1 expression was higher in lung squamous cell carcinoma than in adenocarcinoma (72.3% vs 36.9% and 34.3% vs 4.1%). Compared with PD-L1 expression, PD-L2 expression was lower, and PD-L2 expression was positive in 4.40%, 3.06%, and 1.25% of H1703, A549, and H460 cell lines, respectively. Larsen et al 15 analyzed the expressions of PD-L1- and PD-L2-related genes in NSCLC through the CCLE data set and found that PD-L2 mRNA expression was usually two to four times lower than PD-L1 mRNA expression. Consistent results were obtained in the current study.
Percentage of cells with positive expression of molecular biomarkers in NSCLC cell lines (X ± S).

Abbreviations: FGL1, fibrinogen-like protein 1; HMGB1, high-mobility group box protein 1; MHC-I, major histocompatibility complex-I; MHC-II, major histocompatibility complex-II; PD-L1, programmed cell death ligand 1; PD-L2, programmed cell death ligand 2.
In addition, galectin-9 and FGL1 expressions were high in A549 (67.9% and 34.6%, respectively). In addition, HMGB1 expression was also high in all three cell lines, regardless of histological subtype (squamous cell carcinoma, adenocarcinoma, or large cell carcinoma), consistent with a previous report. 16 Galectin-3 showed the highest expression in H460 (mean: 81.4%). α-Synuclein expression was high in A549 and H460 at 75.2% and 79.5%, respectively, and these rates were higher than those in H1703 (mean: 45.9%). Meanwhile, MHC-II expression was low in all three cell lines, with the average of 1.25% to 5.61%. CD155, CD112, and MHC-I had high expression levels in these cell lines, with the average expression level above 75%.
Effects of Cisplatin on ICP Molecules in the Three Cell Lines
The 72-hour IC50 values of cisplatin, carboplatin, paclitaxel, gemcitabine, vinorelbine, and pemetrexed are shown in Table 2. For the effect of chemotherapy agents on ICL expression, in H1703, cisplatin significantly upregulated the expressions of PD-L2 (at 1/2 IC50 and IC50), MHC-II (at 1/4 IC50, 1/2 IC50, and IC50), MHC-I (at 1/2 IC50 and IC50) and significantly downregulated the expressions of PD-L1 (at 1/2 IC50 and IC50), galectin-9 (at IC50), galectin-3 (at 1/4 IC50 and IC50), α-synuclein (at 1/2 IC50 and IC50), FGL1 (at 1/2 IC50 and IC50), and CD112 (at 1/4 IC50, 1/2 IC50, and IC50) (Figure 1A). Under IC50 concentration, PD-L2, expressions were significantly increased to 33.9% higher, from baseline. In contrast, cisplatin had comparable effects on galectin-3 and FGL1 (downregulated to 46.1% and 45.3%, respectively). Meanwhile, after cisplatin treatment, PD-L1 and galectin-9 expressions decreased by 25.5% and 31.3%, respectively (Figure 1A).
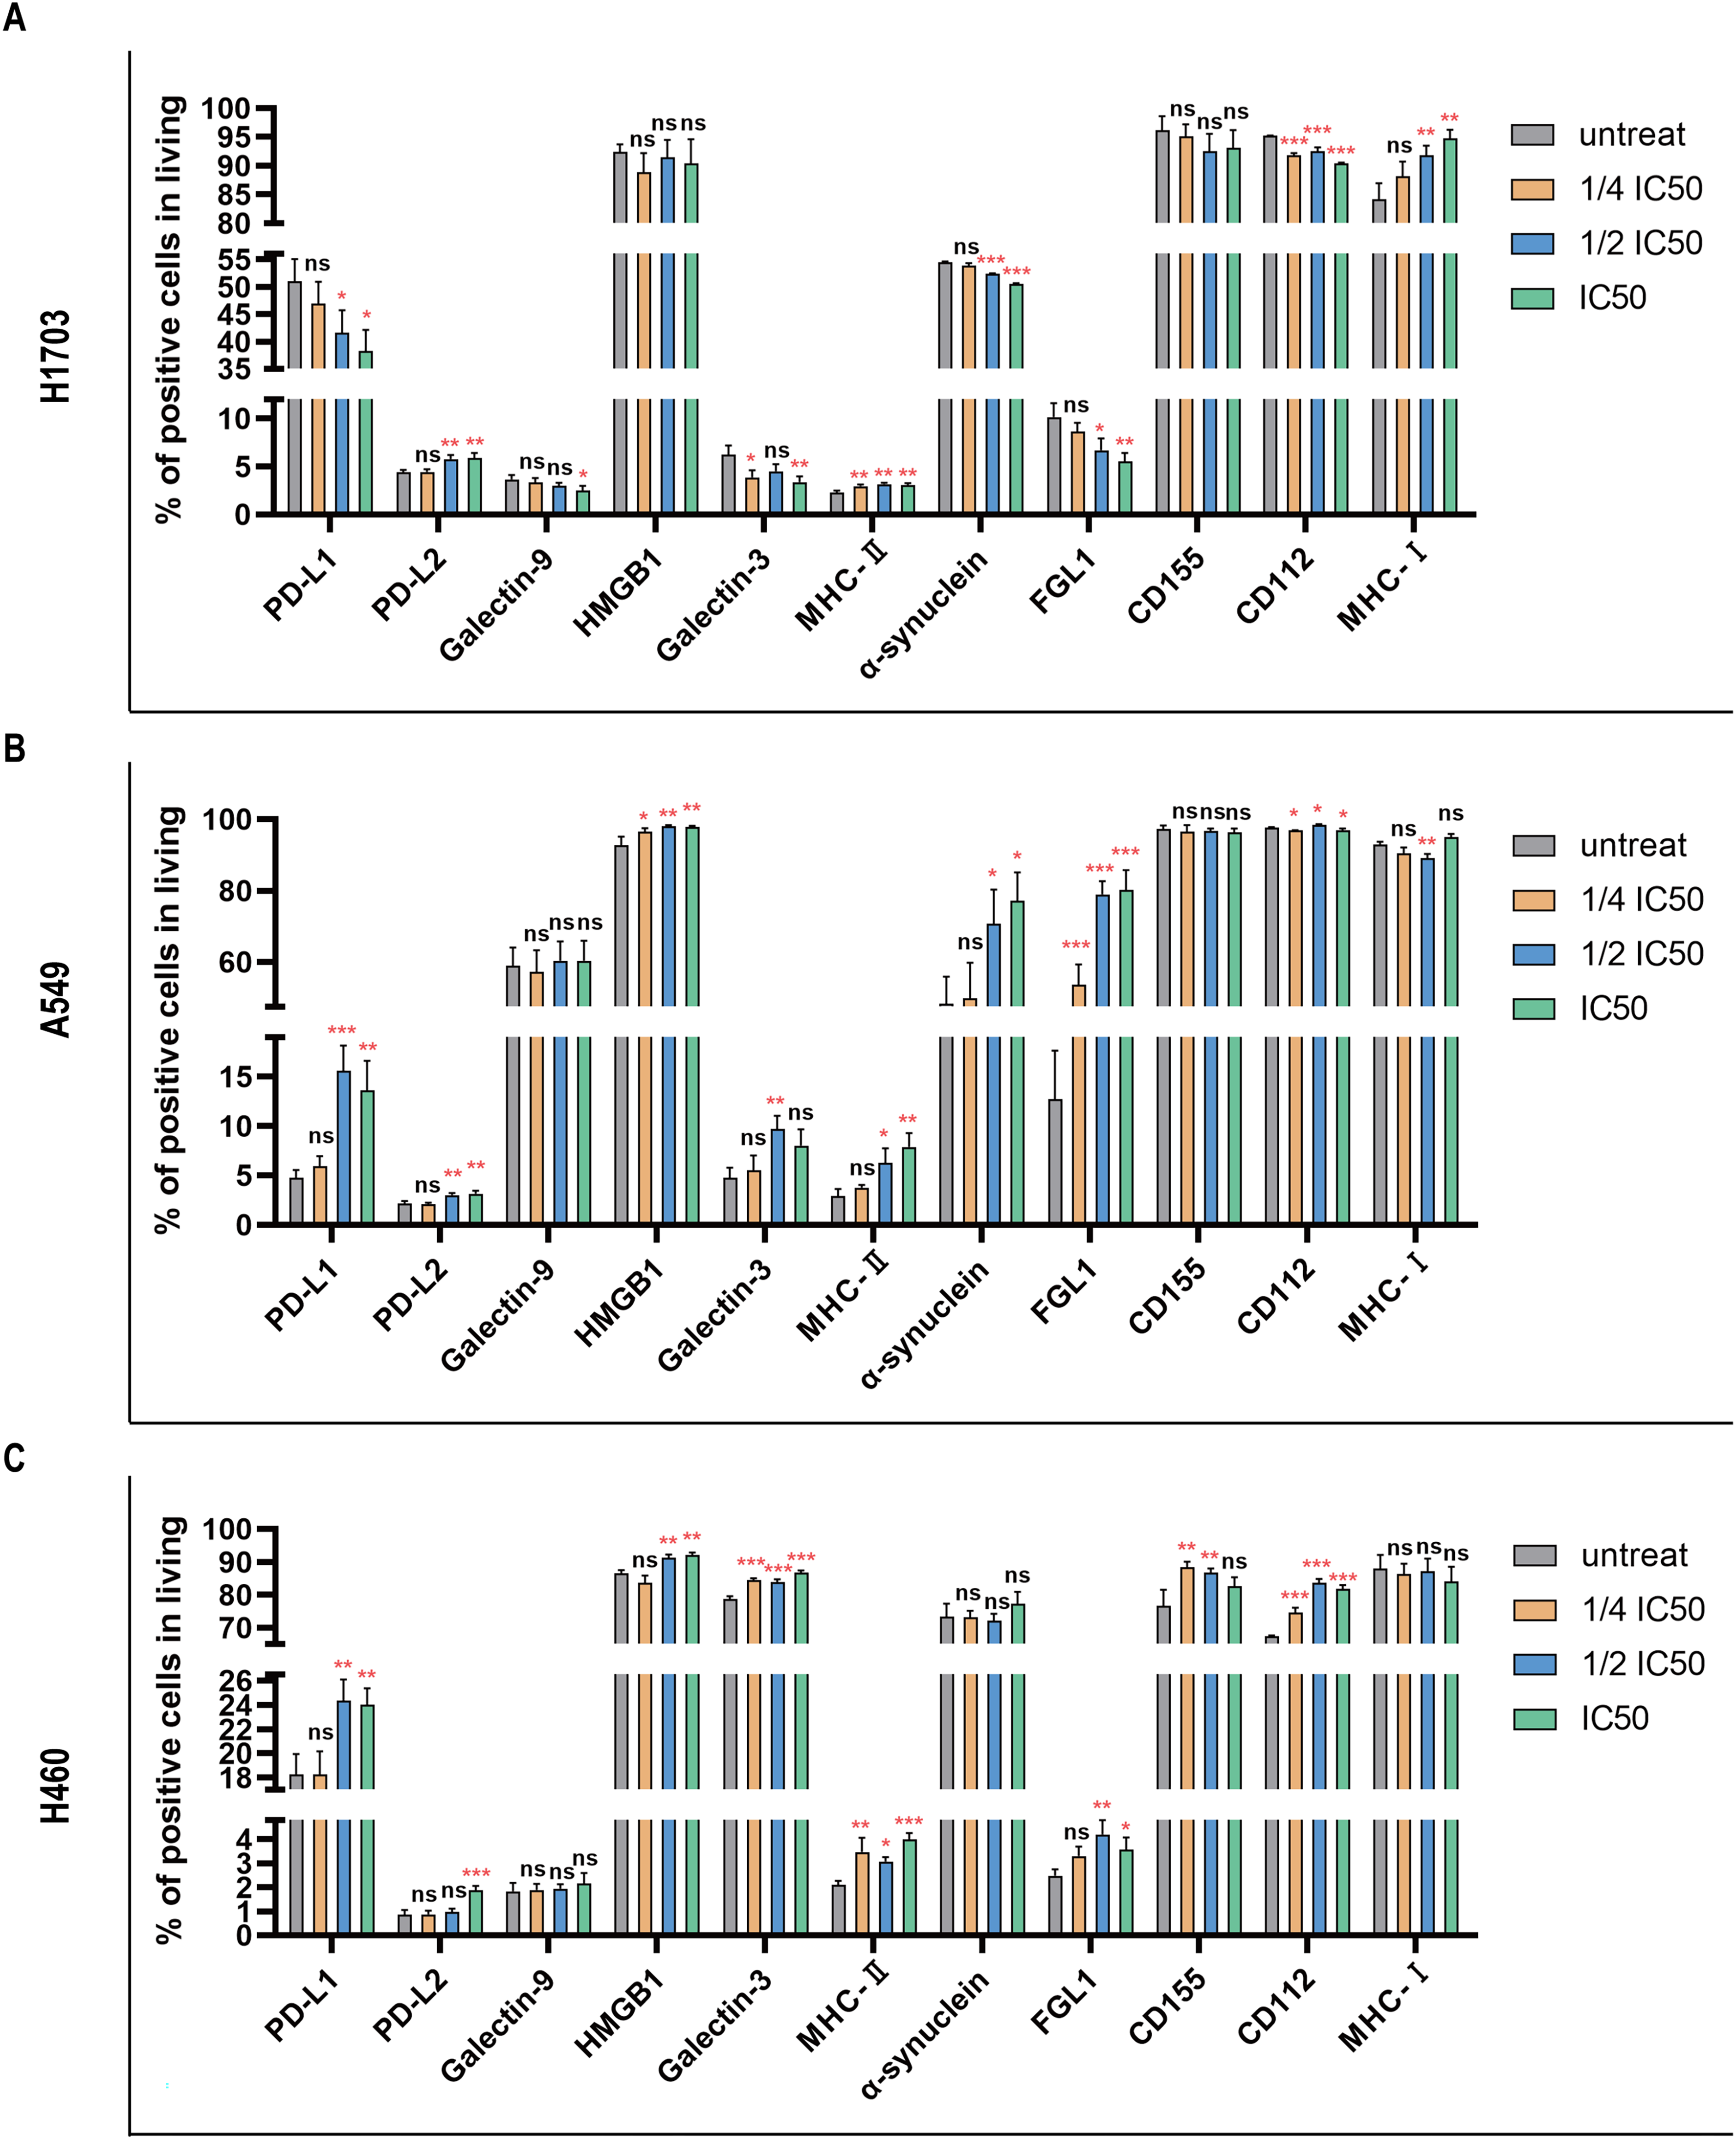
Effects of cisplatin on immune checkpoint molecules in the three cell lines. H1703 (A), A549 (B) and H460 (C) cell lines are treated with cisplatin at different concentrations (1/4 IC50, 1/2 IC50, and IC50). After 72 hours, immune checkpoint expression is analyzed by flow cytometry. Bar graphs depict the percentage of positive cells (*P < .05; **P < .01; ***P < .001). The data in (A), (B), and (C) are represented as the mean and standard deviation of three separate studies. Abbreviations: FGL1, fibrinogen-like protein 1; HMGB1, high-mobility group box protein 1; IC50, 50% inhibitory concentrations; MHC-II, major histocompatibility complex-II; PD-L1, programmed cell death ligand 1; PD-L2, programmed cell death ligand 2.
IC50 values of various chemotherapeutic agents against non-small cell lung cancer cell lines at 72 hours (X ± S).

In A549 cell lines, HMGB1 expression was significantly increased at concentrations of 1/4 IC50, 1/2 IC50, and IC50, and PD-L1, PD-L2, MHC-II, and α-synuclein expressions were increased at concentrations of 1/2 IC50 and IC50. Galectin-3 and CD112 expressions were increased only at 1/2 IC50 concentration. In contrast, CD112 expression was significantly decreased at 1/4 IC50 and IC50 concentrations. MHC-I expression was decreased only at 1/2 IC50 concentration (Figure 1B). The expressions of FGL1, PD-L1, and MHC-II were most significantly increased after cisplatin treatment at IC50 concentration, with expressions increased by 5.31-fold, 1.84-fold, and 1.7-fold, respectively. The expressions of PD-L2 and α-synuclein were also increased by 46.5% and 59.3%, respectively (Figure 1B).
In H460 cell lines, the expressions of galectin-3, MHC-II, and CD112 were significantly upregulated at 1/4 IC50, 1/2 IC50, and IC50 concentrations. PD-L1, HMGB1, and FGL1 expressions were upregulated at 1/2 IC50 and IC50 concentrations. CD155 expression was upregulated at 1/4 IC50 and 1/2 IC50 concentrations, while PD-L2 expression was significantly upregulated by 1.17-fold only at IC50 concentration (Figure 1C). The expression of MHC-II was also increased by 90.4% (Figure 1C).
Effects of Carboplatin on ICP Molecules in the Three Cell Lines
In H1703, carboplatin significantly upregulated the expressions of PD-L2, MHC-II, and α-synuclein at 1/2 IC50 and IC50 concentrations and upregulated MHC-I expression at 1/4 IC50, 1/2 IC50, and IC50 concentrations. Meanwhile, carboplatin downregulated the expressions of PD-L1 and galectin-3 at 1/2 IC50 and IC50 concentrations and downregulated the expressions of galectin-9 and FGL1 at 1/4 IC50, 1/2 IC50, and IC50 concentrations. Meanwhile, the expression of α-synuclein was decreased at a lower carboplatin concentration (1/4 IC50) and increased at 1/2 IC50 and IC50 concentrations (Figure 2A). At IC50 concentration, carboplatin significantly upregulated the expressions of PD-L2 by 97.9%. In contrast, it downregulated the expressions of PD-L1 (mean: 51.6%) and FGL1 (mean: 46.9%) (Figure 2A).

Effects of carboplatin on immune checkpoint molecules in the three cell lines. H1703 (A), A549 (B), and H460 (C) cell lines are treated with cisplatin at different concentrations (1/4 IC50, 1/2 IC50, and IC50). After 72 hours, immune checkpoint expression is analyzed by flow cytometry. Bar graphs depict the percentage of positive cells (*P < .05; **P < .01; ***P < .001). The data in (A), (B), and (C) are represented as the mean and standard deviation of three separate studies. Abbreviations: FGL1, fibrinogen-like protein 1; HMGB1, high-mobility group box protein 1; IC50, 50% inhibitory concentrations, MHC-II, major histocompatibility complex-II; PD-L1, programmed cell death ligand 1; PD-L2, programmed cell death ligand 2.
In A549, carboplatin upregulated the expressions of PD-L1 (at 1/4 IC50 and IC50), PD-L2 (at 1/2 IC50 and IC50), FGL1 (at IC50), and CD155 (at 1/2 IC50) and downregulated the expressions of galectin-9 and HMGB1 at 1/4 IC50 concentration and the expression of CD112 at IC50 concentration. Notably, MHC-I expression was increased at 1/2 IC50 and decreased at IC50 (Figure 2B). At IC50 concentration, PD-L1 and PD-L2 expressions were significantly higher by 98.0% and 61.8%, respectively, than those in untreated cell lines (Figure 2B).
In H460, carboplatin upregulated the expressions of PD-L1 and FGL1 at 1/2 IC50 and IC50 concentrations. It also significantly increased the expressions of PD-L2, galectin-9, and MHC-II but only at IC50 concentration. Meanwhile, carboplatin significantly downregulated the expressions of galectin-3 at 1/4 IC50, 1/2 IC50, and IC50 concentrations, of α-synuclein at 1/2 IC50 and IC50 concentrations, and of CD155 at IC50 concentration. However, the expressions of HMGB1 and CD112 were significantly upregulated at 1/4 IC50 concentration (Figure 2C). At IC50 concentration, the expressions of PD-L2 and FGL1 were significantly increased by 1.34-fold and 1.1-fold. Galectin-9 and MHC-II expressions were also increased by 99.3% and 51.3%, respectively (Figure 2C).
In H460, the expression of galectin-3 was upregulated after cisplatin treatment and downregulated after carboplatin treatment. In H1703, the expression of α-synuclein was downregulated after cisplatin treatment and upregulated after carboplatin treatment. These results indicated that the same chemotherapy agent may have opposing effects in tumor cells with different pathological types (Figures 1 and 2).
Effects of Paclitaxel on ICP Molecules in the Three Cell Lines
In H1703, paclitaxel significantly upregulated the expressions of PD-L2 (at 1/2 IC50 and IC50 concentrations), MHC-II (at IC50 concentration), and α-synuclein (at 1/4 IC50 and 1/2 IC50 concentrations). Meanwhile, the expressions of PD-L1, galectin-9, galectin-3, FGL1, and CD112 were downregulated at 1/4 IC50, 1/2 IC50, and IC50 concentrations; these were further decreased with increasing drug concentrations. However, HMGB1 expression was significantly downregulated at IC50 concentration. MHC-I expression was downregulated at a low concentration of 1/4 IC50, while it was upregulated at 1/2 IC50 and IC50 concentrations (Figure 3A). At IC50 concentration, paclitaxel significantly upregulated the expression of MHC-II (mean: 52.8%), and significantly downregulated the expressions of PD-L1 (mean: 50.3%), galectin-3 (mean: 57.0%), and FGL1 (mean: 46.4%) (Figure 3A).

Effects of paclitaxel on immune checkpoint molecules in the three cell lines. H1703 (A), A549 (B), and H460 (C) cell lines are treated with cisplatin at different concentrations (1/4 IC50, 1/2 IC50, and IC50). After 72 hours, immune checkpoint expression is analyzed by flow cytometry. Bar graphs depict the percentage of positive cells (*P < .05; **P < .01; ***P < .001). The data in (A), (B), and (C) are represented as the mean and standard deviation of three separate studies. Abbreviations: FGL1, fibrinogen-like protein 1; HMGB1, high-mobility group box protein 1; IC50, 50% inhibitory concentrations; MHC-II, major histocompatibility complex-II; PD-L1, programmed cell death ligand 1; PD-L2, programmed cell death ligand 2.
In A549, the expressions of PD-L1, PD-L2, galectin-9, and MHC-II were upregulated at 1/4 IC50, 1/2 IC50, and IC50 concentrations, while the expressions of galectin-3, FGL1, and CD155 were upregulated at 1/2 IC50 and IC50 concentrations. Paclitaxel also downregulated the expressions of HMGB1 and CD155 at 1/4 IC50 concentration, of MHC-I at 1/2 IC50 concentration, and of CD112 at 1/4 IC50 and 1/2 IC50 concentrations (Figure 3B). The expressions of PD-L1, PD-L2, and galectin-3 were significantly upregulated by 3.21-fold, 1.23-fold, and 1.82-fold, respectively, after paclitaxel treatment at IC50 concentration. MHC-II and FGL1 expressions were also upregulated by 97.5% and 97.6%, respectively (Figure 3B).
In H460, the expressions of galectin-9 and MHC-II were significantly upregulated at 1/4 IC50, 1/2 IC50, and IC50 concentrations. The expressions of PD-L2 and FGL1 were also upregulated at 1/2 IC50 and IC50 concentrations. Meanwhile, galectin-3 and α-synuclein expressions were significantly upregulated only at 1/4 IC50 concentration. In contrast, paclitaxel downregulated the expressions of CD112 and MHC-I at the concentrations of 1/4 IC50, 1/2 IC50, and IC50. Concurrently, paclitaxel also downregulated PD-L1 expression at 1/2 IC50 and IC50 concentrations, HMGB1 expression at 1/4 IC50 and IC50 concentrations, and CD155 expression at IC50 concentration (Figure 3C). At IC50 concentration, paclitaxel upregulated the expressions of PD-L2 (mean: 4.11-fold), galectin-9 (mean: 2.82-fold), MHC-II (mean: 2.3-fold), and FGL1 (mean: 1.16-fold). Meanwhile, it most significantly downregulated the expression of CD112 (mean: 48.1%) (Figure 3C).
Effects of Gemcitabine on ICP Molecules in the Three Cell Lines
In H1703, gemcitabine significantly increased the expressions of HMGB1 at 1/4 IC50 and IC50 concentrations, of α-synuclein at 1/4 IC50, 1/2 IC50, and IC50 concentrations, and of MHC-I at IC50 concentration. Meanwhile, it decreased the expressions of galectin-3 at 1/2 IC50 and IC50 concentrations and of FGL1 at 1/4 IC50 concentration. However, CD112 expression was upregulated at 1/2 IC50 concentration and downregulated at IC50 concentration (Figure 4A). The expression of α-synuclein was most significantly increased by 14.6%, after gemcitabine treatment at IC50 concentration. Meanwhile, the expression of galectin-3 was most significantly decreased by 51.2% (Figure 4A).

Effects of gemcitabine on immune checkpoint molecules in the three cell lines. H1703 (A), A549 (B), and H460 (C) cell lines are treated with cisplatin at different concentrations (1/4 IC50, 1/2 IC50, and IC50). After 72 hours, immune checkpoint expression is analyzed by flow cytometry. Bar graphs depict the percentage of positive cells (*P < .05; **P < .01; ***P < .001). The data in (A), (B), and (C) are represented as the mean and standard deviation of three separate studies.
In A549, PD-L1 and HMGB1 expressions were significantly increased at IC50 concentration, and α-synuclein expression was significantly increased at 1/2 IC50 and IC50 concentrations. The expressions of galectin-9, FGL1, and MHC-I were significantly increased at 1/4 IC50, 1/2 IC50, and IC50 concentrations. Meanwhile, HMGB1 expression was significantly decreased at a low concentration of 1/4 IC50, CD155 expression was decreased at IC50 concentration, and CD122 expression was decreased at 1/4 IC50, 1/2 IC50, and IC50 concentrations (Figure 4B). At IC50 concentration, the most significantly upregulated ICLs were PD-L1 and FGL1, showing an almost 1.5-fold increase in expression and nearly 53.2%, respectively (Figure 4B).
In H460, the expression of galectin-3 significantly increased as the concentration of gemcitabine increased. The expressions of MHC-II and FGL1 were significantly increased only at IC50 concentration. In contrast, the expressions of PD-L1 and HMGB1 were decreased at IC50 concentration; of PD-L2 at 1/4 IC50 concentration; and of α-synuclein at 1/4 IC50, 1/2 IC50, and IC50 concentrations (Figure 4C). At IC50, gemcitabine most significantly upregulated the expression of FGL1 (mean: 46.8%), followed by that of MHC-II (mean: 39.6%). Meanwhile, the most significantly downregulated expression was that of PD-L1 (mean: 21.9%) (Figure 4C).
Effects of Vinorelbine on ICP Molecules in the Three Cell Lines
In H1703, vinorelbine upregulated the expressions of PD-L1, HMGB1, and CD112 at 1/4 IC50, 1/2 IC50, and IC50 concentrations. It also significantly upregulated the expression of PD-L2 at 1/2 IC50 and IC50 concentrations and upregulated MHC-I expression at IC50 concentration. In contrast, vinorelbine downregulated the expressions of galectin-3 at IC50 concentration; of α-synuclein at 1/2 IC50 and IC50 concentrations; and of FGL1 at 1/4 IC50, 1/2 IC50, and IC50 concentrations (Figure 5A). At IC50 concentration, vinorelbine most significantly upregulated the expression of PD-L1 (mean: 44.1%) and downregulated the expressions of galectin-3 (mean: 49.1%) and FGL1 (mean: 62.8%) (Figure 5A).

Effects of vinorelbine on immune checkpoint molecules in the three cell lines. H1703 (A), A549 (B), and H460 (C) cell lines are treated with cisplatin at different concentrations (1/4 IC50, 1/2 IC50, and IC50). After 72 hours, immune checkpoint expression is analyzed by flow cytometry. Bar graphs depict the percentage of positive cells (*P < .05; **P < .01; ***P < .001). The data in (A), (B), and (C) are represented as the mean and standard deviation of three separate studies. Abbreviations: FGL1, fibrinogen-like protein 1; HMGB1, high-mobility group box protein 1; IC50, 50% inhibitory concentrations; MHC-II, major histocompatibility complex-II; PD-L1, programmed cell death ligand 1; PD-L2, programmed cell death ligand 2.
In A549, the expressions of PD-L1, PD-L2, HMGB1, and MHC-II were upregulated at vinorelbine concentrations of 1/2 IC50 and IC50. The expressions of galectin-9, FGL1, and CD112 were upregulated at 1/4 IC50, 1/2 IC50, and IC50 concentrations. Galectin-3 expression was increased only at 1/2 IC50 concentration. In contrast, the expression of α-synuclein was downregulated at 1/2 IC50 and IC50 concentrations, and MHC-I expression was downregulated at IC50 concentration (Figure 5B). At IC50 concentration, PD-L1 expression was upregulated (mean: 1.29-fold). Further, PD-L2, galectin-9, MHC-II, and FGL1 expressions were upregulated by 47.3%, 44.9%, 64.6%, and 41.8%, respectively (Figure 5B).
In H460, vinorelbine significantly increased the expressions of PD-L1 (at 1/2 IC50 and IC50 concentrations), PD-L2 (at 1/4 IC50 and IC50 concentrations), galectin-9 (at IC50 concentration), galectin-3 (at 1/2 IC50, 1/4 IC50, and IC50 concentrations), α-synuclein (at IC50 concentration), FGL1 (at 1/2 IC50 concentration), CD155 (at 1/4 IC50 and 1/2 IC50 concentrations), CD112 (at IC50 concentration), and MHC-I (at IC50 concentration). Meanwhile, it decreased the expression of HMGB1 (at 1/4 IC50, 1/2 IC50, and IC50 concentrations) (Figure 5C). At IC50 concentration, vinorelbine induced the most obvious effect on PD-L2, increasing its expression by 65.7%. Meanwhile, vinorelbine downregulated the expression of HMGB1 by 17.1% (Figure 5C).
Effects of Pemetrexed on ICP Molecules in the Three Cell Lines
In H1703, pemetrexed significantly upregulated the expressions of PD-L1, galectin-9, MHC-II, and MHC-I at 1/4 IC50, 1/2 IC50, and IC50 concentrations; the expressions of PD-L2 and α-synuclein at 1/2 IC50 and IC50 concentrations; and the expression of galectin-3 but only at IC50 concentration. In contrast, pemetrexed significantly downregulated the expression of FGL1 at 1/4 IC50, 1/2 IC50, and IC50 concentrations; the expression of CD155 at 1/4 IC50 concentration; and the expression of CD112 at 1/4 IC50 and IC50 concentrations (Figure 6A). Pemetrexed significantly upregulated the expression of galectin-3 (mean: 2.23-fold) at IC50 concentration and simultaneously upregulated the expressions of PD-L1 (mean: 60.3%) and MHC-II (mean: 70.2%). Meanwhile, it downregulated the expressions of FGL1 (mean: 20.7%) (Figure 6A).

Effects of pemetrexed on immune checkpoint molecules in the three cell lines. H1703 (A), A549 (B), and H460 (C) cell lines are treated with cisplatin at different concentrations (1/4 IC50, 1/2 IC50, and IC50). After 72 hours, immune checkpoint expression is analyzed by flow cytometry. Bar graphs depict the percentage of positive cells (*P < .05; **P < .01; ***P < .001). The data in (A), (B), and (C) are represented as the mean and standard deviation of three separate studies. Abbreviations: FGL1, fibrinogen-like protein 1; HMGB1, high-mobility group box protein 1; IC50, 50% inhibitory concentrations; MHC-II, major histocompatibility complex-II; PD-L1, programmed cell death ligand 1; PD-L2, programmed cell death ligand 2.
In A549, the expressions of PD-L1, galectin-9, HMGB1, galectin-3, MHC-II, α-synuclein, and FGL1 were significantly upregulated after pemetrexed treatment at 1/4 IC50, 1/2 IC50, and IC50 concentrations, and PD-L2 expression was upregulated at 1/2 IC50 and IC50 concentrations. In contrast, CD112 expression was significantly decreased at 1/4 IC50 and IC50 concentrations (Figure 6B). At IC50 concentration, PD-L1 showed the highest increase from baseline (mean: 4.41-fold). Galectin-3 and MHC-II expressions had similar magnitudes of increase at 1.99-fold and 1.94-fold, respectively. PD-L2 and FGL1 expressions were also increased by 73.8% and 49.2%, respectively (Figure 6B).
In H460, the expressions of PD-L1 and PD-L2 were significantly increased at 1/2 IC50 and IC50 concentrations; the expression of galectin-9 was increased at 1/4 IC50 and IC50 concentrations; the expression of α-synuclein was increased at 1/4 IC50 and 1/2 IC50 concentrations; and the expressions of MHC-II and CD112 were increased at 1/4 IC50, 1/2 IC50, and IC50 concentrations. In contrast, the expressions of HMGB1, galectin-3, and MHC-I were significantly decreased at 1/4 IC50, 1/2 IC50, and IC50 concentrations; FGL1 expression was decreased only at 1/4 IC50 concentration; and CD155 expression was decreased only at IC50 concentration (Figure 6C). At IC50 concentration, PD-L2 showed the highest increase in expression (mean: 1.33-fold). PD-L1, galectin-9, and MHC-II expressions were also upregulated by 35.4%, 75.3%, and 91.4%, respectively. Meanwhile, the expression of HMGB1 was most obviously downregulated by 35.2% (Figure 6C).
Discussion
Many chemotherapeutic agents are suspected to exert immunomodulatory effects on the immune system, in addition to their cytotoxic effects.17–20 Thus, there is an increasing interest in their use in combination with immunotherapy. However, evidence on the effect of chemotherapy on ICP expression in squamous cell and large cell carcinomas is rare. The present study found that the expressions of the ICLs PD-L1, PD-L2, galectin-9, HMGB1, MHC-II, galectin-3, α-synuclein, FGL1, CD155, and CD112 and the expression of MHC-I in NSCLC are affected by chemotherapeutic agents and their dose.
PD-L1 is widely expressed in hematopoietic cells, non-hematopoietic cells, and tumor cells, 21 while PD-L2 is selectively expressed in macrophages and dendritic cells.22,23 When activated T cells expressing PD-1 bind PD-L1, T-cell effector functions are inhibited. 24 The affinity of PD-L2 to PD-1 is three times that of PD-L1, and there is a competitive relationship with PD-L1. 25 However, the role of PD-L2 in immune regulation is still unclear. 26 Some reports showed that conventional chemotherapeutics can induce the expression of PD-L1. 27 Higher PD-L1 expression in tumor cells is associated with a better response to anti-PD-1/PD-L1 therapy in NSCLC.28,29 Cisplatin can regulate the expression of PD-L1 in NSCLC through multiple pathways.30–32 Pemetrexed has also been shown to provide a favorable environment for ICP blockade by promoting PD-L1 expression.33,34 In KEYNOTE-189 clinical trials, pembrolizumab plus pemetrexed and platinum-based chemotherapy significantly improved overall survival (OS) and progression-free survival (PFS) in patients with previously untreated metastatic non-squamous NSCLC. 35 In the current study, cisplatin and carboplatin upregulated the expression of PD-L1 in non-squamous cell lines and inhibited the expression of PD-L1 in squamous cell lines, suggesting that platinum drugs combined with anti-PD-1/PD-L1 therapy may improve the therapeutic outcome for non-squamous NSCLC. This was consistent with previous clinical studies. Previous studies did not describe the effects of paclitaxel, gemcitabine, and vinorelbine on PD-L1 expression in NSCLC. However, our results showed that paclitaxel and gemcitabine only upregulated PD-L1 expression in lung adenocarcinoma, while vinorelbine and pemetrexed upregulated PD-L1 expression in all NSCLC subtypes. This suggested that vinorelbine and pemetrexed may be better options in combination with anti-PD-1/PD-L1 therapy in patients with mixed pathological types.
The current study also showed that cisplatin, carboplatin, paclitaxel, vinorelbine, and pemetrexed upregulated the expression of PD-L2 at 1/2 IC50 and IC50 concentrations. However, as the baseline expression level of PD-L2 was very low, it was within 10% even after upregulation. This suggested that its role was less important than that of PD-L1. This was generally consistent with previous reports.36,37 TIM-3 was originally identified as a molecule expressed on CD4+Th1 and CD8 cytotoxic T lymphocytes. 38 To date, four different TIM-3 binding ligands have been reported, namely, galectin-9, HMGB1, carcinoembryonic antigen cell adhesion molecule 1, and phosphatidyl serine. 39 In a colon adenocarcinoma mouse study, anti-Tim-3 promoted interferon (IFN)-γ-mediated T-cell anti-tumor immune responses and showed similar efficacy to PD-1 inhibitors. 40 In the current study, paclitaxel, gemcitabine, vinorelbine, and pemetrexed significantly upregulated the expressions of both galectin-9 and HMGB1 in the A549 cells lines, which suggested that the combination of anti-TIM-3 treatment might be effective. However, in H1703 and H460 cell lines, galectin-9 may have lesser significance than HMGB1 as indicated by its low expression before and after treatment. In addition, HMGB1, as an alarmin, is induced by some chemotherapeutic agents, leading to immunogenic cell death in tumor cells. 41 This indicates the complexity of the role of HMGB1 in tumor immune response, and its clinical significance still needs further investigation.
LAG-3 is a member of the immunoglobulin superfamily and has a similar structure to CD4. 42 In addition to its higher binding affinity to MHC-II than has CD4, LAG-3 has also been reported to bind FGL1, α-synuclein, galectin-3, and lymph node sinusoidal endothelial cell C-type lectin. 43 Anti-LAG-3 antibodies activate effector T cells and affect Treg function, making LAG-3 a more promising target for cancer immunotherapy. 44 Therefore, it is essential to explore the effects of the combination of LAG-3 blockade with different chemotherapy agents. In this study, cisplatin and paclitaxel significantly upregulated the expressions of MHC-II, galectin-3, α-synuclein, and FGL1 in A549 and H460 cells, suggesting a better effect when combined with LAG-3 blockade. In contrast, vinorelbine combined with anti-LAG-3 may have been less effective in H1703 because it inhibited the expression of all LAG-3 ligand molecules. In addition, galectin-3 might have a more important role than other ligands in H460 because of its high-level expression, especially after treatment with cisplatin, gemcitabine, and vinorelbine. Similarly, in A549, FGL1 was significantly upregulated after treatment, suggesting that a specific blockade of FGL1 combined with chemotherapy may be more beneficial.
TIGIT is a promising novel immunotherapy target for cancer. In the tumor microenvironment, tumor cells and APCs express the two ligands CD155 and CD112, which TIGIT binds to. 45 TIGIT-blocking antibodies enhance T-cell function and promote secretion of cytokines, including IL-2, IL-5, IL-10, IL-13, and IFN-γ. 46 Additionally, in vitro studies have shown that anti-CD155 therapy can reduce the migration and invasion of osteosarcoma. 47 However, it is worth noting that CD155 can also bind the co-stimulatory receptors CD226 and DNAX accessory molecule-1 expressed by T cells and NK cells to promote their activation.48,49 Competitive binding of TIGIT and CD226 to PVR, which has been known as an important mechanism of TIGIT-driven immune suppression, and anti-TIGIT-blocking monoclonal antibodies are thought to reverse this inhibition by inhibiting the binding of TIGIT to CD155. 50 Our results showed that cisplatin and vinorelbine significantly upregulated the expressions of both CD155 and CD112 in H460. This suggested that cisplatin and vinorelbine combined with TIGIT blockade may have a better effect. At present, anti-TIGIT monoclonal antibody has entered the clinical study. Recently, in the CITYSCAPE Phase 2 clinical trial, anti-TIGIT mAb (tiragolumab) has demonstrated promising clinical efficacy in NSCLC treatment when combined with an anti-PD-L1 drug (Tecentriq). 51 Chemotherapy can affect the expression of TIGIT ligand, and its combined anti-Tigit regimen is still a promising approach.
Finally, we analyzed the expression of MHC-I on tumor cells after chemotherapeutic drug treatment. The results showed that paclitaxel and pemetrexed downregulate the expression of MHC-I in H460 and vinorelbine downregulated MHC-I expression in A549. It has been reported that the downregulation of MHC-I molecules often leads to immune escape of tumor cells from T cell-mediated immune responses, providing tumor cells with a higher degree of malignancy.52–54 As such, upregulating MHC-I expression has become a potential therapeutic approach. In our study, cisplatin, carboplatin, paclitaxel, and pemetrexed upregulate the expression of MHC-I in H1703, gemcitabine upregulated MHC-I expression in H1703 and A549, and vinorelbine upregulated MHC-I expression in all three cell lines. Although it is unclear by which pathway chemotherapeutics induce MHC-I upregulation, these agents may be interesting candidates for improving the therapeutic effect of immunotherapy strategies.
There are some limitations when comparing our results with the previous studies. First of all, different concentrations of chemotherapeutic drugs were used, sometimes not even within clinically approved therapeutic doses. Secondly, the data were derived from in vitro experiments, and the in vivo environment is much more complex, which may affect the detection of indicators. In addition, we only looked at outcomes after a single agent and did not test biomarker changes after drug combination therapy. Finally, the results were only observed by flow cytometry, and the verification of the findings by other methods was lacking. However, this study still provides some hints for further research in the future.
Conclusion
Chemotherapy agents have different effects on the expression profile of ICP molecules in different pathological subtypes of NSCLC. Further research and understanding of the potential molecular basis of ICIs will improve patient selection in the combination of immunotherapy and chemotherapy and will help advance individualized treatment.
Supplemental Material
sj-docx-1-tct-10.1177_15330338231202307 - Supplemental material for Effect of Chemotherapeutics on In Vitro Immune Checkpoint Expression in Non-Small Cell Lung Cancer
Supplemental material, sj-docx-1-tct-10.1177_15330338231202307 for Effect of Chemotherapeutics on In Vitro Immune Checkpoint Expression in Non-Small Cell Lung Cancer by Yu Zhao, Zhe Wang, Xiuhuan Shi, Ting Liu, Wenwen Yu, Xiubao Ren and Hua Zhao in Technology in Cancer Research & Treatment
Supplemental Material
sj-docx-2-tct-10.1177_15330338231202307 - Supplemental material for Effect of Chemotherapeutics on In Vitro Immune Checkpoint Expression in Non-Small Cell Lung Cancer
Supplemental material, sj-docx-2-tct-10.1177_15330338231202307 for Effect of Chemotherapeutics on In Vitro Immune Checkpoint Expression in Non-Small Cell Lung Cancer by Yu Zhao, Zhe Wang, Xiuhuan Shi, Ting Liu, Wenwen Yu, Xiubao Ren and Hua Zhao in Technology in Cancer Research & Treatment
Footnotes
Abbreviations
Declaration of Conflicting Interests
The authors declared no potential conflicts of interest with respect to the research, authorship, and/or publication of this article.
Ethical Approval
This study was approved by the Medical Ethics Committee of Tianjin Cancer Hospital (Ethics Number: EK2020214).
Funding
The authors disclosed receipt of the following financial support for the research, authorship, and/or publication of this article: This research was supported by grants from the National Natural Science Foundation of China (U20A20375, 81974416, and 82103001), the Tianjin Natural Science Foundation (21JCQNJC01430) and the Haihe Laboratory of Cell Ecosystem Innovation Fund (22HHXBSS00004).
Supplemental Material
Supplemental material for this article is available online.
References
Supplementary Material
Please find the following supplemental material available below.
For Open Access articles published under a Creative Commons License, all supplemental material carries the same license as the article it is associated with.
For non-Open Access articles published, all supplemental material carries a non-exclusive license, and permission requests for re-use of supplemental material or any part of supplemental material shall be sent directly to the copyright owner as specified in the copyright notice associated with the article.