
Abstract
Background
In the era of “precision medicine,” the availability of high-quality tumor biomarker tests is critical and tumor proliferation evaluated by Ki-67 antibody is one of the most important prognostic factors in breast cancer. But the evaluation of Ki-67 index has been shown to suffer from some interobserver variability. The goal of the study is to develop an easy, automated, and reliable Ki-67 assessment approach for invasive breast carcinoma in routine practice.
Patients and Methods
A total of 151 biopsies of invasive breast carcinoma were analyzed. The Ki-67 index was evaluated by 2 pathologists with MIB-1 antibody as a global tumor index and also in a hotspot. These 2 areas were also analyzed by digital image analysis (DIA).
Results
For Ki-67 index assessment, in the global and hotspot tumor area, the concordances were very good between DIA and pathologists when DIA focused on the annotations made by pathologist (0.73 and 0.83, respectively). However, this was definitely not the case when DIA was not constrained within the pathologist's annotations and automatically established its global or hotspot area in the whole tissue sample (concordance correlation coefficients between 0.28 and 0.58).
Conclusions
The DIA technique demonstrated a meaningful concordance with the indices evaluated by pathologists when the tumor area is previously identified by a pathologist. In contrast, basing Ki-67 assessment on automatic tissue detection was not satisfactory and provided bad concordance results. A representative tumoral zone must therefore be manually selected prior to the measurement made by the DIA.
Introduction
Breast cancer is the most common type of cancer in women worldwide. In the era of “precision medicine,” the availability of high-quality tumor biomarker tests with proven analytical validity and clinical utility is critical. Tumor proliferation is one of the most important prognostic factors. Ki-67 is a nuclear protein that is present during the late G1, S, G2, and M phases of the cell cycle, reflecting the proportion of cell proliferation. 1 It has been demonstrated that high Ki-67 expression is associated with a higher risk of relapse and worse survival in early breast cancer patients. 2 Ki-67 expression is also used for subdividing luminal-like breast cancers into luminal A and luminal B groups. 3 This points to the critical importance of Ki-67 staining for therapeutic strategy. However, a standard methodology for the evaluation of Ki-67 has not yet been established. 4 Estimating the percentage of Ki-67 stained nuclei has been shown to suffer from some interobserver variability and the cut-off values may vary considerably between different institutions.5,6 Based on this evidence, the goal of the study is to develop an automated and reliable Ki-67 assessment approach for invasive breast carcinoma in routine practice. Thus, implementing such an automatic procedure could permit a better classification of the tumors and consequently, a better therapeutic management of the patients.
Material and Methods
A total of 151 biopsies of invasive breast carcinoma were analyzed. All subtypes of invasive carcinoma were included. The study protocol was approved by the local Institutional Ethics and Research Review Boards.
The Ki-67 index was manually and independently evaluated by 2 pathologists (SB and XC) with MIB-1 antibody (Monoclonal mouse anti-human Ki-67 antigen, Clone MIB-1, Ready-to-use, Dako). Only nuclear staining (plus mitotic figures stained with Ki-67) was incorporated into the Ki-67 index that is defined as the percentage of positively stained cells among the total number of malignant cells scored. The fraction of proliferating cells was based on a count of at least 500 tumor cells. Cases with ≥ 20% positive nuclei were classified as high Ki-67 expression, and those with < 20% were classified as low Ki-67 expression. This cut-off of 20% was applied to differentiate luminal A tumors and luminal B tumors.
In the present study, an evaluation of the Ki-67 index was done by each pathologist as a global tumor index (ie considering all the tumor) and also in a hotspot when a clearly more proliferative area was observed. In the absence of a clear hotspot however (ie because of a relatively uniform Ki-67-positive cell distribution in the tumor area), each pathologist considered the global tumor index as the hotspot assessment.
Digital Image Analysis
All stained slides were digitized at x20 (0.453 µm side pixel) using a calibrated NanoZoomer-XR scanner (Hamamatsu Photonics K.K.). The whole-slide images (WSIs) were transferred to an analysis platform consisting of NDP.view2 (Hamamatsu) for annotating the images and QuPath 7 for image quantification. In each virtual slide, 1 pathologist (XC) annotated a global region of interest (ROI1) to focus the analysis on the tumor area (also avoiding tissue or staining artifact as much as possible), and if present, a hotspot area of Ki-67-positive cells (ROI2). The criteria were established on the basis of the recommendations of the “International Ki67 in Breast cancer Working Group.” These criteria are available on the website www.ki67inbreastcancerwg.org—(Research and education—visual scoring protocol). We examine the entire glass slide section using low-power magnification to identify the most proliferative area of invasive carcinoma. We exclude carcinoma in situ and nontumor tissue such as necrosis and fibrosis. We considered this area as the region of interest (ROI1).
It should be noted that these ROI selections were not communicated to the second pathologist (SB), who performed her own (manual) analysis independently. The global tumoral area (ROI1) and hotspot (ROI2) identified by the first pathologist were analyzed using the QuPath software (Supplemental Figure S1). In each WSI, QuPath is scripted to automatically detect tissue outlines, as well as the negatively and positively Ki-67-stained nuclei. Tissue outlines are intersected with ROI1 and ROI2 outlines to define accurate references to compute the Ki-67 labeling indices. The labeling index (LI) in each region is defined as the ratio of the number of positively stained nuclei over the total number of nuclei. When a ROI2 was not provided by the pathologist, the global Ki-67 LI was considered equivalent to the hotspot assessment in accordance with the pathologist decision described above.
In addition, aiming to automate hotspot identification, we determined the statistical properties of the ROI2 annotations in terms of cell density and surface area. Using the 20% percentile values of these 2 features in order to cover a large majority of cases, we determined the properties of equivalent round regions, ie a disk of radius 330 µm containing at least 1465 cells. We then defined HSROI and HSTissue as the round regions with those properties and with the highest positive cell density in RO1 ∪ ROI2 (to cover the rare cases where ROI2 was defined outside ROI1 by the pathologist) and over the whole tissue sample on the slide, respectively. In contrast to HSROI which focuses on tumor regions annotated by the pathologist, HSTissue relates to fully automated hotspot detection, without pathologist intervention. As with ROI2, where such regions cannot be identified, the corresponding global value is assigned.
Statistical Analysis
Lin's concordance correlation coefficient (CCC) and its 95% confidence interval 8 were computed to evaluate the fit (ie concordance) between pairs of measurements (provided by pathologists and digital image analysis [DIA]). A P-value smaller than .05 was considered to indicate statistically significant differences. All CCC analyses were performed using a Python implementation based on, and checked against the R (R Core Team, 2017) and in the “epiR” package, 9 the “epi.ccc” function; the Statistica© software was used for the others.
Results
First, the CCCs between the proliferative indices provided by the 2 pathologists were good: 0.76 for global tumoral area and 0.72 for hotspot area.
Second, for Ki-67 index assessment in the global tumor area, the CCCs were very good between DIA and pathologists when DIA focused on the ROI1 annotations: 0.83 and 0.82 for XC and SB, respectively. These results are therefore better than the concordance between the 2 pathologists (with significant differences, see confidence intervals in Table 1). However, when DIA computed the Ki-67 indices on the whole tissue samples present on the slides, the CCCs between DIA and pathologists strongly decreased to 0.50 and 0.58 for XC and SB, respectively.
Results of CCCs (With Confidence Intervals) Between Pathologists and DIA in Different Conditions, ie Using Pathologist's ROI Annotations or Not (DIA-Tissue = Fully Automatic).

Abbreviations: DIA, digital image analysis; CCC, concordance correlation coefficient; ROI, region of interest.
Third, for Ki-67 index assessment in hotspot tumor area, the CCC values were also good between DIA and pathologists when DIA focused on the ROI2 annotations: 0.77 and 0.80 for XC and SB respectively. Similar results were obtained with the automatic hotspot (HSROI) detection performed by DIA inside ROI1 U ROI2 annotations (0.73 and 0.77 for XC and SB, respectively). This is due to the very good concordance (CCC of 0.91) also observed when comparing the Ki-67 indices provided by DIA to characterize hotspots regions, either in the provided ROI2 annotations or by automatic detection in ROI1 U ROI2. However, this was definitely not the case when DIA automatically established its hotspot selection in the whole tissue sample, without the selection of a region of interest by the pathologist; in this case the CCC values between DIA and pathologists were 0.28 and 0.34 for XC and SB, respectively. All of these results are summarized in Table 1.
For both global area and hotspot area, DIA had a trend to underestimate the Ki-67 indices provided by the pathologists for small values (<20%) and to overestimate them for high values (see Figures 1 and 2). When focusing on the same hotspot regions identified by ROI2 annotations, the regression line estimating XC's assessments of Ki-67 indices from DIA ones crossed the diagonal at 20.8% (see Figure 2). A similar result is obtained when using automatic hotspot (HSROI) detection in ROI1 U ROI2 annotations (see Figure 3). However, this time the regression line estimating XC's assessments of Ki-67 indices from DIA ones crossed the diagonal at 15.4%. This result was also confirmed when comparing DIA assessments in ROI2 and those resulting from automatic hotspot detection in ROI1 U ROI2: the latter method found hotspots with generally higher Ki-67-positive cell densities (see Supplemental Figure S2).

Relationship between the global Ki-67 index assessed in the tumoral regions by the 2 pathologists (SB and XC) and DIA assessment in ROI1 (delineated by XC). As compared to the diagonal (dotted line), the 2 regression lines show that DIA had a trend to underestimate the hotspot Ki-67 indices provided by the pathologists for small values (<20%) and to overestimate them for high values. Abbreviations: DIA, digital image analysis; ROI, region of interest.
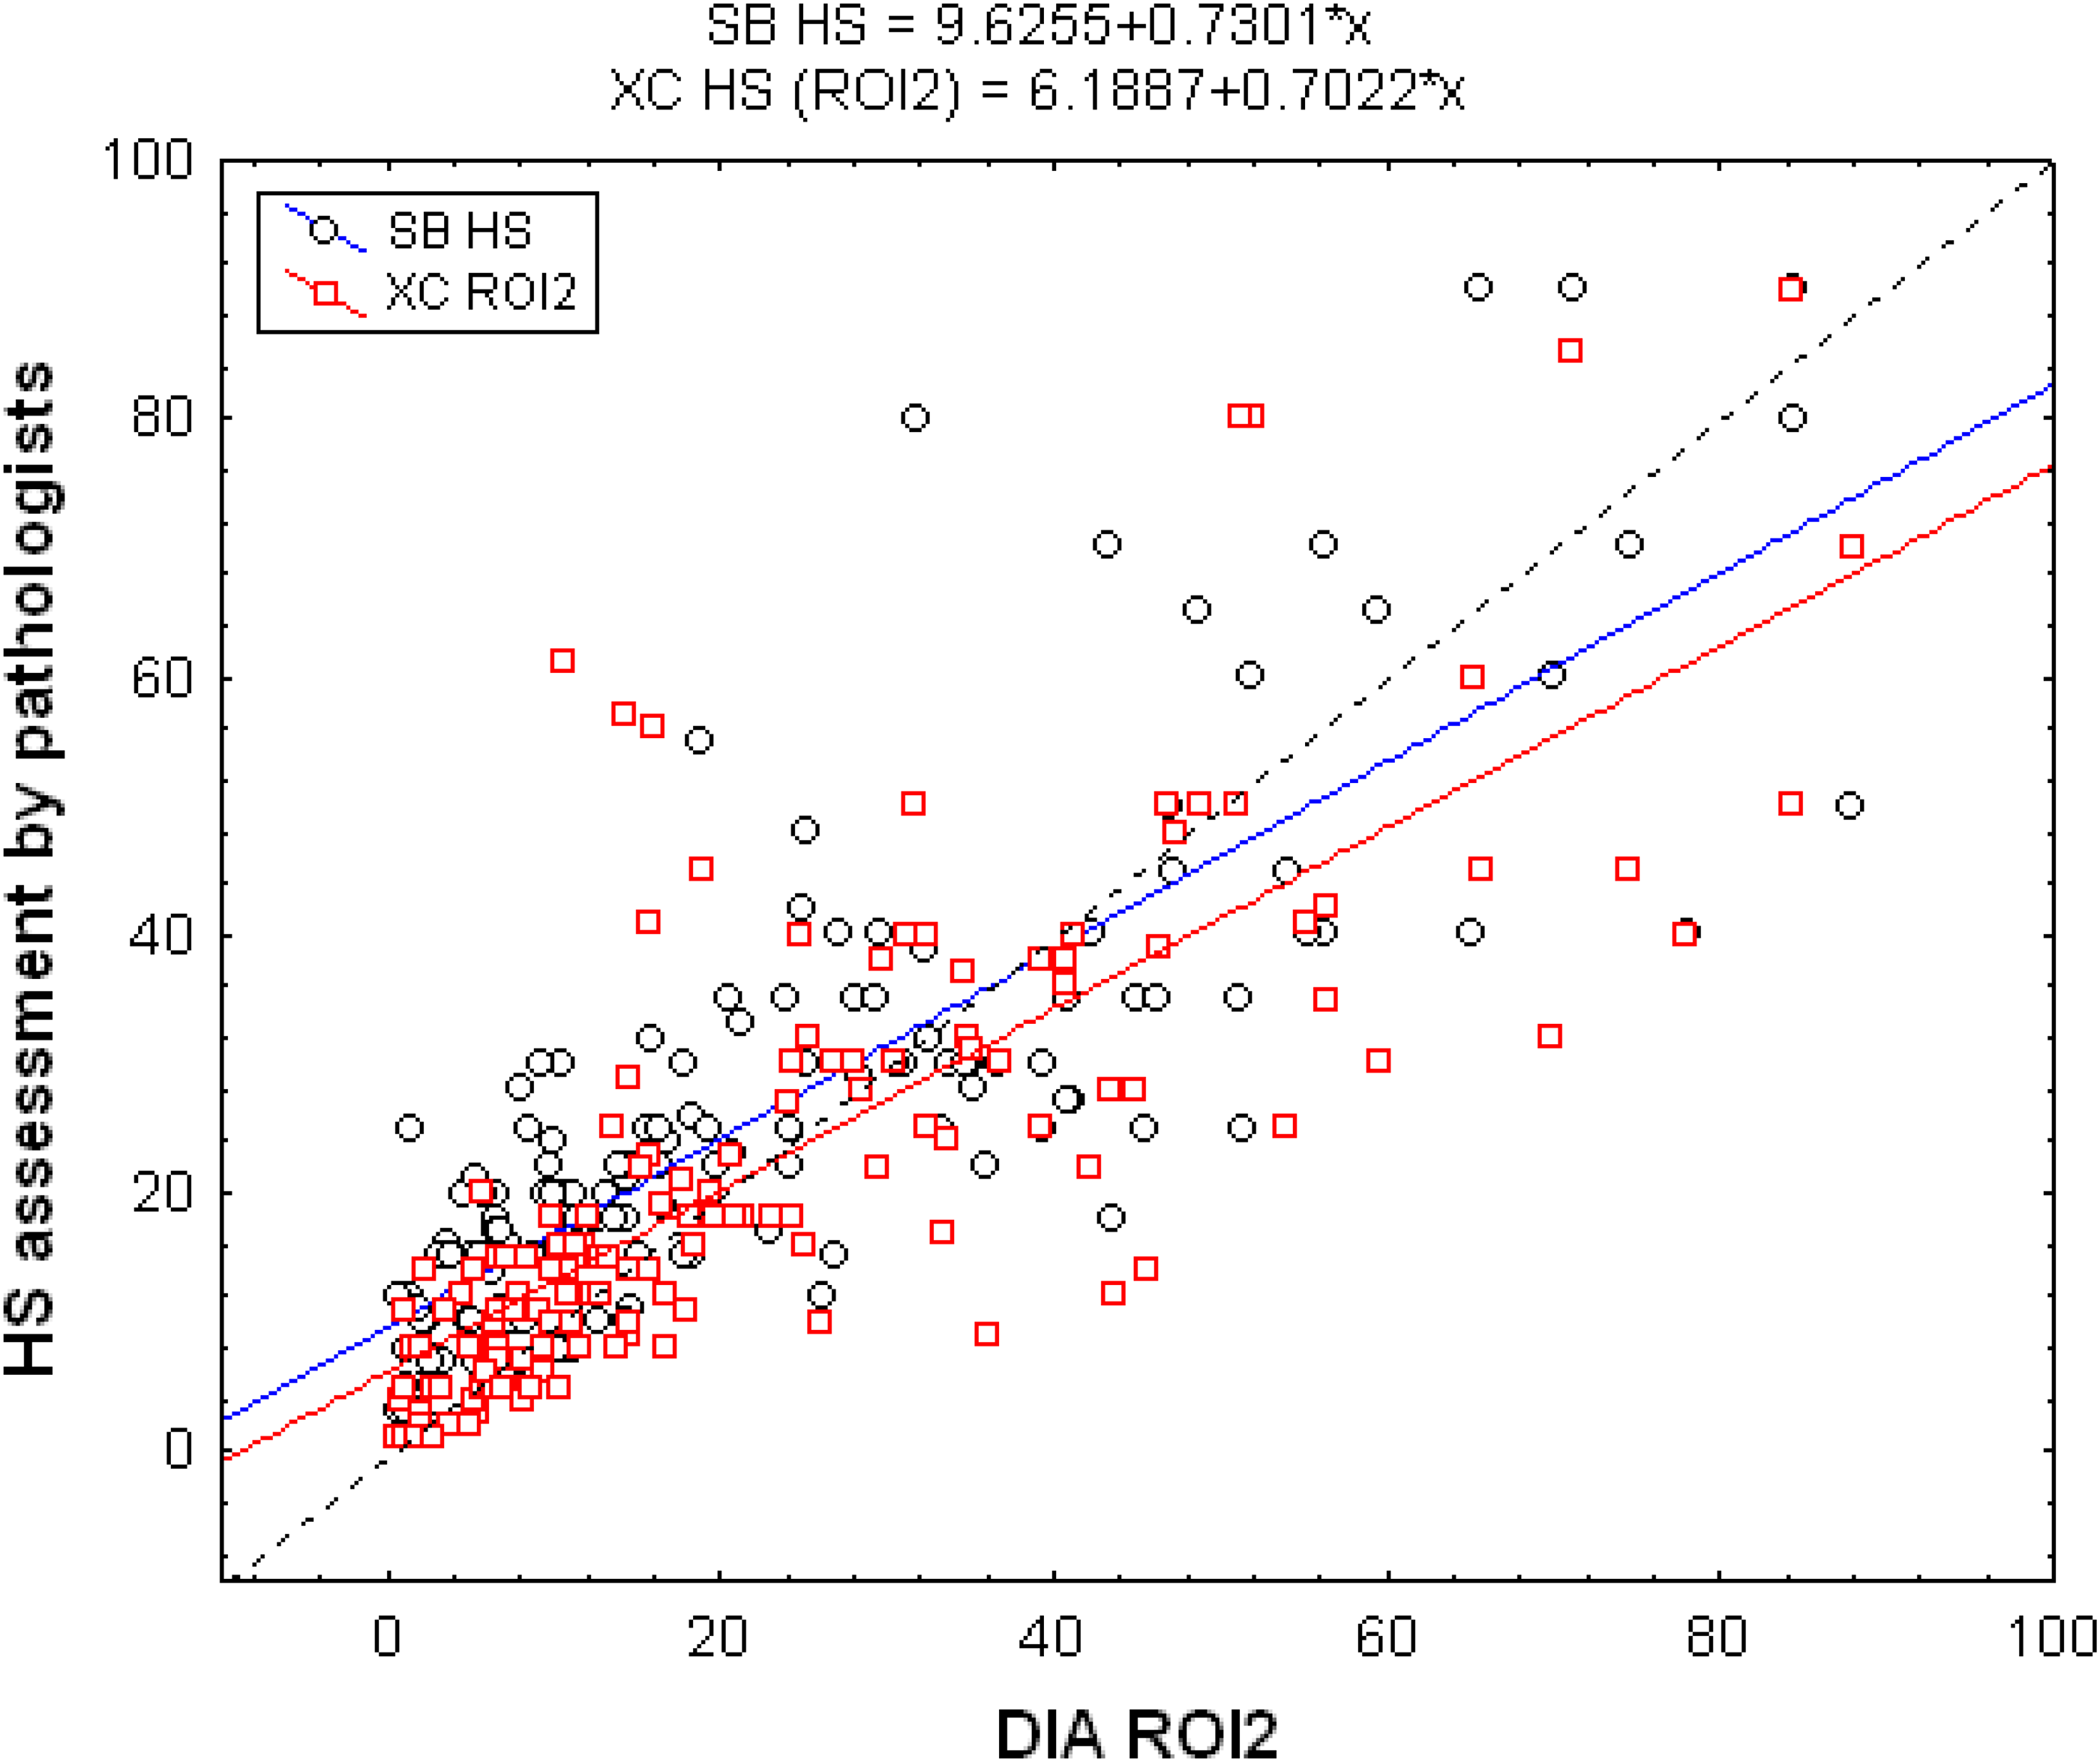
Relationship between the Ki-67 index assessed in the hotspot tumoral regions by the 2 pathologists (SB and XC) and DIA assessment in ROI2 (delineated by XC). As compared to the diagonal (dotted line), the 2 regression lines show that DIA had a trend to underestimate the hotspot Ki-67 indices provided by the pathologists for small values (<20%) and to overestimate them for high values. Abbreviations: DIA, digital image analysis; ROI, region of interest.

Relationship between the Ki-67 index assessed in hotspot tumoral regions by a pathologist (XC) and DIA assessment in automatic hotspot identification in ROI1 U ROI2. The regression line estimating XC's assessments from DIA ones crossed the diagonal at 15.4%, suggesting that from this threshold DIA tends to identify more proliferative HS regions. Abbreviations: DIA, digital image analysis; ROI, region of interest.
Based on the automatic hotspot detection method (in ROI1 U ROI2) and the 20% threshold for the Ki-67 indices (useful to differentiate luminal A and luminal B tumors), we observed 23 discordant cases between DIA and pathologist (XC) (Table 2). This is better than the concordance between the 2 pathologists who totalized 38 discordant cases with respect to this 20% threshold. Fifteen cases were classified as high Ki-67 indices (≥20%) by DIA and as low (<20%) by XC. Eight cases were classified as low Ki-67 indices by DIA and as high by XC. Referring to XC's distinction between low and high Ki-67 indices, the sensitivity and the specificity of the DIA were 87% (54/62) and 83% (74/89), respectively. The positive predictive value was 78% (54/69) and the negative predictive value was 90% (74/82).
Causes of Discordance According to the Limit of 20% for Ki-67 Expression.

Discussion
With regard to breast cancer, the Ki-67 index is a valuable marker, as it has prognostic and predictive abilities. Its main problem is the limited reproducibility due to lacking standardization of procedures and interobserver variability. The usefulness of Ki-67 to decide on breast cancer management is a matter of discussion.10,11 The international Ki67 breast cancer working group studied the evaluation of the Ki-67 index during many years. This group proposes a precise method of scoring end recommendations to obtain the best index.12–14 Additionally, the American National Comprehensive Cancer Network guidelines do not provide any information regarding Ki-67 immunohistochemical assessment and its role in breast cancer prognosis. 12 However, in Europe, the Saint Gallen Consensus Meeting had suggested to use Ki-67 for classifying Luminal cancers since 2009. In 2011, a cut-off of 14% 15 was proposed, on the basis of the study by Cheang et al, 16 but 2 years later, it was upgraded to 20%. 17
In this study, we have demonstrated that automated DIA of Ki-67 expression is reliable compared to manual subjective assessment. The concordance correlation between the 2 pathologists was good (0.76) in agreement with the results found in the literature (range from 0.71 to 0.87). 18 The DIA technique demonstrated a meaningful concordance with the indices evaluated by a young and an experienced pathologist, when the tumor area is previously identified by a pathologist. In contrast, basing Ki-67 assessment on automatic tissue detection was not satisfactory and provided bad concordance results. A representative tumoral zone must therefore be manually selected prior to the measurement made by the DIA. This need is justified by the fact that tissue and staining artifacts cause discordances. The causes of discordance are multiple. The cellularity could be too dense, or inversely cases could have insufficient cellularity to be aligned. The presence of other types of cells (inflammatory, stromal, and endothelial cells) present in the area of interest was counted by DIA (and artificially decreased the Ki-67 assessments) but not by the pathologist. In the case of heterogeneity of the Ki67 staining, the pathologist underestimated the proliferation. Crushed cells, necrosis, and peeled slides were other causes of misinterpretation. It should be also noted that 11 of the 23 discordant cases between XC and DIA had 1 or 2 of these Ki-67 assessments very close to the 20% threshold, but on either side of it. The regression line characterizing the relationship between the pathologist's and DIA assessments in the same delineated hotspot regions (ROI2) crossed the diagonal at 20.8%. This result suggests that the DIA assessments around the 20% threshold can be viewed with some confidence and do not need to be adapted to classify the cases between low and high Ki-67 indices. Even when left free to determine a hotspot region in the representative tumor area, the agreement between DIA and pathologists remains good and even better than between the 2 pathologists for this hotspot issue. This better agreement attributed to DIA is maintained for the distinction of hotspot areas with low (<20%) or high (≥20%) proliferation indices. In fact, our results suggest that our DIA approach achieves a form of consensus between the 2 pathologists, as it is in better agreement with the 2 pathologists individually than the 2 pathologists are among themselves.
When using automatic hotspot detection in ROI1 U ROI2, the regression line estimating XC's assessments of Ki-67 indices from DIA ones crossed the diagonal at 15.4%, suggesting that when free to identify a hotspot region in a delineated tumoral region, DIA can identify a more proliferative hotspot region than the pathologist.
In any case, the DIA's strength to count huge numbers of cells accurately would allow for clinical pathologists to focus on authenticating the final score without manual counting, which would be more cost-effective and require less effort.
The availability of high-quality tumor biomarker tests with proven analytical validity and clinical utility is critical because it is essential to classify the tumors properly and therefore treat the patients properly. The automatic analysis must reflect the reality of the tumor. We must be sure that what is counted corresponds to the structures we want to analyze.19,20
Furthermore, the Ki-67 index is also important for grading other cancers eg, neuroendocrine tumors4,21 and brain tumors. 22 Although some cases may require manual adjustments, this workflow was deemed acceptable for assessing Ki-67 in breast carcinoma, suggesting that DIA could offer an objective tool for routine practice. It's important to note that there are many studies23–26 and commercial or open-source platform approaches to image analysis and quantification, particularly in case of evaluation of the Ki-67 index in breast carcinoma.27,28
The International Ki67 Working Group (IKWG) undertook studies of the use of a range of platforms and software to assess the feasibility of the introduction of automation to scoring of Ki67. Rimm et al 27 investigated 10 different software platforms using 7 different scanners and observed an ICC 0.83 (95% CI 0.73-0.91). Different scanners and analysis systems provided different scores from one another. Nonetheless, for 8 sites using the same scanner, the ICC for average automated scores was 0.89 (95% CI 1⁄4 0.81-0.96), which exceeded the prestudy criterion for success. Boyaci et al 14 used the software Qupath to validate the automated Ki67 scoring guideline from the IKWG and they demonstrated high reproducibility and independent prognostic potential in breast cancer. Aung et al 29 compared 2 DIA platforms, QuPath and Visiopharm (Visiopharm Integrator System) and their results indicated that the 2 platforms perform essentially identically in detecting Ki67 index in breast cancer. They concluded that calculating Ki67 index is software independent. We used QuPath in our study because it's free to download and it's easy to use. We can use it everywhere and anytime. Visiopharm and Halo are 2 other platforms that are expensive, not easy to implement in a pathologic laboratory and cannot be used anywhere. Nevertheless, Visiopharm and HALO can be used in the Ki-67 assessment and were used in breast carcinoma with excellent results.28,30,31
However, to have a chance of becoming routine, the procedure should be as simple as possible to use in daily practice. The proposed DIA approach, based on QuPath for quantification and visualization, offers some promises. The pathologist is asked to guide the system by outlining a manual but easy annotation around the region of interest and the DIA algorithms propose a final score based on counting nuclei and finding hotspots. Further advantages of QuPath include cost (QuPath is free to download and use) and scriptability (the ability to call any QuPath function from a script that can be run on a batch of images), as well as making its source code open to collaboration and to anyone wishing to improve the system. The need to select manually the region of interest may represent a supplementary time-consuming step for the pathologist. We are currently exploring the possibility of using deep neural networks to do so automatically and to focus on tumor cells only for computing Ki-67 labeling indices.
However, the procedure must be the simplest to be used in daily practice. In this context, the need to select manually the region of interest is an important thing to know because it's a supplementary step. This points to an important need to improve the detection of representative areas of the tumor by DIA, and we are currently exploring the possibility of using deep neural networks to do so automatically. The proposed DIA approach, based on QuPath for quantification and visualization, offers some promises. The pathologist is asked to guide the system by outlining a manual but easy annotation around the region of interest and the DIA algorithms propose a final score based on counting nuclei and finding hotspots. Further advantages of QuPath include cost (QuPath is free to download and use) and scriptability (the ability to call any QuPath function from a script that can be run on a batch of images), as well as making its source code open to collaboration and to anyone wishing to improve the system.
Supplemental Material
sj-docx-1-tct-10.1177_15330338231169603 - Supplemental material for Comparison Between Manual and Automated Assessment of Ki-67 in Breast Carcinoma: Test of a Simple Method in Daily Practice
Supplemental material, sj-docx-1-tct-10.1177_15330338231169603 for Comparison Between Manual and Automated Assessment of Ki-67 in Breast Carcinoma: Test of a Simple Method in Daily Practice by Xavier Catteau, MD, PhD, Egor Zindy, PhD, Sarah Bouri, MD, Jean-Christophe Noël, MD, PhD, Isabelle Salmon, MD, PhD and Christine Decaestecker, PhD in Technology in Cancer Research & Treatment
Supplemental Material
sj-doc-2-tct-10.1177_15330338231169603 - Supplemental material for Comparison Between Manual and Automated Assessment of Ki-67 in Breast Carcinoma: Test of a Simple Method in Daily Practice
Supplemental material, sj-doc-2-tct-10.1177_15330338231169603 for Comparison Between Manual and Automated Assessment of Ki-67 in Breast Carcinoma: Test of a Simple Method in Daily Practice by Xavier Catteau, MD, PhD, Egor Zindy, PhD, Sarah Bouri, MD, Jean-Christophe Noël, MD, PhD, Isabelle Salmon, MD, PhD and Christine Decaestecker, PhD in Technology in Cancer Research & Treatment
Footnotes
Declaration of Conflicting Interests
The author(s) declared no potential conflicts of interest with respect to the research, authorship, and/or publication of this article.
Ethics Approval
Ethical approval to report this case series was obtained from the Institutional Ethics and Research Review Boards at Erasme Hospital (P2021/460).
Funding
The author(s) received no financial support for the research, authorship, and/or publication of this article.
Informed Consent
Verbal informed consent was obtained from the patients for their anonymized information to be published in this article.
Supplemental Material
Supplemental material for this article is available online.
References
Supplementary Material
Please find the following supplemental material available below.
For Open Access articles published under a Creative Commons License, all supplemental material carries the same license as the article it is associated with.
For non-Open Access articles published, all supplemental material carries a non-exclusive license, and permission requests for re-use of supplemental material or any part of supplemental material shall be sent directly to the copyright owner as specified in the copyright notice associated with the article.