
Abstract
Purpose
To investigate the role of lymph node ratio (LNR) in young patients with gastric cancer (GC) and develop nomograms to predict the survival of young GC patients.
Methods
This retrospective study enrolled stage I-III GC patients before the age of 40 between 2010 and 2016 from the Surveillance, Epidemiology, and End Results (SEER) database. Cox proportional hazards models were used to determine the prognosticators and create the nomograms incorporating LNR to predict overall survival (OS) and cancer-specific survival (CSS). The discriminating superiority of the nomograms was examined using calibration curves, C-index, receiver operating characteristic (ROC) curves, decision curve analysis (DCA), and integrated discrimination improvement (IDI) by comparing with the TNM staging. The performance of the nomograms for risk stratification was analyzed by the Kaplan–Meier method.
Results
Based on the significant prognosticators identified in multivariate survival analysis, the nomograms were established and showed LNR as the third strongest predictor. The C-index of the nomograms for OS and CSS were higher than those of the TNM staging (OS: 0.773 vs 0.665; CSS: 0.769 vs 0.666). The ROC curves for the nomograms to predict survival exhibited superior sensitivity and specificity when compared with the TNM staging. The calibration plots, DCA curves, and IDI values of the nomograms also demonstrated adequate fit and ideal net benefit in prediction and clinical utility. The Kaplan–Meier analysis observed remarkable differences in patients divided into different risk subgroups (P < .001).
Conclusions
These results found the clinical outperformance of the LNR-based nomograms for predicting survival in young stage I-III GC patients. Our nomograms may improve accuracy of survival risk prediction and facilitate individualized care of young stage I-III GC patients.
Introduction
Gastric cancer (GC) ranks as the fifth most common malignancy worldwide, and is the fourth leading cause of cancer-related deaths. 1 Although middle-aged and elderly patients are the predominant group of GC, incidence rates have been reported significantly rising in young cases.2–4 Young patients accounted for 2–15% of all GC cases with different age criteria used.5–8
Increasing studies have revealed that younger patients with GC manifest more aggressive biological features than older, including poorly differentiated lesions, diffuse or signet-ring histology, frequent nodal involvement, and advanced tumor stage.9–13 Despite a favorable general condition, organ function and tolerance to treatment in young GC patients, most of them may have no alarm symptoms, contributing to delay in diagnosis and a poor clinical outcome. As a result, young patients with GC are facing unique challenges including differences in tumor biological characteristics and variations in effectiveness and safety of treatment.11,14,15 Moreover, in consideration of the problems including early death and fertility preservation faced by such special population, a more precise, reliable, and specific clinical model for prognostic prediction and optimal treatment is necessary with respect to these patients.
The American Joint Committee on Cancer (AJCC) tumor-node-metastasis (TNM) classification is presently widely used in staging cancer, and the number of metastatic lymph nodes plays an important role in guiding clinical treatment and predicting survival for patients.16–18 Considering the heterogeneity of GC, the current TNM staging system remains inadequate in predicting prognosis of young patients with GC. Lymph node ratio (LNR), which is calculated by dividing the number of metastatic lymph nodes (LNs) by the total number of examined LNs, has been found to be of prognostic relevance for predicting survival in patients with GC. Recent findings indicate that LNR could reduce the risk of stage migration and provide a superior predictive ability over the AJCC N stage, suggesting that it is considered an alternative to the N classification.16,19–30 However, the evidence for the predictive value of LNR in young patients with GC is insufficient. Thus, the LNR indicator was introduced to this study.
The Surveillance, Epidemiology, and End Results (SEER) database is an US National Cancer Institute's open-access public database with an annual update. It captures a variety of demographic and clinical data as well as data on treatment and survival from 18 established cancer registries covering approximately 34.6% of the US population. In the present study, we aimed to explore the prognostic significance of LNR and to develop reliable nomograms to predict survival for young patients with GC through reviewing data on presentation, treatment, and survival outcomes of young patients with GC obtained from the SEER database.
Methods and Materials
Study Population
Our design was a retrospective and population-based cohort study. The GC patients before the age of 40 who were histologically proven diagnosed between 2010 and 2016 were included in the present study. We used the International Classification of Diseases for Oncology, Third Edition (ICD-O-3) to determine the tumor sites (C16.0-C16.6, C16.8-C16.9) and histological types (8010-8231, 8255-8576). The case exclusion criteria were the following: (1) patients without important clinicopathological information (T stage = T0/blank or tumor size = 0); (2) patients with incomplete or inaccessible follow-up (survival months = 0); (3) patients with record of previous malignant disease before being diagnosed with GC; (4) patients without the pathological diagnosis or diagnosed only at autopsy or via death certificate; and (5) patients with distant metastasis. SEER*Stat software version 8.3.8 (https://www.seer.cancer.gov/seerstat) was used to extract the data and construct the case listing. In total, 603 patients were included in the study and randomly distributed into two cohorts at the ratio of 2:1 (training cohort, n = 402 and validation cohort, n = 201). The detailed workflow process for patient selection was shown in Figure 1.

Flowchart for selection procedure of young patients with stage I-III gastric cancer from surveillance, epidemiology, and end results (SEER) database.
Variables and Definition of LNR
For each patient, the demographic characteristics (age at diagnosis, race/ethnicity, gender, insurance, and marital status), tumor and treatment features (tumor location, grade, histology type, tumor size, T, N, and M stage [the seventh edition of the AJCC TNM staging], surgery, chemotherapy, and radiotherapy), and follow-up information (survival status, survival time, and cause of death) were acquired. Primary tumor sites in this study were categorized into four groups: cardia (C16.0), middle site (C16.1, C16.2, C16.5, and C16.6), distal site (C16.3 and C16.4), and overlapping or not otherwise specified (NOS) (C16.8 and C16.9). We divided histology types into three categories: diffuse type (8020-8022, 8142, 8145, and 8490), intestinal type (8140, 8144, 8210, 8211, 8260, 8480, and 8481), and other types (8010, 8032, 8033, 8041, 8071, 8255, 8560, and 8576).
The LNR was calculated by dividing the number of positive LNs by the total number of corresponding LNs that were examined and recorded in the SEER database. Although the SEER program recorded the types of gastrectomy performed on some patients, such as total or subtotal/partial gastrectomy, there were still quite a few cases without detailed types of gastric resection. What we could obtain from the SEER database was the total number of regional lymph nodes that were removed and examined by the pathologist (the examined LNs), as well as the exact number of regional lymph nodes that had metastasized (the positive LNs). In the current study, the LNR, as a continuous variable in patients with the exact number of examined LNs and positive LNs, was divided into three LNR risk categories (low risk: <0.10, intermediate risk: 0.10-0.25, and high risk: >0.25). However, in other patients, such as those with an unknown/not stated number of examined LNs or positive LNs, the LNR was defined as NOS. The chosen LNR cut-off ratios in this study were based on previously published studies.24,25,27
Follow-up and Outcome
The final follow-up evaluation was conducted on December 31, 2016. The primary endpoint was overall survival (OS), defined as the period from the time of initial diagnosis to the time of death from any cause or survival at last follow-up. The secondary endpoint was cancer-specific survival (CSS), measured from the time of initial diagnosis to the time of death attributed to gastric cancer or the time of last follow-up with patients still alive.
Statistical Analysis
Categorical variables were expressed as the number and the percentage (N, %), while continuous variables were presented as medians and interquartile ranges (IQR). Univariate and multivariate survival analyses were conducted using the Cox proportional hazards regression model. The hazard ratios (HRs) and 95% confidence intervals (CIs) were shown. Potential predictors were screened out by Cox proportional hazards regression analysis, and variables with a P value <.1 in univariate analysis in the training cohort were further investigated for multivariate analysis. On the basis of the multivariate analysis results, nomograms were created and assessed to predict 1-, 3-, and 5-year survival rates in young patients with GC. Nomograms were subjected to bootstrap resampling (n = 1000) for validation to correct the concordance index (C-index) and explain variance with respect to over-optimism. The discriminating superiority and predictive accuracy of the nomograms were quantified by the C-index, time-dependent receiver operating characteristic (ROC) curves, and the area under the curve (AUC). Calibration plots were created to investigate the agreement between the actual survival and the nomogram-predicted survival. Decision curve analysis (DCA) and integrated discrimination improvement (IDI) were performed to objectively assess the clinical utility through quantifying the net benefits at different threshold probabilities. The optimal cutoff values for the nomograms were calculated by the X-tile software (Yale University, New Haven, CT, USA). 31 The OS and CSS curves were plotted according to the Kaplan–Meier method and analyzed by the log-rank test. Statistical analyses were performed using SPSS software version 20.0 (Chicago, IL, USA) and R software version 3.6.1 (https://www.r-project.org/). The related R packages “survival,” “rms,” “magick,” “timeROC,” “cowplot,” “survIDINRI,” and “ggplotify” were used in the construction and assessment of the nomograms. All analyses were two-tailed, and statistical significant levels were set at P < .05.
Ethics Statements
All patient data extracted and case lists constructed from the SEER database, are anonymous and shared, without containing any identifiers. For this reason, this study was exempted from approval by the institutional review board of Zhujiang Hospital of Southern Medical University. The reporting of this study conforms to RECORD guidelines. 32
Results
Clinicopathological Characteristics of Patients
A total of 603 young patients, who were diagnosed with stage I-III GC, were included in the final analysis, and randomly separated into two cohorts (2:1): the training cohort (402 patients) and the validation cohort (201 patients). The median age of all patients was 35 years (IQR: 31-39 years), 55.22% of patients were men (N = 333) and 44.78% of patients were women (N = 270). Caucasians accounted for a large proportion of the cohort (69.71%, N = 420), and about half of the patients were married (48.92%, N = 295). About 74.13% of the tumors were poorly differentiated (N = 447), and the most common histology type was diffuse (55.06%, N = 332). The demographic and clinicopathological features of the study cohort were summarized in Table 1.
Demographic and Clinicopathologic Characteristics of the Study Cohort.

Abbreviations: IQR, interquartile range; NOS, not otherwise specified; LNR, lymph node ratio.
Others, American Indian/AK Native, Asian/Pacific Islander.
Prognostic Factors of OS and CSS
The median survival time was 22 months, while that of the quartile was 10.75-40.00 months. By the end of the last follow-up, 291 patients (48.26%) died, including 276 patients (45.77%) who died related to gastric cancer and 15 (2.49%) who died from non-cancer-related causes.
Data from the training cohort were used to determine the prognostic factors and build the prediction model. Univariate survival analysis identified a series of factors including the race, tumor subsites, tumor size, T stage, N stage, LNR, surgery, and chemotherapy to be predictors for OS (Table 2) and CSS (Table 3). The variables that significantly affected survival in univariate analysis (P < .1) were investigated using the Cox regression model for multivariate analysis. In a multivariate analysis including the aforementioned variables, race, T stage, LNR, surgery, together with chemotherapy were identified as independent prognostic indicators.
Univariate and Multivariate Analysis of Clinicopathologic Variables in Relation to OS in Young Patients with Stage I-III Gastric Cancer in the Training Cohort.
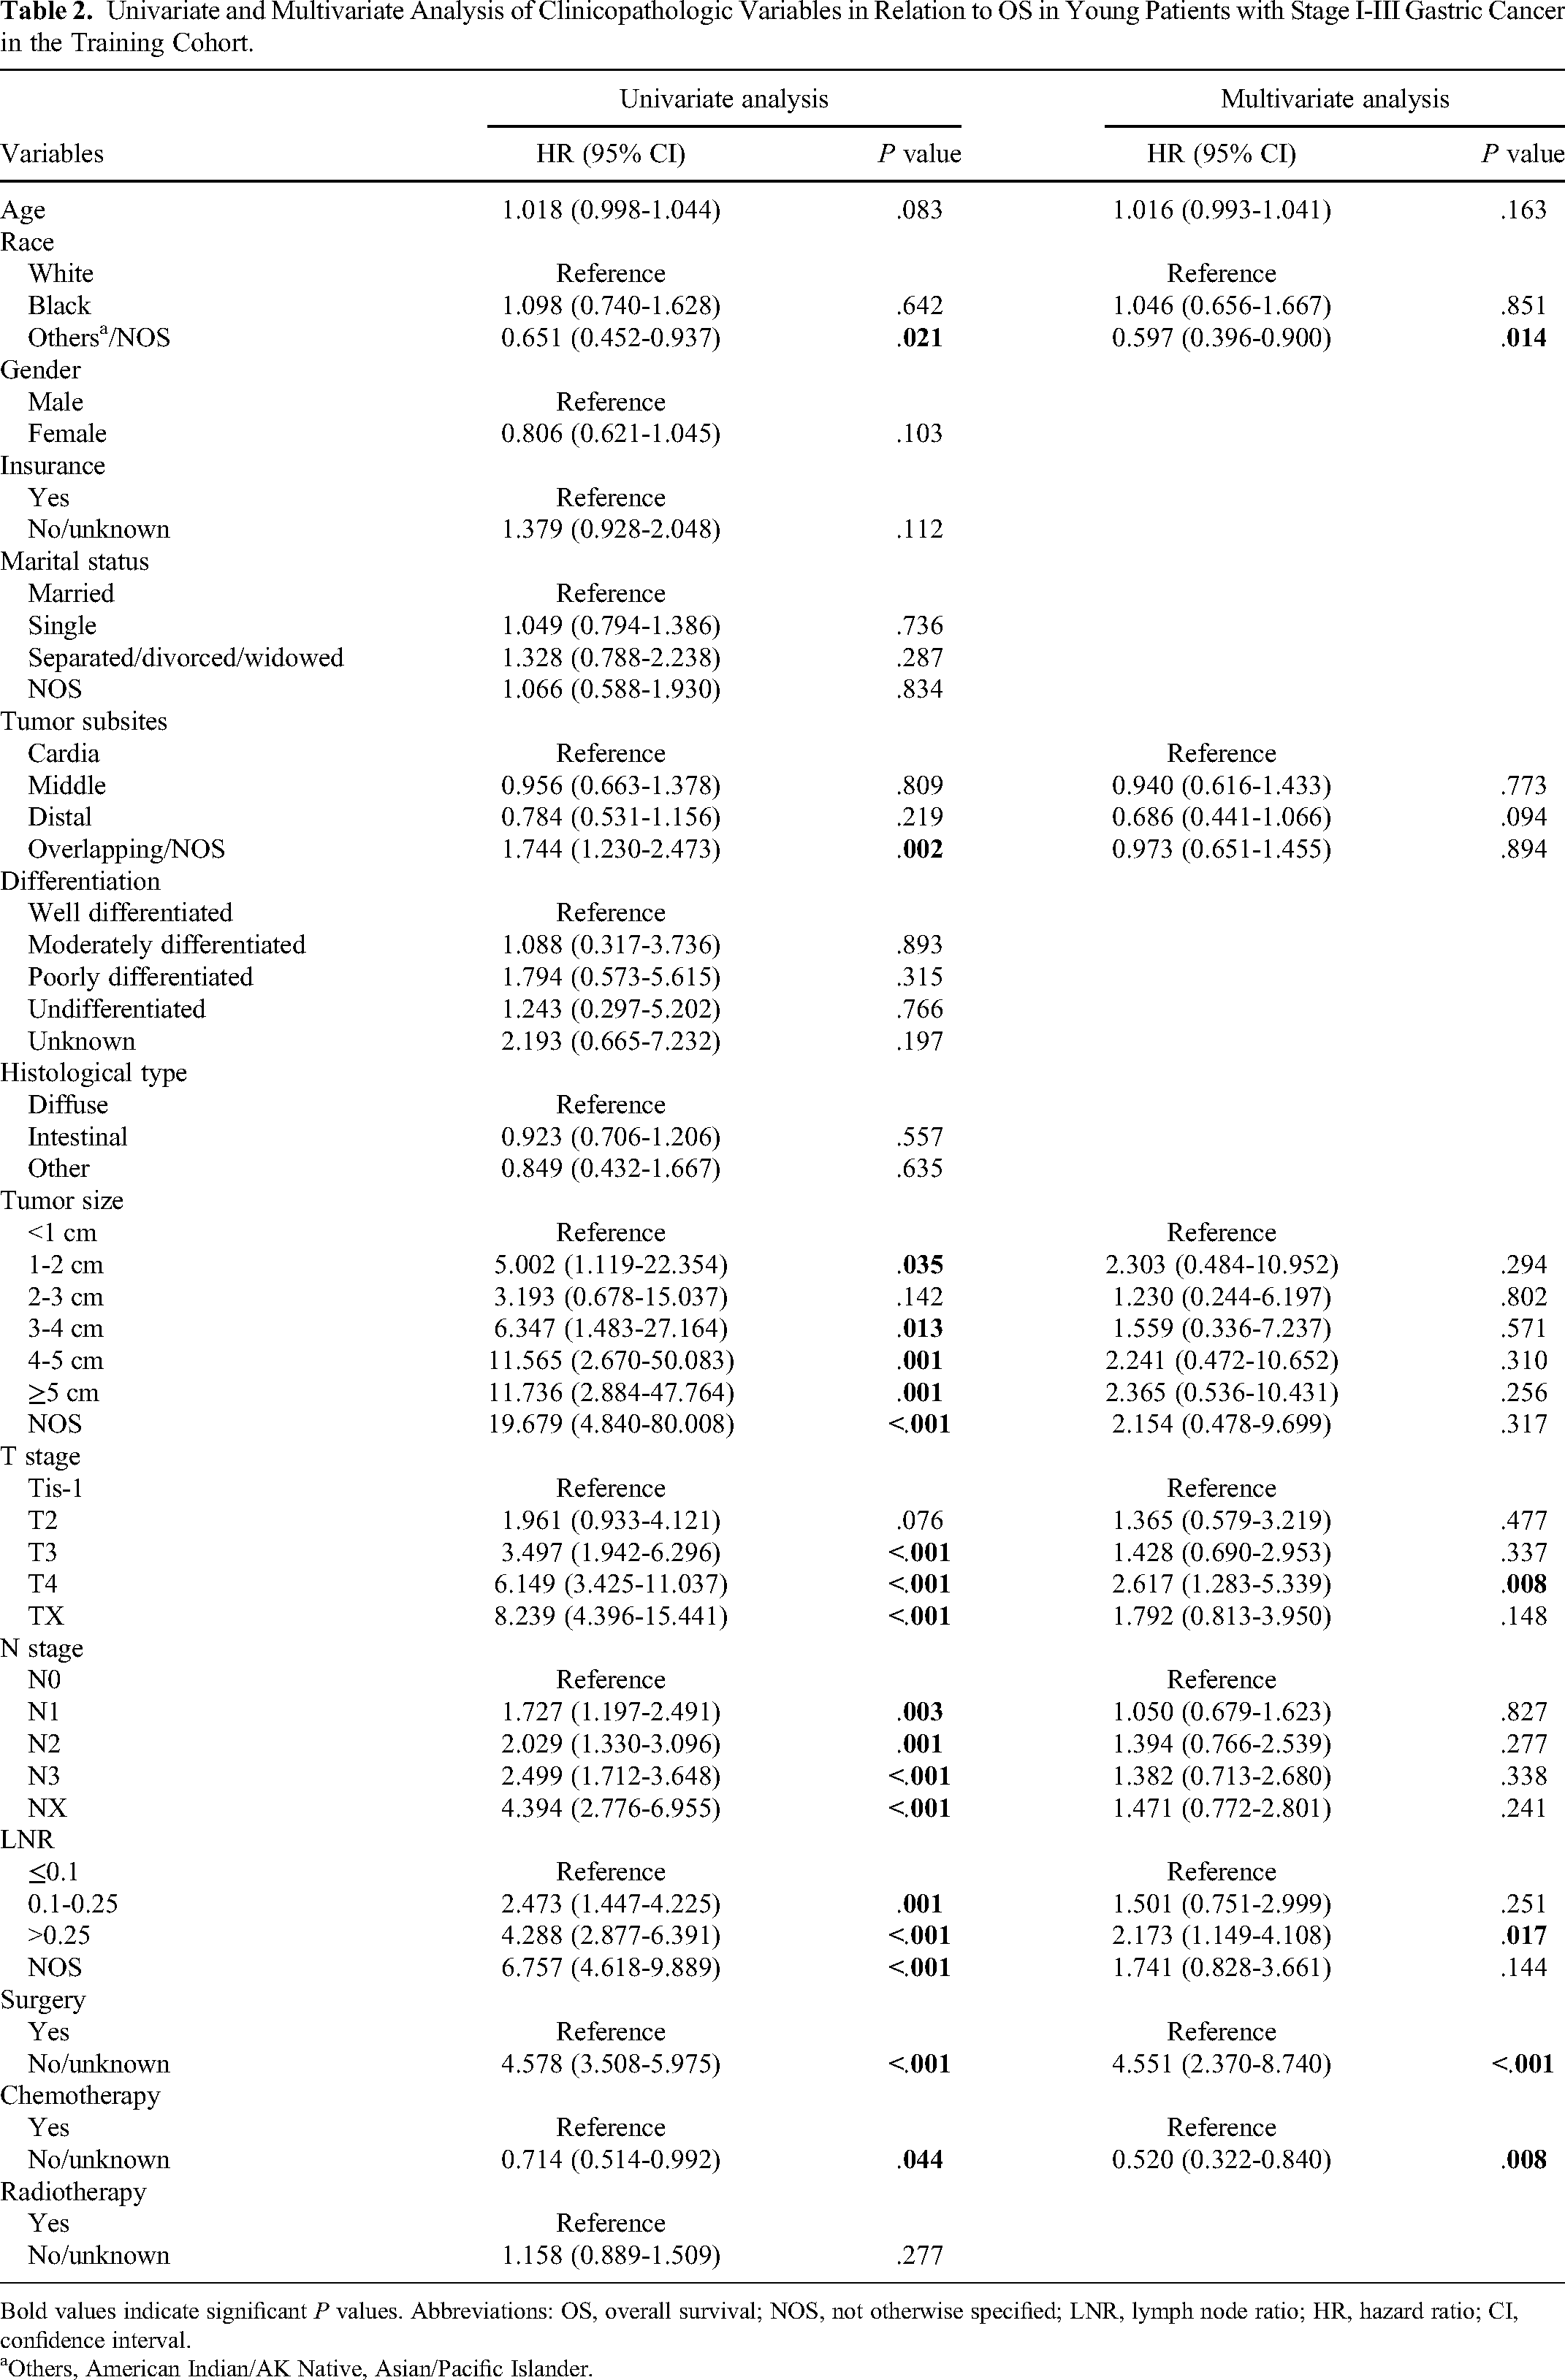
Bold values indicate significant P values. Abbreviations: OS, overall survival; NOS, not otherwise specified; LNR, lymph node ratio; HR, hazard ratio; CI, confidence interval.
Others, American Indian/AK Native, Asian/Pacific Islander.
Univariate and Multivariate Analysis of Clinicopathologic Variables in Relation to CSS in Young Patients with Stage I-III Gastric Cancer in the Training Cohort.

Bold values indicate significant P values. Abbreviations: CSS, cancer-specific survival; NOS, not otherwise specified; LNR, lymph node ratio; HR, hazard ratio; CI, confidence interval.
Others, American Indian/AK Native, Asian/Pacific Islander.
Construction of Prognostic Prediction Nomograms
Based on the proven independent risk factors in the multivariate model, two prognostic nomograms for OS and CSS were constructed for a quantitative method for better survival prediction. Longer lines in the nomogram indicate a larger contribution of specific variables to clinical outcomes, and higher scores mean a worse survival. The prognostic nomograms for 1-, 3-, and 5-year OS and CSS of young patients with stage I-III GC were depicted in Figure 2A and B, respectively. The LNR had the third greatest influence on prognosis. Each subtype of the aforementioned risk factors was assigned a risk score on the point scale. After tallying up the scores related to each risk factor and locating the final scores to the bottom scales, we could calculate the patients’ likelihood of 1-, 3-, and 5-year OS and CSS.

Nomograms for predicting the 1-, 3-, and 5-year OS (A) and CSS (B) for young patients with stage I-III gastric cancer. The nomograms were based on T stage, N stage, M stage, the LNR (lymph node radio), and surgery regimen. The total score of each patient was the sum of the points identified at the top of the scale for each factor and was then identified on the total points scale to determine the probability of 1-, 3-, 5-year OS, or CSS. Abbreviations: OS, overall survival; CSS, cancer-specific survival; NOS, not otherwise specified.
Calibration and Validation of Predictive Nomograms
The present study used calibration plots, C-index, and time-dependent ROC curves to examine the distinguishing abilities of the predictive nomograms. No distinct deviations from the reference line were found in the calibration plots of the nomograms for predicting 1-, 3-, and 5-year OS and CSS, indicating excellent agreement between actual observations and predictions in both the training cohort (Figure 3A and B) and the validation cohort (Figure 3C and D). The C-index values of the constructed nomogram for predicting OS were 0.773 (95% CI: 0.758-0.787) in the training cohort and 0.764 (95% CI: 0.748-0.779) in the validation cohort, which were greater than those of the TNM stage at 0.665 (95% CI: 0.646-0.685) and 0.672 (95% CI: 0.654-0.690) in the training and validation cohorts, respectively. Additionally, the C-index values of the nomogram to predict CSS were 0.769 (95% CI: 0.755-0.784) in the training cohort and 0.761 (95% CI: 0.747-0.776) in the validation cohort, which were higher than those of the TNM stage for CSS in the training cohort (0.666, 95% CI: 0.647-0.686) and the validation cohort (0.670, 95% CI: 0.651-0.688).

Calibration plots of the nomograms for predicting OS and CSS at 1, 3, and 5 years for young patients with stage I-III gastric cancer in the training cohort (A, B) and the validation cohort (C, D). Nomogram-predicted survival is plotted on the x-axis, and actual rates of OS and CSS are plotted on the y-axis. The lines along the 45° line through the origin indicate the perfect calibration models in which the predicted probabilities are identical to the actual probabilities. Abbreviations: OS, overall survival; CSS, cancer-specific survival.
Meanwhile, the time-dependent ROC curves were generated to quantify the predictive accuracy of the nomograms. The results revealed that the nomograms had superior specificity and sensitivity in predicting 1-, 3-, 5-year OS and CSS than the AJCC staging system. In the training cohort, the time-dependent ROC curve for the nomogram to predict OS and CSS at 1, 3, and 5 years exhibited great discrimination when compared with the traditional TNM stage (AUC values: 1-year OS: 0.833 vs 0.688, 3-year OS: 0.826 vs 0.708, 5-year OS: 0.854 vs 0.721; 1-year CSS: 0.830 vs 0.686, 3-year CSS: 0.824 vs 0.710, 5-year CSS: 0.851 vs 0.722) (Figure 4A to C). Also, in the validation cohort, the predictive performance of the nomogram was superior to the TNM stage (1-year OS: 0.830 vs 0.684, 3-year OS: 0.855 vs 0.724, 5-year OS: 0.873 vs 0.752; 1-year CSS: 0.817 vs 0.691, 3-year CSS: 0.846 vs 0.725, 5-year CSS: 0.865 vs 0.752) (Figure 4D to F).

Receiver operating characteristic curves comparing the use of the nomograms and AJCC TNM staging system to predict OS and CSS at 1, 3, and 5 years for young patients with stage I-III gastric cancer in the training cohort (A, B, C) and the validation cohort (D, E, F). Abbreviations: OS, overall survival; CSS, cancer-specific survival; AUC, area under the curve.
Clinical Values of Nomograms
We performed DCA and IDI to compare the clinical values of the nomograms and TNM stage in young patients with stage I-III GC by quantifying the net benefits at different threshold probabilities. The DCA curves of the nomograms exhibited more optimal net benefits and net reduction in interventions per 100 patients when predicting OS and CSS at 1, 3, and 5 years, indicating that the nomograms had more favorable clinical values (Figure 5A to F). In the IDI analyses, our new nomograms based on LNR have a superior performance than the AJCC TNM staging system. IDI values of OS nomogram at 1, 3, and 5 years were as follows: 0.128 (P < .001), 0.115 (P < .001), and 0.101 (P < .001). As for the CSS nomogram, IDI values at 1, 3, and 5 years were as follows: 0.124 (P < .001), 0.110 (P < .001), and 0.009 (P < .001), respectively.

Decision curve analyses of the nomograms and AJCC TNM staging system for predicting OS and CSS at 1, 3, and 5 years for young patients with stage I-III gastric cancer in the training cohort (A, B, C) and the validation cohort (D, E, F). x-axis represents threshold probabilities and y-axis measures net benefit. The horizontal line along x-axis assumes that overall death occurred in no patients, whereas green line assumes that all patients will have overall death at a specific threshold probability. Red line represents nomograms. Blue line represents AJCC TNM staging system. Abbreviations: OS, overall survival; CSS, cancer-specific survival.
Performance of the Nomograms for Risk Stratification
Each subtype of all independent risk factors was assigned a risk score based on the nomograms, and the optimal cutoff levels for the total scores were calculated by the X-tile software. We stratified young patients with GC into three risk groups, that is, Low risk (score ≤ 141), Moderate risk (141 < score ≤ 225), and High risk (score > 225) based on the total scores generated by the nomogram for OS. Similarly, patients were separated into three risk groups (Low risk: score ≤ 166, Moderate risk: 166 < score ≤ 250, High risk: score > 250) according to the total scores for CSS.
The influences of the nomograms on OS and CSS of the study cohort were presented in Figure 6 using the Kaplan–Meier method. In the training cohort, the 1-, 3-, and 5-year OS rates for Low-risk group were 0.897, 0.406, 0.206, respectively, 0.627, 0.203, 0.076 for Moderate-risk group, 0.396, 0.042, 0.021 for High-risk group, with a remarkable distinction across these three groups (P < .001) (Figure 6A). Similarly, the CSS rates at 1, 3, and 5 years in the training cohort for Low-risk group were 0.898, 0.401, 0.204, respectively, 0.621, 0.198, 0.078 for Moderate-risk group, and 0.396, 0.042, 0.021 for High-risk group, with a statistical difference (P < .001) (Figure 6B). Moreover, in the validation group, Low-risk group had the highest 1-year OS and CSS rates of 0.935 and 0.935, 3-year OS and CSS rates of 0.506 and 0.506, 5-year OS and CSS rates of 0.260 and 0.259, followed by Moderate-risk group (1-year OS and CSS rates: 0.633 and 0.633, 3-year OS and CSS rates: 0.267 and 0.283, 5-year OS and CSS rates: 0.100 and 0.100) and High-risk group (1-year OS and CSS rates: 0.375 and 0.375, 3-year OS and CSS rates: 0.083 and 0.083, 5-year OS and CSS rates: 0.042 and 0.042). A statistically prominent difference in survival outcomes was found across these three risk groups (all P < .001) (Figure 6C and D).

Kaplan–Meier survival curves based on risk group stratification of the nomogram for young patients with stage I-III gastric cancer. Kaplan–Meier curves for OS in the training cohort (A) and the validation cohort (C). Kaplan–Meier curves for CSS in the training cohort (B) and the validation cohort (D). Abbreviations: OS, overall survival; CSS, cancer-specific survival.
Discussion
Recently, several lines of findings have reported an increasing trend in the incidence of GC patients at young age.2–4,33 GC in the young has a more aggressive growth pattern and carries a worse clinical outcome compared with older individuals.9–13 A more effective and well-practical scoring model is urgently required for prognosis estimation and guidance in such separate entity. Thus, here we developed two novel prognostic nomograms for predicting OS and CSS in young patients with GC. To our knowledge, this population-based study, capturing survival data from 18 established cancer registries covering 34.6% of the US population, was the first to reveal the independent prognostic significance of LNR for OS and CSS in young patients with GC. The nomograms based on LNR, showed better predictive precision and discriminating superiority over the traditional TNM criteria by comparing the C-index values, calibration curves, time-dependent ROC curves, DCA curves, and IDI values. Furthermore, our study underscored the clinical reliability of the novel nomograms for predicting the survival based on risk stratification, indicating that the applications of these LNR-based nomograms could be beneficial in clinical practice with the potential to better guide treatment and prognosis in young patients with stage I-III GC.
Lymph node metastasis is the most frequent mode of tumor metastasis in GC, and thus lymph node dissection plays a pivotal role in GC surgery for staging and treatment options.16,34 The pathological assessment of LNs in the eighth edition of AJCC TNM staging system is based on the absolute count of positive LNs, and its predictive efficacy for prognosis is significantly affected by the extent of LN dissection.19–23,35 A study from Smith et al using SEER data between 1973 and 1999 found a therapeutic benefit of a large number of examined LNs. 20 According to the AJCC TNM staging, at least 15 harvested LNs are essential for accurate estimates of N staging. A poor primary LN count could produce stage migration, compromise a correct staging, and subsequently underestimate the severity of disease.21–23,36 About 10-15% of patients were found stage migration phenomenon when using the AJCC N classification.21,22,27,37 To reduce the potential bias caused by an insufficient number of harvested LNs and stage migration, the LNR, namely, the ratio between positive and examined LNs, has been proposed for ameliorating the understanding of diagnosis and more accurately evaluating the disease severity. Extensive studies have reported that the LNR, rather than the existing AJCC N staging, could compensate for the stage migration effect and had a better predictive value in patients with GC, suggesting it to be considered as an alternative to the N classification in patients with adequate or inadequate LNs examined.19,24–29,38,39 However, the role of LNR in young GC patients has not yet been elucidated. Furthermore, various cutoff values of LNR for GC have been proposed: 0.1, 0.2 40 ; 0.1, 0.2524,25,27; 0.1, 0.4 38 ; 0.2, 0.6 41 ; 0.25, 0.5 42 ; 0.3, 0.6 36 ; and 0.4, 0.8. 29 Therefore, it is difficult to apply the predictive value of LNR to staging criteria. In this study, we determined the LNR cutoffs of 0.1 and 0.25 and distributed young patients with GC from the SEER database into different subgroups based on the LNR. As expected, multivariate survival analysis showed that the LNR was a remarkable independent prognosticator for both OS and CSS in our cohort. Patients in the high-risk LNR group had remarkably unfavorable OS (HR = 2.173, 95% CI: 1.149-4.108) and CSS (HR = 2.197, 95% CI: 1.142-4.227) compared with those in the low-risk LNR group. As such, LNR can serve to identify the survival risk in young patients with GC, which may facilitate the development of personalized therapy programs.
Findings from our study observed that not only LNR, but also T stage, race, surgery, together with chemotherapy were obviously associated with the prognosis of young patients with stage I-III GC. Based on the multivariate model, the novel nomograms created for such a specific population found that LNR had the third greatest contribution to prognosis and was predictive of OS and CSS. The LNR-based nomograms for OS and CSS had higher C-index values in the training and validation cohorts than did the traditional AJCC TNM staging criteria. Meanwhile, the time-dependent ROC curves detected better specificity and sensitivity of the nomograms and indicated a clear prognostic advantage of LNR-based models over the TNM stage. Furthermore, calibration plots of the nomograms performed well with the ideal model, while DCA and IDI analyses indicated reliable clinical utility of the novel nomograms. Additionally, we found the significance of different total scores generated by the nomograms on survival using the Kaplan–Meier method. All of these results underscored that our comprehensive LNR-based nomograms achieved clinical outperformance and discriminating superiority over the current TNM criteria, suggesting the application of these nomograms with the potential to provide accurate insights into personalized survival evaluation in young patients with GC.
This study has several limitations. First, the present study was a population-based study capturing data from national registry, but the detailed information on extent of lymph node dissection (D1 or D2) was limited. Extent of lymph node dissection is especially important because of significant differences regarding numbers of dissected nodes between D1 and D2 in previous reports. Information about systemic therapy and measurement of response to treatment was also not presented, thereby influencing the detailed real-world outcomes for young patients with GC and the prognostic power of the nomograms. Second, a high proportion of patients had distant metastatic disease and the lymph node dissection might be influenced, although our study tried to construct nomograms to reduce the risk of stage migration. Third, there was no consensus regarding the cutoffs for the LNR even though different cutoff values had been proposed. In the present study, we determined the LNR cutoffs of 0.1 and 0.25, and found the LNR to be the independent prognostic factor. The results of this study may not be appropriate for other studies. The most optimal cutoffs for young patients with GC should be further investigated. Finally, it is essential to conduct further external validation analyses to ensure the availability of the nomograms, and additional prospective studies combined with other indicators are encouraged to improve these models.
Despite these limitations, the present study has also many strengths. To our knowledge, it is the first to note the independent prognostic value of LNR in young patients with stage I-III GC and develop predictive LNR-based nomograms for such specific population. These nomograms are intuitive, quantitative, and convenient to use. The implications of our study is well-timed. An optimal model is indeed of great significance for determining the suitable therapeutic schedule and follow-up scheme for every stage of the disease. Although the current AJCC TNM staging is the most frequently used system, findings from our study showed a clear clinical advantage of these simple-to-use nomograms over it. These results may be regarded as a basis for prospective research and affect the clinical treatment options for young GC patients.
Conclusion
Two novel LNR-based models have been developed and confirmed for prediction of OS and CSS in young patients with stage I-III gastric cancer. These convenient and reliable nomograms might serve to improve the accuracy of survival risk prediction, identify the high-risk patients, and provide insights into the suitable treatment strategies and surveillance schemes.
Footnotes
Abbreviations
Acknowledgments
The authors thank the National Cancer Institute for providing the SEER data.
Author Contributions
Yi-Ru Chen and Zhen-Yi Tian performed the data extraction, statistical analysis, literature investigation, and drafted the manuscript. Mei-Qian Wang performed the statistical analysis and revised the manuscript. Mei-Ling Sun and Jin-Zhen Wu assisted in data acquisition and validation. Xin-Ying Wang supervised the literature investigation, statistical analysis, and reviewed the manuscript. All authors read and approved the final manuscript.
Availability of Data and Materials
The datasets used and/or analyzed during the current study are available from the corresponding author on reasonable request.
Declaration of Conflicting Interests
The authors declared no potential conflicts of interest with respect to the research, authorship, and/or publication of this article.
Ethics Approval
All patient data extracted and case lists constructed from the SEER database, are anonymous and shared, without containing any identifiers. For this reason, this study was exempted from the approval by the institutional review board of Zhujiang Hospital of Southern Medical University. The reporting of this study conforms to RECORD guidelines. The contents of this article are data mining from the SEER database. The SEER database is open and shared. The data released from the SEER database did not require informed patient consent because cancer is a reportable disease in every state in the US.
Funding
The authors received no financial support for the research, authorship, and/or publication of this article.