
Abstract
Keywords
Introduction
Cone-beam computed tomography (CBCT) has been widely used for patient positioning in radiation therapy (RT), and CBCT-based dose calculation has attracted increasing attention.1,2 CBCT images comprise essential anatomical information about patients, embodying changes in anatomical structures during treatment; these changes lay a vital foundation for individual adaptive radiation therapy (ART).3,4 Setup errors, respiratory movement, organ movements, and shrinkage will cause dose differences during RT delivery. 5 Therefore, in precise RT, it is essential to evaluate the factors that may cause the dose variation in the treatment process and adequately determine whether re-planning is necessary. 6 Through the rigid or deformable image registration between CBCT and kilovoltage computed tomography (kVCT), the dosimetric changes due to the patient weight loss can be evaluated to determine the re-planning necessity.7‐9
The kVCT and CBCT modalities differ significantly in several aspects, such as the equipment's physical structure, the image acquisition parameters, and the image reconstruction techniques, resulting in discrepancies in image quality and Hounsfield unit (HU) values. The quality of CBCT images is more susceptible to the size of scanning sites, the target volume’s (TV's) density, and the adjacent tissues around the tumor.10,11 Related topics have been widely considered in recent years, including whether the CBCT-based dose calculation accuracy can meet the clinical demand and how to improve the accuracy for actual patients. Scholars have tried various correction methods,12‐15 including deformable registration methods,16,17 machine learning and deep learning methods.18‐20 Richter et al 21 found that the HU value of CBCT images (Elekta XVI system) directly correlated with the scanning conditions. For different tumor sites, appropriate correction strategies should be considered regarding the accuracy of CBCT-based dose calculations. The dose differences between CBCT- and kVCT-based calculation have been reported to be 14.5% ± 10.4% for the standard CT curve, 1.4% ± 2.4% for the phantom, 1.3% ± 2.3% for all patients, and 1.5% ± 2.5% for head patients. Dunlop et al 22 evaluated the accuracy of 2 dose calculation methods (physical scattering correction and density coverage methods) in CBCT for head and neck sites. They also evaluated and verified the accuracy of the results obtained by the density distribution method for the CBCT plans using the RayStation treatment planning system (TPS). The average dose difference caused by all CT calibration methods was less than 1%, and the scattering correction method was shown to have the best (0.5%) results. Hu et al 23 studied the dose calculation accuracy for the CBCT images of head and neck cancer patients; they used the HU-value referring to the physical density (HD) curve matching method. The resulting differences were all less than 1%. Zhang et al 24 reduced the difference between intensity-modulated radiation therapy (IMRT) plans for nasopharyngeal carcinoma (NPC) patients with CBCT- and kVCT-based treatment plans to less than 2%. This study was conducted using the approximate correction method of the HD curve for CBCT images of NPC patients. Kurz et al 25 used cycleGAN to correct the CBCT-based treatment plan in dose calculation, which improved the dose calculation accuracy for volumetric modulated arc therapy (VMAT) treatment plans. The passing rates were 100% and 89%, respectively, with 2% and 1% dose difference criteria. The above studies show that methods used to identify a more accurate and rapid method for dose calculation in CBCT images can differ.
This study aimed to evaluate the feasibility of and compare 2 CBCT dose calculation methods for head and neck cancer patients in clinical practice. One corrected the HU value of CBCT based on protocol-specific CBCT HD curve, and the other based on histogram matching (HM). Corrective methods for HU values were investigated based on our previous study, 26 and the guidance and challenges for clinical implementation were discussed.
Materials and Methods
Patient Data
The medical ethics committee of the Chinese PLA General Hospital approved this study (S2016-122-01), and all methods were performed under relevant guidelines and regulations. The requirement for informed consent was waived with the ethics committee's approval, given that patient anonymity was ensured.
Twelve histologically proven locoregionally advanced hypopharyngeal cancer patients treated with Clinac iX (Varian, USA) in our hospital were randomly selected and used to conduct retrospective studies. All patients underwent kVCT scanning with a slice thickness of 3 mm on a Siemens CT system (SOMATOM Definition AS, Germany). During the imaging process, the patients were immobilized with a thermoplastic head-and-shoulder mask in the supine position and a head-and-shoulder immobilization board. The CT images were transmitted into an Eclipse (Version 10.0) workstation. The enhanced CT, MRI, or PET-CT images were also included and fused to guide the contouring of the TVs and organs at risk (OARs). Each patient received a total of 33 fractions RT. The prescription dose was given 70 Gy to the gross tumor volume (GTV), and positive lymph nodes (pGTVnx and pGTVnd were formed by expanding the corresponding GTV and nodes with a margin of 3-5 mm), and 60 Gy to the high-risk planning target volume (PTV). Finally, VMAT plans with 2 entire arcs were optimized via the RapidArc technique. These plans were delivered for the patient's treatment.
CBCT Image Acquisition
The CBCT images of patient cases were acquired using the on-board imager (OBI) system. The CBCTs were scanned in the half-fan mode for 9 cases with a large FOV to include the shoulder region. The CBCTs of the remaining 3 cases were scanned in full-fan mode. All the images were reconstructed with a 3 mm slice thickness. To exclude the dose calculation deviation caused by the changes in patient anatomical structure during the treatment, we utilized the CBCT images acquired at the first treatment fraction as a correction basis.
CBCT Dose Calculation and Evaluation
In-house ART system software was developed and used in this study. This software contains modules for rigid registration (RR), deformable registration, and dose mapping. The registration module was designed based on a widely used open-source Elastix registration tool. 27 Figure 1 shows the ART system's registration graphical user interface (GUI).

The registration interface of the in-house ART software.
Deformable registration between CBCT and kVCT
The planning CT images, anatomical structure files, planning parameter files, and dose files of the treatment plan, including the CBCT images acquired at the first treatment fraction, were saved in DICOM (Digital Imaging and Communications in Medicine) format. They were imported into the in-house ART system. And then, the CBCT images were rigidly registered to the corresponding kVCT images by matching the bony structures; in this process, only translation and rotation were considered. The RR results were verified by visual checking of an experienced physician. If necessary, further manual adjustments would perform. Afterward, based on the RR result, the CBCT image was further deformably registered to the kVCT image based on the B-spline deformation model. The software applied a multi-resolution registration strategy with the B-spline grid spacing set to 32, 16, and 8 mm. As the scanning range of CBCT was much smaller than kVCT in the superior-inferior direction, a registration region of interest was manually set on the strength of kVCT to decrease the discrepancy. The mutual-information similarity metric was applied for both rigid and deformable registration, and it was optimized using the adaptive stochastic gradient descent optimizer. The registration result was visually examined by fusing the deformed CBCT to kVCT images, and it was adequate for all studied cases. The resulting deformation fields were used for deforming the CBCT images into the space of the kVCT image.
CBCT correction based on HU-density curve and HM
Images of the electron density phantom (Model 062M, CIRS, USA) were acquired under standard dose head (SDH), high-quality head (HQH), pelvic and low dose thorax (LDT) settings. RW3 solid water of 5 cm thickness was added to the front and back of the CIRS phantom to avoid unwanted scattering artifacts due to the lack of enough compensation material. 14 The phantom images acquired were transmitted into the TomoCon PACS3 system (TatraMed, Bratislava, Slovak Republic) and saved in DICOM format. With this software tool, the mean and standard deviations of HU values for plug-ins of different materials were obtained, and the HD curves for each clinical scanning condition (SDH, HQH, pelvis, and LDT) were also created, as shown in Figure 2. Corrected CBCT images were obtained by mapping the HU values of CBCT to physical density using the HD curve of the CBCT and then mapping the resulting density to kVCT HU based on the HD curve of the kVCT as shown in Figure 3. The resulting kVCT images were named CBCTHD in the following.
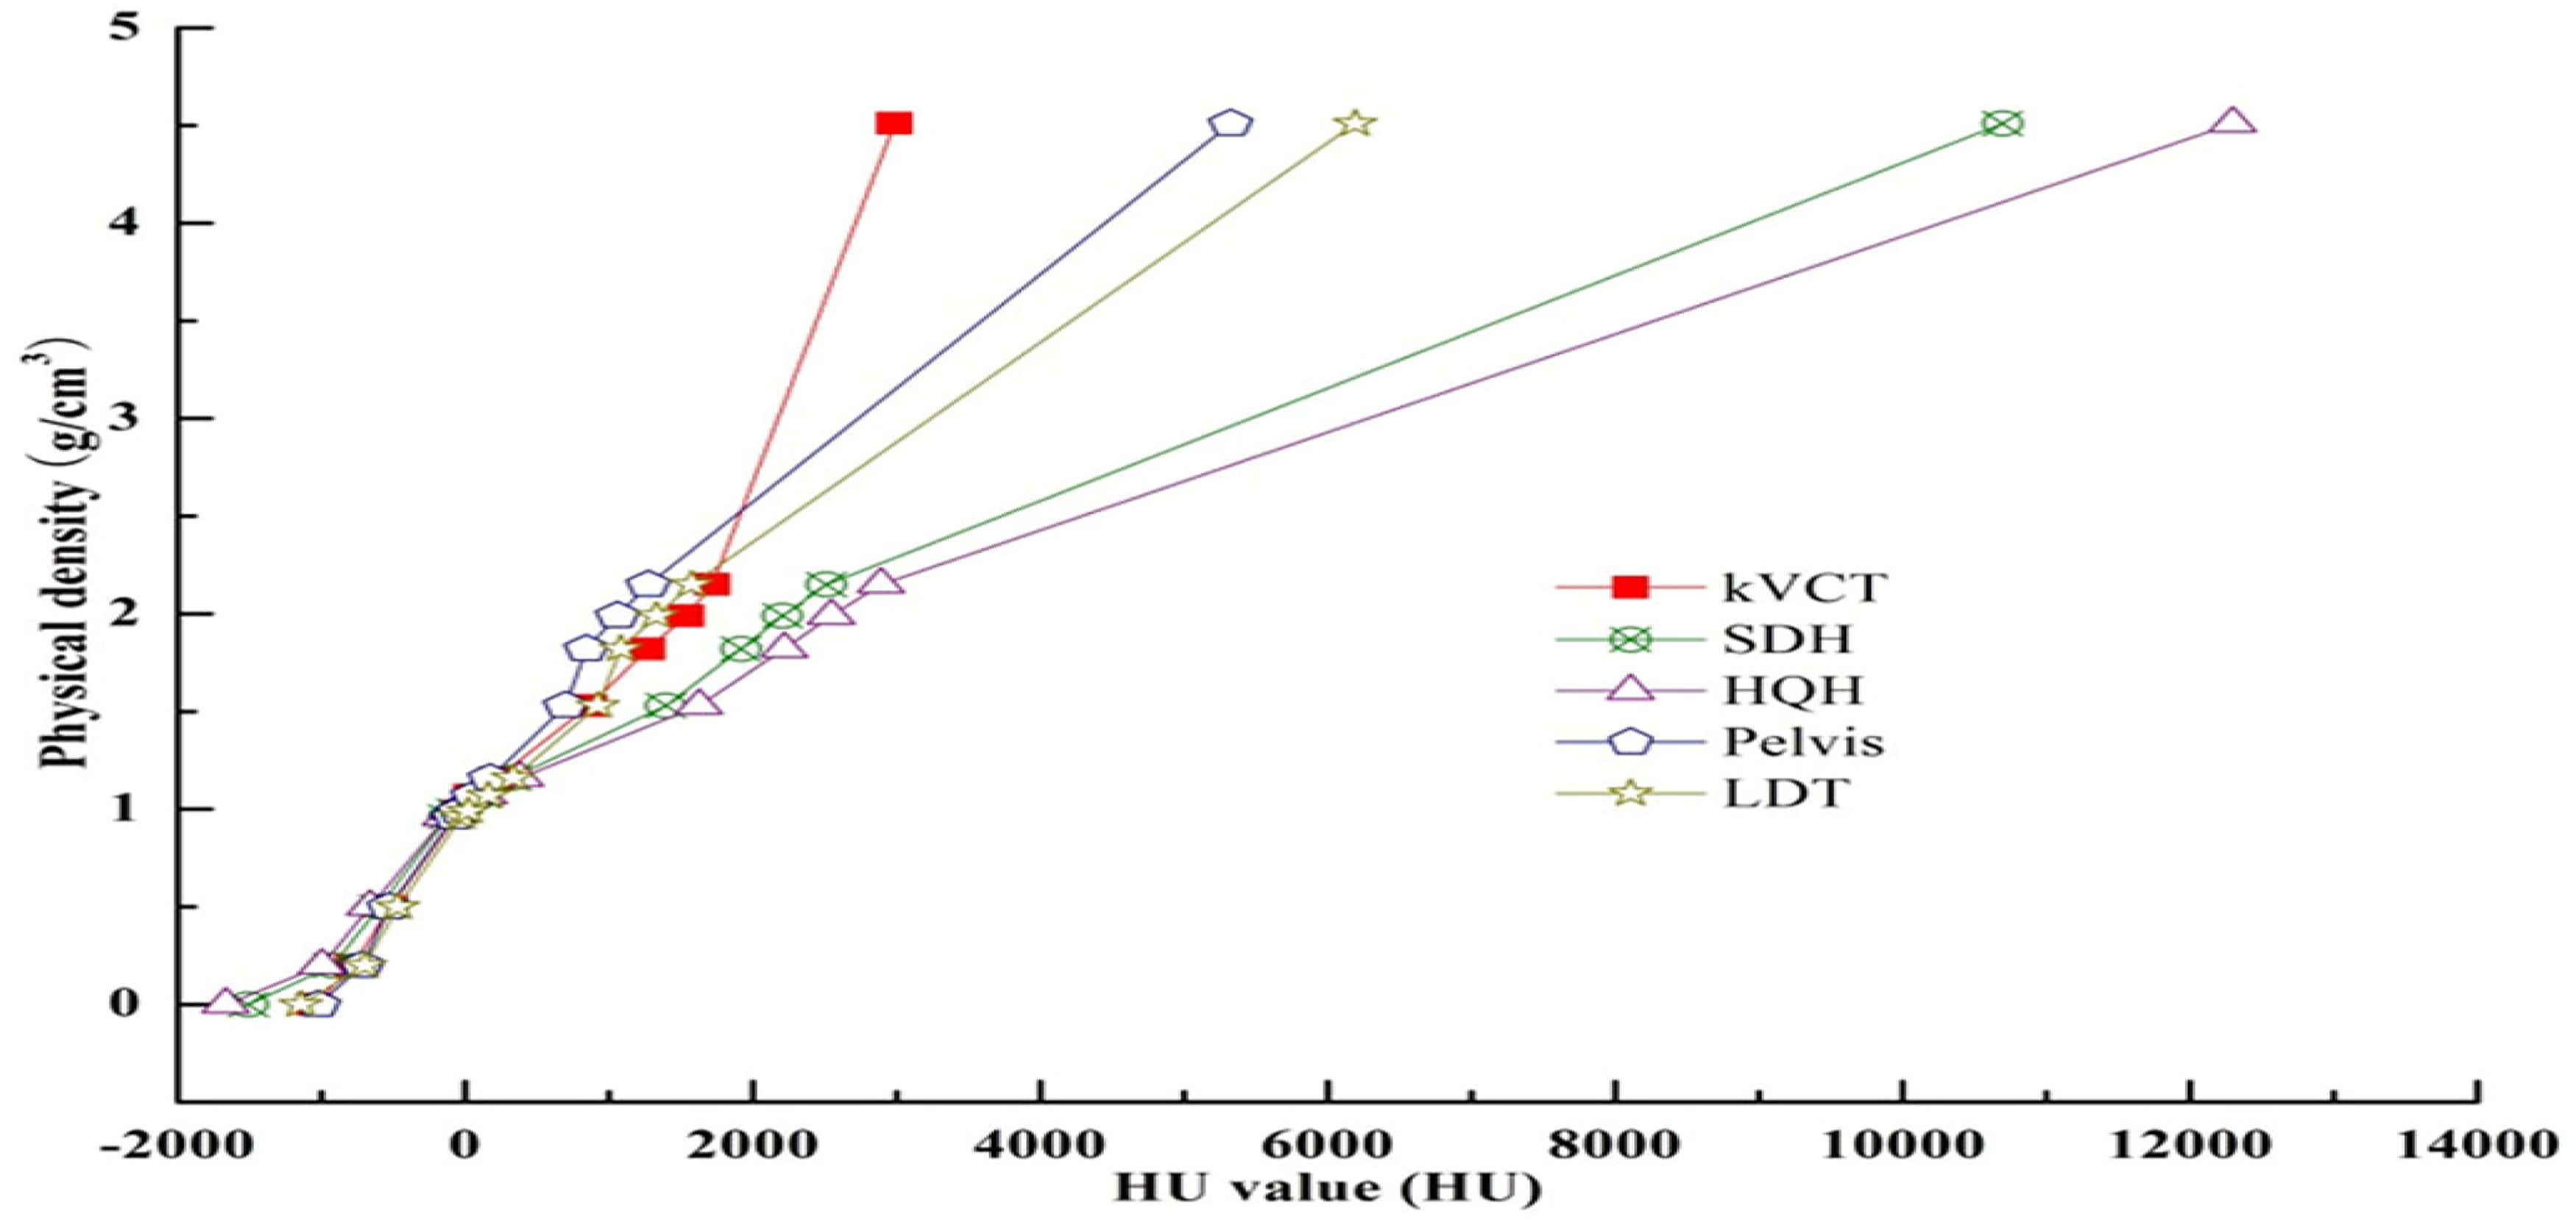
HU-electron density conversion curves under different scanning conditions. An optional titanium rod core insertion with a physical density of 4.51 accounts for extraordinarily high HU values.
Another set of corrected CBCT images was generated by HM. Based on the integral histogram of the HU values of kVCT images, CBCT HU values were modified to produce the new CBCT images. After modification, the histograms of the kVCT and CBCT images were matched at 7 quantile values. 28 The resulting corrected images were named CBCTHM in the following.
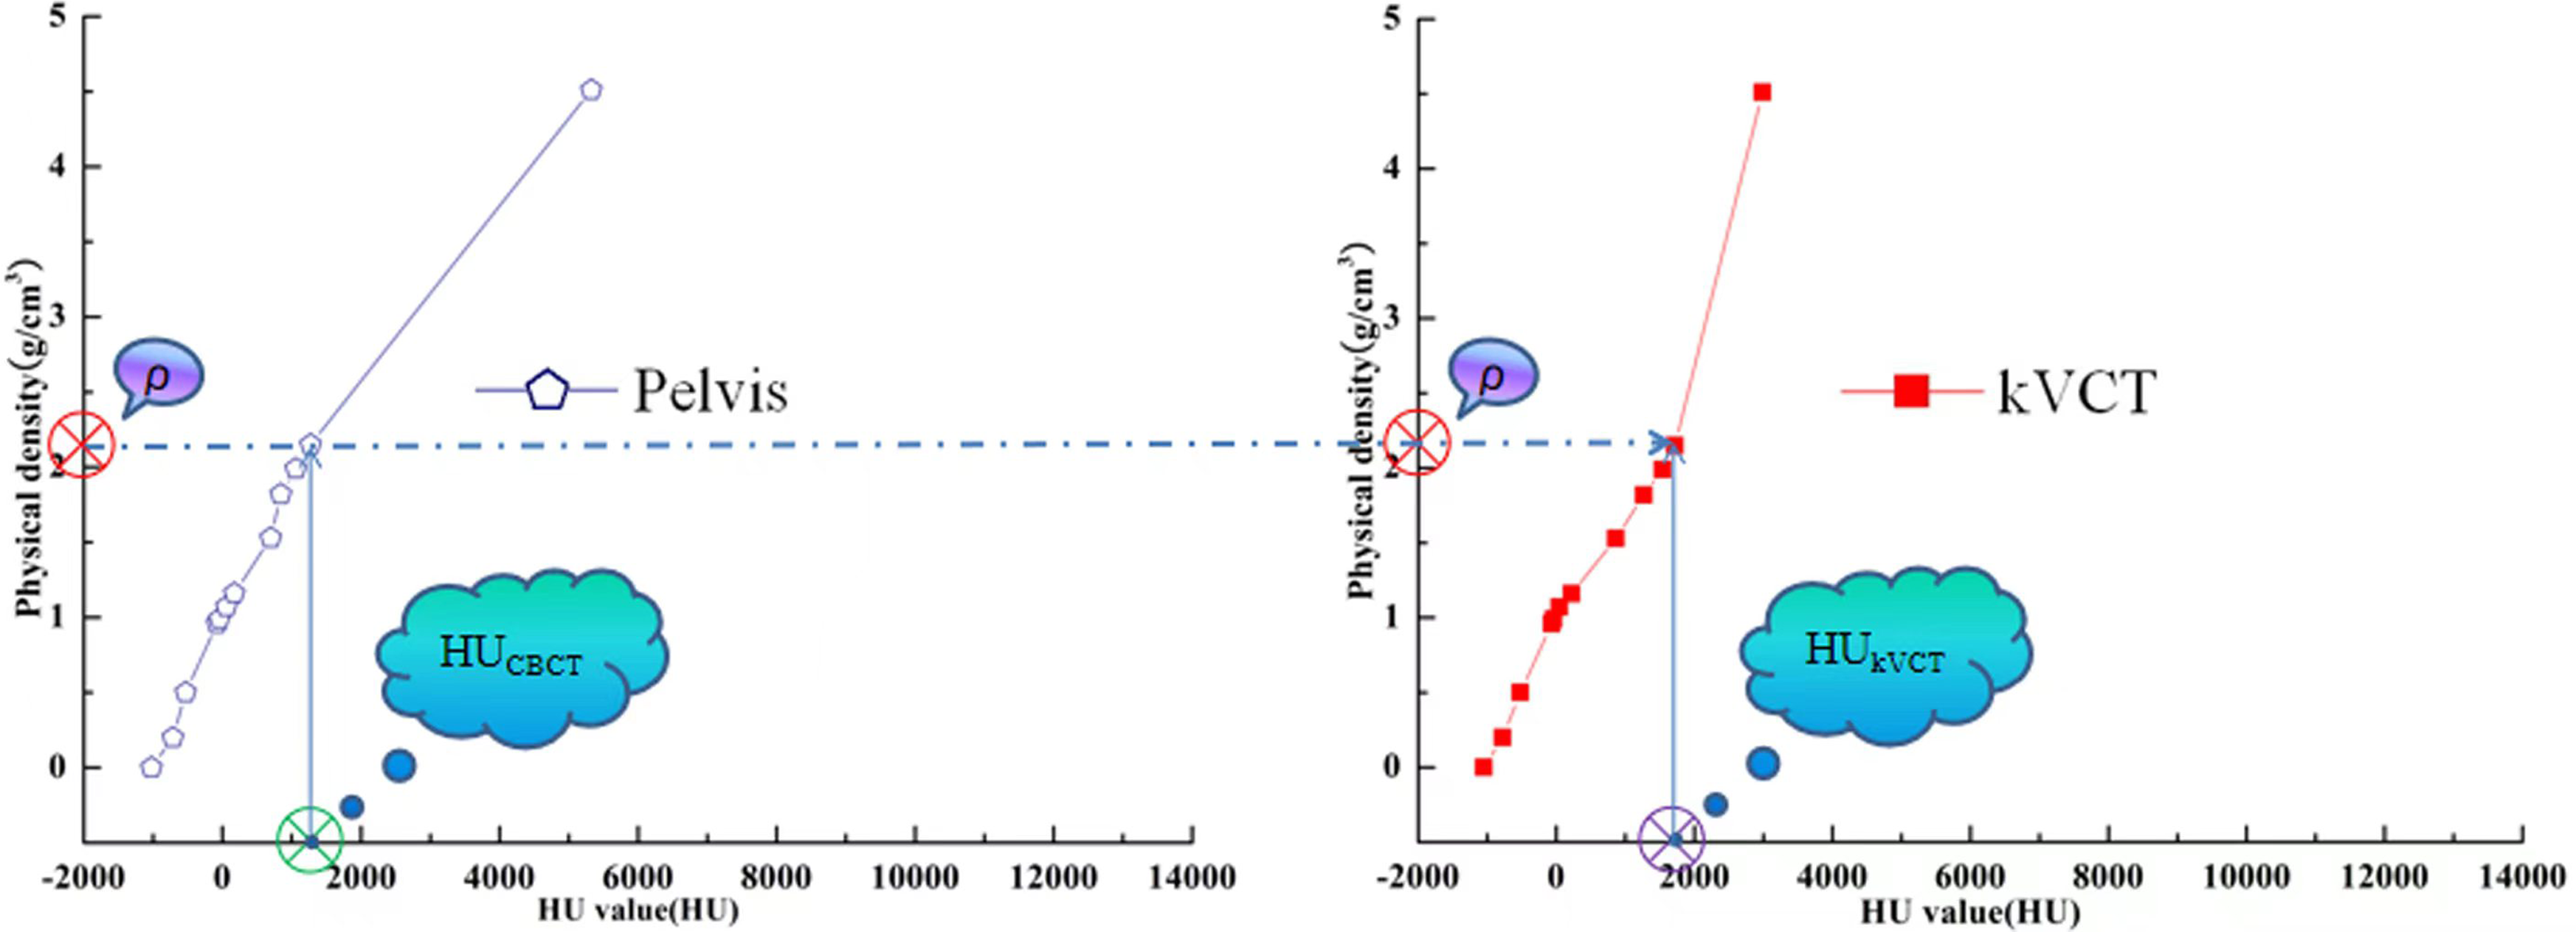
Schematic diagram of conversion between HU values of CBCT(HUCBCT) and its corresponding kVCT(HUkVCT).
Dose calculation and comparison
Due to the small size of FOV in the superior-inferior direction, CBCT cannot acquire enough tissue information for dose calculation. To address this issue, the CBCTHD and CBCTHM were padded with the kVCT at the bottom and the top to provide missed anatomy information and thus to fully consider the scattered dose and reduce the dose calculation deviation in CBCTHD and CBCTHM.
The generated CBCTHD and CBCTHM images, along with the planning parameter and organ structure files of RT plans, were imported into the Eclipse planning system (Varian, USA). The same dose calculation algorithm was utilized to compute the CBCTHD and CBCTHM plan doses using the HD curve of kVCT images. The 2 CBCT plan doses were compared with those of the original plans in respect of the dosimetric parameters: Dmean, Dmax, D5%, D95%, V95%, and V100% for the targets, and Dmean, Dmax, D2%, and Vx for the OARs.
The images and dose distribution data of kVCT, CBCTHD, and CBCTHM, were finally imported into the Computational Environment for Radiological Research (CERR) (Version 5.1) (developed by the University of Washington) for analysis. The kVCT dose distribution was employed as the golden standard; the CBCTHD and CBCTHM results were quantitatively evaluated through the γ analysis with criteria of 3%/3 mm and 2%/2 mm with a dose threshold of 5%.
Statistical Analyses
Statistical analyses (paired t-test) were performed in SPSS 17.0 (SPSS Inc., Chicago, IL, USA). Dosimetric parameters and γ analysis were used to evaluate the 2 different dose calculation methods on CBCT-based plans with a P-value <.05.
Results
Analysis of Dose Distribution
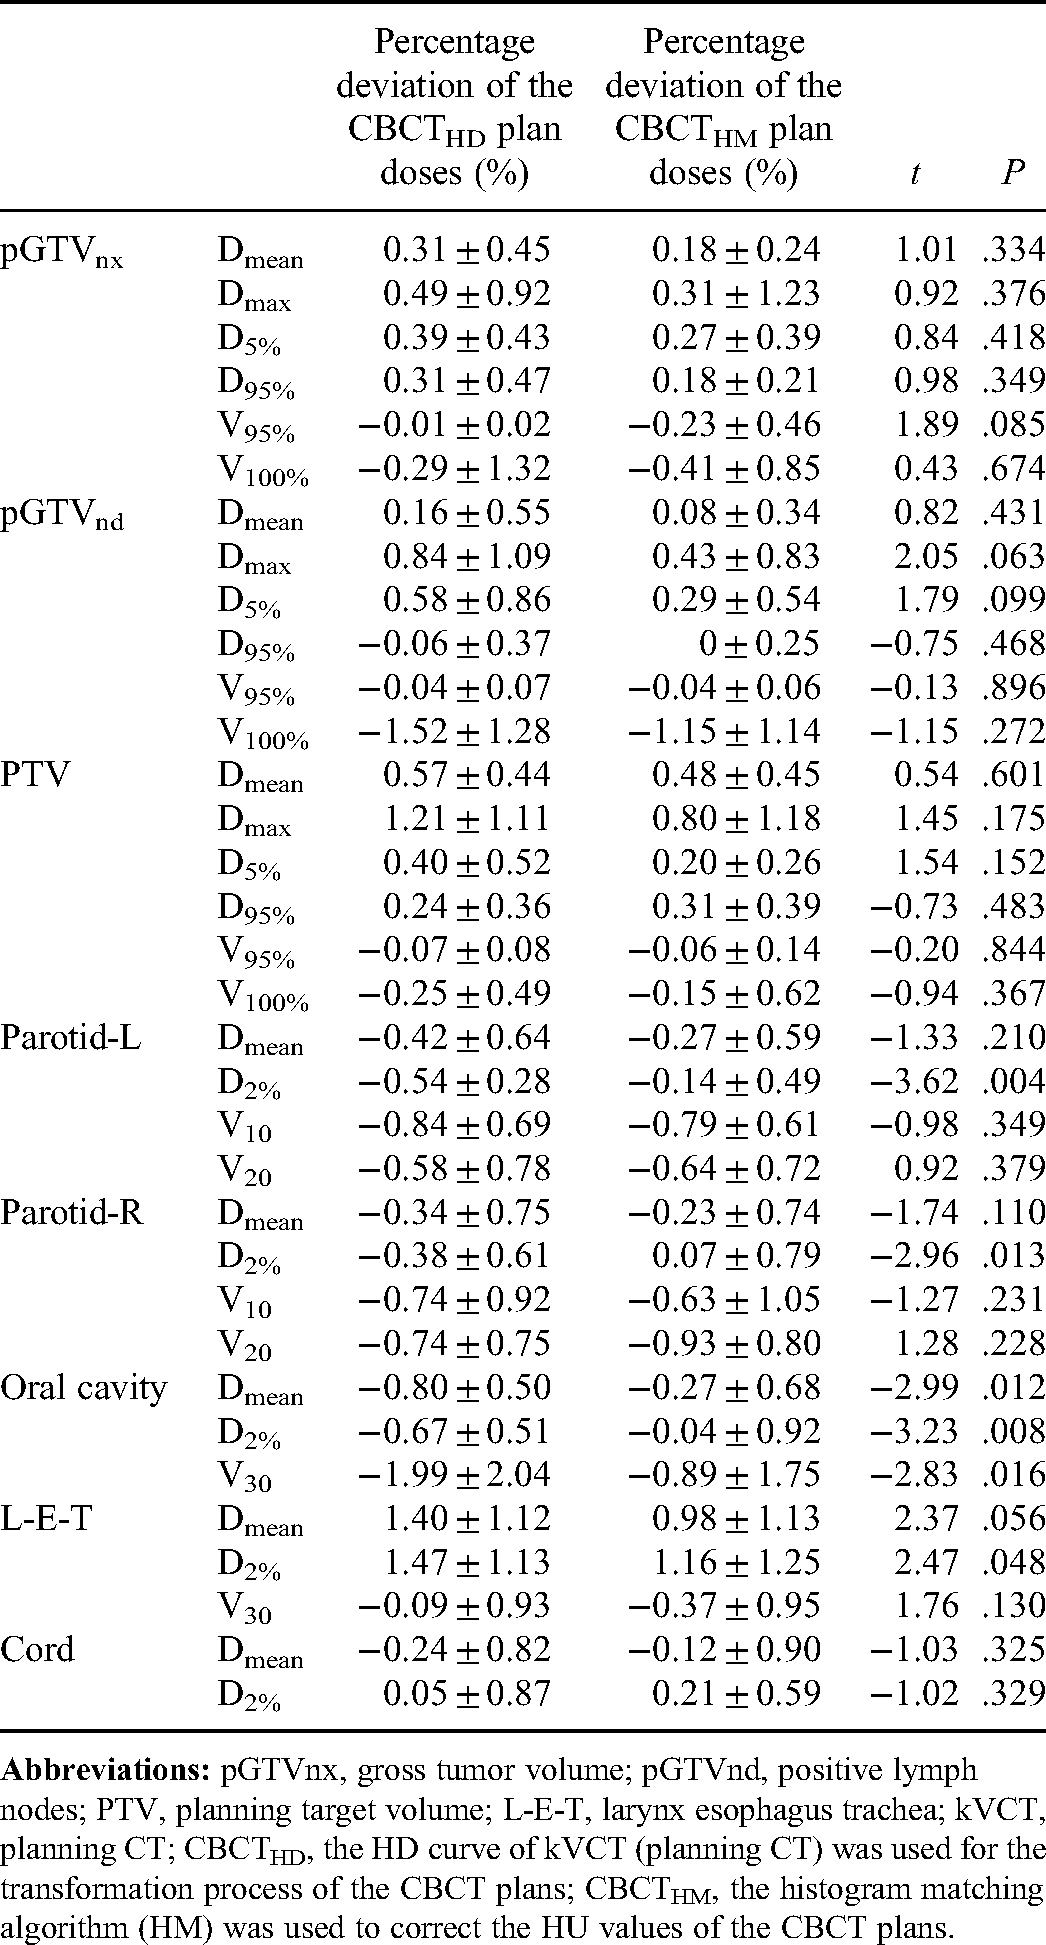
The Dmean, Dmax, and D5% for the TVs (pGTVnx, pGTVnd, and PTV) of CBCTHD and CBCTHM plan doses were higher than those of the kVCT doses in all 12 patients. However, the deviations were less than 2%. CBCTHM plan doses were closer to kVCT plan doses than CBCTHD plan doses, but the difference was insignificant. The TV V95% and V100% values of CBCTHD and CBCTHM plan doses were less than those of the kVCT plan doses, but there were no significant differences. The deviation of V100% for pGTVnd was relatively significant compared with other TVs, at −1.52% and −1.15% for CBCTHD and CBCTHM plan doses, respectively.
The Dmean, V10, and V20 for the left and right parotid glands (parotid-L and parotid-R) of the CBCTHD and CBCTHM plan doses were smaller than those of kVCT plan doses. There was no significant difference between CBCTHD and CBCTHM plan doses. However, D2% of CBCTHM plan doses was significantly less than D2% of CBCTHD and closer to kVCT plan doses (p = .004 and .013 for parotid-L and parotid-R, respectively). HM-based CBCT correction provided better results of the plan's Dmean, D2%, and V30 compared with the HD-based calibration for the oral cavity, and the advantage is not negligible. On the other hand, the differences in the Dmean and V30 values of the larynx-esophagus-trachea (L-E-T) were not statistically significant. However, the D2% values of the CBCTHM plan dose were closer to those from kVCT images, which was statistically significant (p = .048). Compared with other parallel organs, only the parameters of Dmean and D2% were analyzed for the serial organ (the spinal cord). In summary, using the above 2 methods to correct CBCT images for planning provides an insignificant outcome. Details are shown in Table 1. Figures 4 and 5 show the dose-volume histograms (DVHs) and dose distribution of kVCT, CBCTHD, and kVCTHM plan doses of a typical case in full-fan and half-fan scanning modes, respectively.

Dose-volume histograms of kVCT, CBCTHD, and CBCTHM plan doses for a representative case in half-fan scanning mode.

Dose distribution of kVCT (left column), CBCTHD (middle column), and CBCTHM (right column) doses for a representative case in half-fan scanning mode.
The Percentage Deviation (Mean ± Std) of the CBCTHD and CBCTHM Plan Doses About the kVCT Plan Doses for Different Dosimetric Parameters, Along with the t and P Values of the Paired t-test between the Deviations of CBCTHD and CBCTHM Plan Doses.
Gamma Analysis Results
Tables 2 and 3 show the γ passing rates for all 12 patients at 3%/3 mm and 2%/2 mm criteria, respectively.
The γ Passing Rates (Mean ± Std) of the 2 Methods at 3%/3mm Criterion, Along With the t and P Values of the Paired t-test Between the Passing Rates of the CBCTHD and CBCTHM Plan Doses.

t could not be calculated since the standard error of the difference is 0.
The γ Passing Rates (Mean ± Std) of the 2 Methods at 2%/2 mm Criterion, Along With the t and P Values of the Paired t-test between the Passing Rates of the CBCTHD and CBCTHM Plan Doses.

t could not be calculated since the standard error of the difference is 0.
For pGTVnx and pGTVnd in all patient plans, regardless of whether the 3%/3 mm or 2%/2 mm criterion was applied, the average γ passing rates of the CBCT plan doses obtained by the HM and HD methods relative to those of kVCT plan doses were both higher than 96%, and there were no significant differences between them. For PTV, the γ passing rates of CBCTHM and CBCTHD plan doses were higher than 98% at 3%/3 mm. The passing rates dropped at the 2%/2 mm criteria but almost achieved 93%. There was no significant difference between the 2 methods at both criteria.
For OARs in all patient plans, the γ passing rates of CBCT plan doses obtained by HM and HD methods relative to those of kVCT plan doses were higher than 99.99% at the 3%/3 mm criterion and reached higher than 93% at 2%/2 mm criterion. There were no significant dose differences between the 2 methods for all OARs.
Discussion
Comparing the dosimetric parameters of the targets and OARs, the mean deviation between the CBCTHD and CBCTHM plan doses was less than 1%. Taking kVCT plan doses as a reference, the γ passing rates for 2 CBCT plan doses at 2%/2 mm criterion were comparable. The tissues and organs of the head and neck contain dense substances such as air and bones; due to the relatively large density difference, it tends to produce streak artifacts and noise in the image. However, the HD curve used in the dose calculation was mainly based on fitting a specific density plug-in, which could not accurately reflect the tissues with different densities, resulting in a specific deviation. The accuracy of CBCT plan dose calculations using phantom calibration curves was no better than that using patient-specific or population-based CBCT curves. 21 Kong et al 29 suggested using DIR and HU override methods for volume delineation and dose computation: DIR could facilitate auto segmentation, while HU override could mainly be used to overcome the lower CBCT image quality.
This study used the Elastix registration tool to achieve rigid and deformable image registration in the in-house ART software. The efficacy of the registration tool was widely verified. 27 Also, the registration outcomes were visually evaluated for each data group in this experiment. Since it was difficult to match all images with any registration methods, image registration deviations caused unavoidable sources of error in the sequential dose calculation. Different deformable algorithms and parameters can lead to some deformation errors. 30 This study re-calculated the dose distribution using the HM and HD methods for each case in the same deformed CBCT images. By analyzing, we found that the registration accuracy affects the results of this work slightly.
Compared with the HM method, the HD method required more time to scan the phantom to make the curves of the CBCT image. In addition, dose calculation accuracy was more susceptible to image artifacts and individual differences in patient images, leading to unavoidable errors in the dose calculation process. Schröeder et al 31 investigated the effect on the dose calculation of a beam-shaping device used to reduce scattering. Consequently, the median γ passing rate was improved by 10.0% to 15.0%. In this study, all CBCT images were acquired with the Varian Clinac OBI system, with inferior image quality compared to newer systems by the same vendor, such as the TrueBeam and Halcyon kV CBCT systems. Moreover, more data, especially images with significant anatomical changes, might need to be added as a control group for validation in future studies. Artifact correction before CBCT calibration and DIR could improve the dosimetric accuracy by up to a 6.3% gamma passing rate. 32
The dose calculation accuracy was acceptable using the HU modification method (HM) based on CBCT images. This way of dose calculation is more convenient for adaptive radiotherapy. HU modification using the histogram-matching algorithm for the artifacts caused by high-density substances and air in CBCT images can reduce the dose deviation. 33
A deep convolutional neural or cycle-consistent generative adversarial network is also feasible to generate synthetic CT images based on CBCT images.18,19,25,34,35 Most scatter artifacts of CBCT images could be removed 36 while the HU values were corrected to a certain extent. The promising results have been reported with different deep learning models (γ passing rates at 1%/1 mm improved from 88.2% to 96.3% 37 and from 94.5% to 99.0% 38 ).
Conclusion
This study compared the dose calculation accuracy after correction of the CBCT using the HM and HD methods. The mean deviations between CBCTHM and kVCT plan doses were less than 1%, while the maximum value of deviations between CBCTHD and kVCT plan doses was 1.47% (L-E-T: D2%). Concerning dose distribution similarity, the γ passing rates of CBCTHM-based plans relative to kVCT plan doses were higher than those of CBCTHD plan doses at the criterion of 2%/2 mm. In conclusion, the dose distribution deviations of CBCTHM, CBCTHD, and kVCT plan doses are not vastly different, proving that kVCT and CBCT hold a similar performance to be used for dose calculation. The calculated dose distribution all meet clinical application requirements. Based on the specific data set and implementation of this study, the CBCT images corrected by the HM method are more appropriate for RT planning utilization. These findings could guide us in selecting a more suitable method of CBCT correct method for adaptive radiotherapy of head and neck cancer patients.
Footnotes
Abbreviations:
Author contributions
Each author has participated sufficiently in the work to take public responsibility for appropriate portions of the content. SX designed the study and modified the paper. HG, XD, CX performed the study and analysis. BL developed software for adaptive radiation therapy. GZ was responsible for guiding the work. BQ and BC provide the patients’ images. HG wrote the manuscript, and all other authors contributed to the manuscript and approved the final version.
Declaration of Conflicting Interests
The author(s) declared no potential conflicts of interest with respect to the research, authorship, and/or publication of this article.
Ethics Statement
This study was approved by the Ethics Committee of the Chinese PLA General Hospital (approved no. S2016-122-01).
Acknowledgment
This work was partially supported by a grant from the National Key R&D Program (2017YFC0112105) and the National Natural Science Foundation of China (61601012) and the authors thank Dr Yongbao Li for CBCT image data processing.