
Abstract
Keywords
Introduction
The prolonged survival of multiple myeloma (MM) in recent years allows extensive disease evolution leading to the emergence of more aggressive clones of myeloma cells independent of bone marrow microenvironment. These myeloma cells are able to invade extramedullary organ or tissues and survive, causing the development of extramedullary disease (EMD), which portends dismal prognosis.1,2 EMD can occur either at the new diagnosis of MM or at disease progression or relapse. A multicenter retrospective study including 176 patients with EMD reported progression-free survival and overall survival (OS) for EMD at diagnosis was 38.9 months and 46.5 months. 3 Given the presence of malignant plasma cells in pleural effusion outside bone marrow, myelomatous pleural effusion (MPE) is considered as a manifestation of EMD, reported in<1% of MM patients.4,5 Byun et al 5 reported MPE accounted for 8.8% in the whole MM patients with pleural effusion, stressing the importance of watching out for MPE when MM patients develop pleural effusion. Besides, some reports described MPE to be associated with an inferior prognosis to MM without extramedullary infiltration.5–7 Given the reported median survival of 2.8 to 4 months in MPE, 8 shorter than the reported OS of EMD, we speculated MPE was possibly associated with distinct clinical features and worse outcomes compared to not only MM without EMD, but also MM with other sites of EMD. To address this hypothesis, we conduct this retrospective study to describe and compare the clinical features, laboratory parameters, treatment response, and prognosis between patients with MPE and other locations of EMD.
Material and Methods
Patients and Design
A total of 498 patients newly diagnosed as MM at our institution from January 1, 2010 to December 31, 2020 were reviewed consecutively and 63 patients were diagnosed with EMD. Nine patients were excluded due to lack of indispensable clinical data, 10 patients were excluded due to follow-up lost, and 2 patients were excluded due to the presence of other malignant tumors. Finally, 42 MM patients with EMD either occurred at the diagnosis of MM or in disease relapse or progression were enrolled, including 13 patients with MPE and 29 patients with other sites of EMD except for MPE (EM-other). Additionally, 84 patients, individually matching 42 EMD patients at a ratio of 1: 2 with compatible age (difference within 5 years), same International Staging System (ISS), and similar general condition, were selected from those who didn't develop EMD as the paired control cases (42: 84 patients in total). MM was diagnosed according to the 2014 International Myeloma Working Group criteria. 9 EMD was defined as soft-tissue plasmacytomas that result from hematogenous spread (EM-soft tissue, EM-s) and occur due to direct growth from skeletal tumors following cortical bone disruption (extramedullary-bone related, EM-b). 10 Plasma cell leukemia was excluded from the definition of EMD. 10 MPE was defined as pleural effusion with the presence of malignant plasma cells. All the enrolled patients with pleural effusion received diagnostic thoracentesis. Cytology examination or flow cytometry was used to evaluate the presence of myeloma cells inside effusions or not. Other locations of EMD were evaluated and confirmed mainly by imaging technologies, among which 23 patients were diagnosed by positron emission tomography/computer tomography (PET/CT) and 6 patients were diagnosed by magnetic resonance imaging. ISS was used to determine the clinical stage of MM. Therapy responses were evaluated using the 2016 International Myeloma Working Group consensus criteria. 11 Fluorescence in situ hybridization (FISH) analyses were performed on CD138-sorted plasma cells from bone marrow to screen common cytogenetic abnormalities. Baseline characteristics include age, gender, anatomic locations of EMD, M-protein type, light chain type, ISS stage, when to develop EMD, the percentage of bone marrow plasma cells, multisites of EMD, high-risk cytogenetics and laboratory results consisted of hemoglobin, serum calcium, lactate dehydrogenase (LDH), serum creatinine and β2-microglobulin (β2-MG) were collected. When to develop EMD was indicated by either at the diagnosis of MM or in disease progression or relapse. Multisites of EMD were defined as at least 2 sites of extramedullary soft-tissue plasmacytomas. High risk cytogenetics consisted of del(17)(p13), del(13)(q14), 14q32 disruption and 1q21 gain. Besides, treatment regimen, treatment response, objective remission rate (ORR), OS and survival under EMD were collected. ORR was defined as the rate of patients achieving partial remission (PR), very good PR, complete remission (CR) and stringent CR. Time from confirmation of MM to death or last follow-up was defined as OS. Survival from the onset of EMD is important and generally instruct treatment strategy in clinical practice. Therefore, the interval from onset of EMD to death or last follow-up was defined as survival under EMD and analyzed as well. This is a retrospective study. The informed consent for collecting patient details was obtained from each patient or their relative. All patient details in this study have been anonymized. All procedures performed in this study were conducted in accordance with the Declaration of Helsinki. The reporting of this study conforms to Strengthening the Reporting of Observational Studies in Epidemiology guidelines. 12
Statistical Analysis
Data were described by absolute and relative frequencies of categorical variables and median (min–max) for quantitative variables. Statistical differences of baseline characteristics between different groups and subgroups were assessed using t-test for continuous variables conforming normal distribution, otherwise Mann–Whitney U test, Fisher's exact test or for categorical variables, and Mann–Whitney U test for ordered categories. Survival analysis was conducted using the Kaplan-Meier method. Statistical significance of differences in survival was assessed using the log-rank test. Multivariate analysis using cox proportional hazards model was performed to assess the significance of MPE as an independent predictive factor of survival. Statistical analysis was performed using SPSS Statistical (IBM Corporation Version 22.0). P value<.05 was considered statistically significant.
Results
Locations and Types of EMD
Among 42 patients enrolled in this study, 13 patients were MPE, accounting for 31.0%. Cytologic assessment identified myeloma cells inside pleural effusion in 11 patients, but not observed myeloma cells in the other 2 patients who were subsequently reported 10.2% and 84.66% of myeloma cells in flow cytometry. Overall, 8 of 13 patients with MPE received flow cytometry evaluation, reporting 2.4% to 89.7% of myeloma cells, Table S1. Bilateral, left-sided and right-sided effusions were revealed in 11 patients, 1 patient and 1 patient respectively. Four patients had associated pleural or chest wall plasmacytomas on CT chest, but no pulmonary parenchymal lesions were observed. Five patients had additional plasmacytomas (ie, skin, abdominal lymph node, paraspinal, stomach, spleen). No masses were observed in 4 patients with MPE. Malignant pericardial effusion and peritoneal effusion were identified in 1 patient and 3 patients respectively. Twenty-nine patients were EM-other, accounting for 69.0% of the whole cohort. Seventeen patients (58.6%) were EM-s, 8 (27.6%) patients were EM-b and 4 patients (13.8%) developed both. Soft tissue, pleural effusion, spleen, lymph node and gastrointestinal tract were the first 5 common sites of EMD in this study which were listed in Table 1. Twenty-six patients (61.9%) were accompanied by EMD at diagnosis of MM and the other 16 patients (38.1%) developed EMD in disease progression or relapse. MPE existed at the diagnosis of MM in 7 patients (53.8% in MPE), whereas the other 6 (46.2% in MPE) developed MPE at progression or relapse. Single-site involvement was found in 15 patients (35.7%), only 2 of which were MPE patients. Whereas multisites involvement was disclosed in 27 patients (64.3%), 11 of which were MPE patients.
Anatomic Locations of Extramedullary Disease (EMD).

Baseline Clinical Characteristics
Baseline features of patients with and without EMD were listed in Table S2. As a result of case-control match, age, sex, ISS, and type of M protein/light chain were well balanced. More specifically, within the group of EMD patients, baseline clinical characteristics were compared between MPE and EM-other, listed in Table 2. The median age was 61 (52-80) for MPE and 62 (44-83) for EM-other group. Gender in the 2 groups was well balanced. All the MPE were exudate with elevated LDH (358IU/L, 77-105IU/L) in effusion. Light chain type was κ in 7 (53.8%) patients and λ in 6 (46.2%) patients with MPE. The cytologic, flow cytometric, and immunohistochemical results of malignant plasma cells in pleural effusion and concurrent bone marrow were compared and listed in Table S1, which identified the clonal consistency of myeloma cells between pleural effusion and bone marrow and therefore fully confirmed the diagnosis of MPE. Notably, a higher level of β2-MG was revealed in the group of MPE (84.6% vs 44.8%>5.5 mmol/L, P = .041) compared to EM-other with statistical significance, which indicated heavier tumor burden. Besides, compared to EM-other, more advanced disease stage was also revealed in MPE group as more patients were staged as ISS III (76.9% vs 44.8%, P = .016) and developed multisites of EMD (69.2% vs 38%, P = .036). FISH test was conducted on 9 MPE patients and 26 EM-other patients. The percentage of patients presenting all-negative results in FISH was higher in the group of EM-other although without significant difference (42.3% vs 33.3%, P = .636). Furthermore, the frequency of each mutation was higher in MPE group (33.3% vs 15.4%, Pdel(17)(p13) = 0.246; 44.4% versus 23.1%, Pdel(13)(q14) = 0.221; 55.6% versus 46.2%, P14q32 disruption = 0.627; 66.7% versus 34.6%, P1q21 gain = 0.094), but no significant difference was established neither, as shown in Figure 1. All the other variables listed in Table 2 were evenly distributed between the 2 groups without significant differences.

Incidence of high-risk cytogenetic abnormities between MPE cohort and EM-other cohort by Fluorescence in situ hybridization test. Abbreviations: EM-other, other sites of extramedullary disease; MPE, myelomatous pleural effusion.
Baseline Clinical Characteristics.

Abbreviations: ISS, International Staging System; EMD, extramedullary disease; BMPCs, bone marrow plasma cells; UNL, upper limit of normal; FISH fluorescence in situ hybridization; Ig, immunoglobulin.
others = IgD, IgM, Bi-clonal, Nonsecretory.
Multisites of EMD were defined as at least 2 sites of extramedullary involvement.
High-risk cytogenetics included deletion(17)(p13), deletion(13)(q14), 14q32 disruption and 1q21 amplification.
Cytogenetics was evaluated by FISH test which was conducted on 9 patients with myelomatous pleural effusion and 26 patients with other EM.
Induction Treatment and Response
Within the group of patients without EMD, Dexamethasone plus proteasome inhibitor (Bortezomib [BD]), immunomodulator (Thalidomide [TD] or Lenalidomide) or both was administrated on 61 (72.6%), 1 (1.2%) and 19 (22.6%) patients respectively as induction therapy. In total, 2 (2.4%) patients received traditional combined chemo-therapy (vincristine, adriamycin, and dexamethasone, VAD). The other 1 patient (1.2%) received daratumumab plus BD-melphalan-prednisone. Within patients with MPE, in combination with Dexamethasone, 9 (69.2%) accepted BD (regimen), 1 (7.7%) received TD and 1 (7.7%) adopted both simultaneously (TVD) as initial therapy. The remaining 2 patients (15.4%) received VAD regime (Figure 2A). Eight patients (61.5%) achieved ORR in the group of MPE, among which 5 patients (38.5%) received BD, 2 patients (15.4%) received VAD and 1 patient (7.7%) received TD (Figure 2A). In the group of EM-other, BD and TD were prescribed on 24 (62.1%) and 2 patients (6.9%) respectively combined with Dexamethasone. Among those patients who were treated with BD and dexamethasone, 6 patients (20.7%) received Lenalidomide simultaneously (RVD). One patient (3.4%) received VAD. The other 2 patients (6.9%) didn't accept induction therapy (Figure 2B). Eighteen patients (62.1%) who accepted induction therapy attained ORR in this group, among which 12 patients (41.4%) received BD, 5 patients (17.2%) received RVD, and 1 patient (3.4%) received VAD, Figure 2B. No statistically significant difference in ORR was disclosed between MPE and EM-other group (61.5% vs 62.1%, P = 0.804), which was consistent with the published literary works. In addition, 11 MPE patients received thoracic drainages.

Treatment regimen and response of (A) myelomatous pleural effusion and (B) other sites of extramedullary disease.
Outcomes and Survival
The date cut-off for this analysis was June 2021. Median follow-up was 55.8 (95% CI 48.6-63.0) months for patients without EMD and 70 months (95% CI 39.4-100.6) for EMD patients. Thirty-eight patients (45.2%) without EMD and 24 patients with EMD (57.1%) died within follow-up. Median OS was 60.6 months in patients without EMD versus 35.0 months in patients with EMD (P = .045), 27.0 months in patients with EMD at the diagnosis of MM (P = .026) and 37.0 months in patients who developed EMD at disease progression or relapse (P = .259), as shown in Figure 3. Within the group of EMD patients, 11 (84.6%) with MPE and 13 (44.8%) with EM-other died within the follow-up. Median OS in MPE group was shorter than EM-other group with statistical significance (13.0 vs 37.0 months, P = .029), as shown in Figure 4A. Subgroup survival analysis was conducted to further describe the distinct outcomes of the 2 groups. Median OS in patients with MPE at the diagnosis of MM (MPE at diagnosis) was much shorter than EM-other at the diagnosis of MM (EM-other at diagnosis) (11.5 vs 29.5 months, P = .003), as shown in Figure 4B. By the contrary, no significant difference was disclosed in median OS between patients with MPE and EM-other which occurred at disease progression or relapse (MPE at progression, EM-other at progression) (43.3 vs 37 months, P = .246), as shown in Figure 4C. Additionally, given that some published literary works have reported survival of EM-b was significantly longer than EM-s and no difference of prognosis between MM with EM-b and without EM was observed,13–15 we moved to the comparison of OS between MPE and EM-s, eliminating the patients only developing EM-b. The group of MPE disclosed the significantly shortened OS compared with the group of EM-s (13 vs 37 months, P = .041), as shown in Figure 5A. Similarly, a shorter OS was observed in MPE at diagnosis than EM-s at diagnosis with statistical significance (11.5 vs 37 months, P = .035), as shown in Figure 5B. No significant difference was disclosed in OS between MPE and EM-s at progression (43.2 months vs 35 months, P = 0.411), Figure 5C. To determine the prognostic implications of different therapy responses to EMD patients, OS of the group which attained ORR was compared to that which didn't reach to ORR, revealing objective remission portended a better prognosis (56 vs 13 months, P = .007), as shown in Figure 6. Moreover, the survival under EMD of patients with MPE decreased markedly compared with EM-other (7.5 vs 37 months, P < .001) and similarly, survival under EMD in MPE decreased compared to EM-s (7.5 vs 37 months, P < .001), as shown in Figure 7.

Kaplan–Meier curves showing overall survival compared between patients (A) with and without extramedullary disease (EMD), (B) without EMD and with EMD existed at the time of diagnosis, and (C) without EMD and with EMD occurred at disease progression or relapse.

Kaplan–Meier curves showing overall survival compared between patients with (A) MPE and EM-other, (B) MPE and EM-other existed at the time of diagnosis, and (C) MPE and EM-other occurred at disease progression or relapse. Abbreviations: EM-other, other sites of extramedullary disease; MPE, myelomatous pleural effusion.
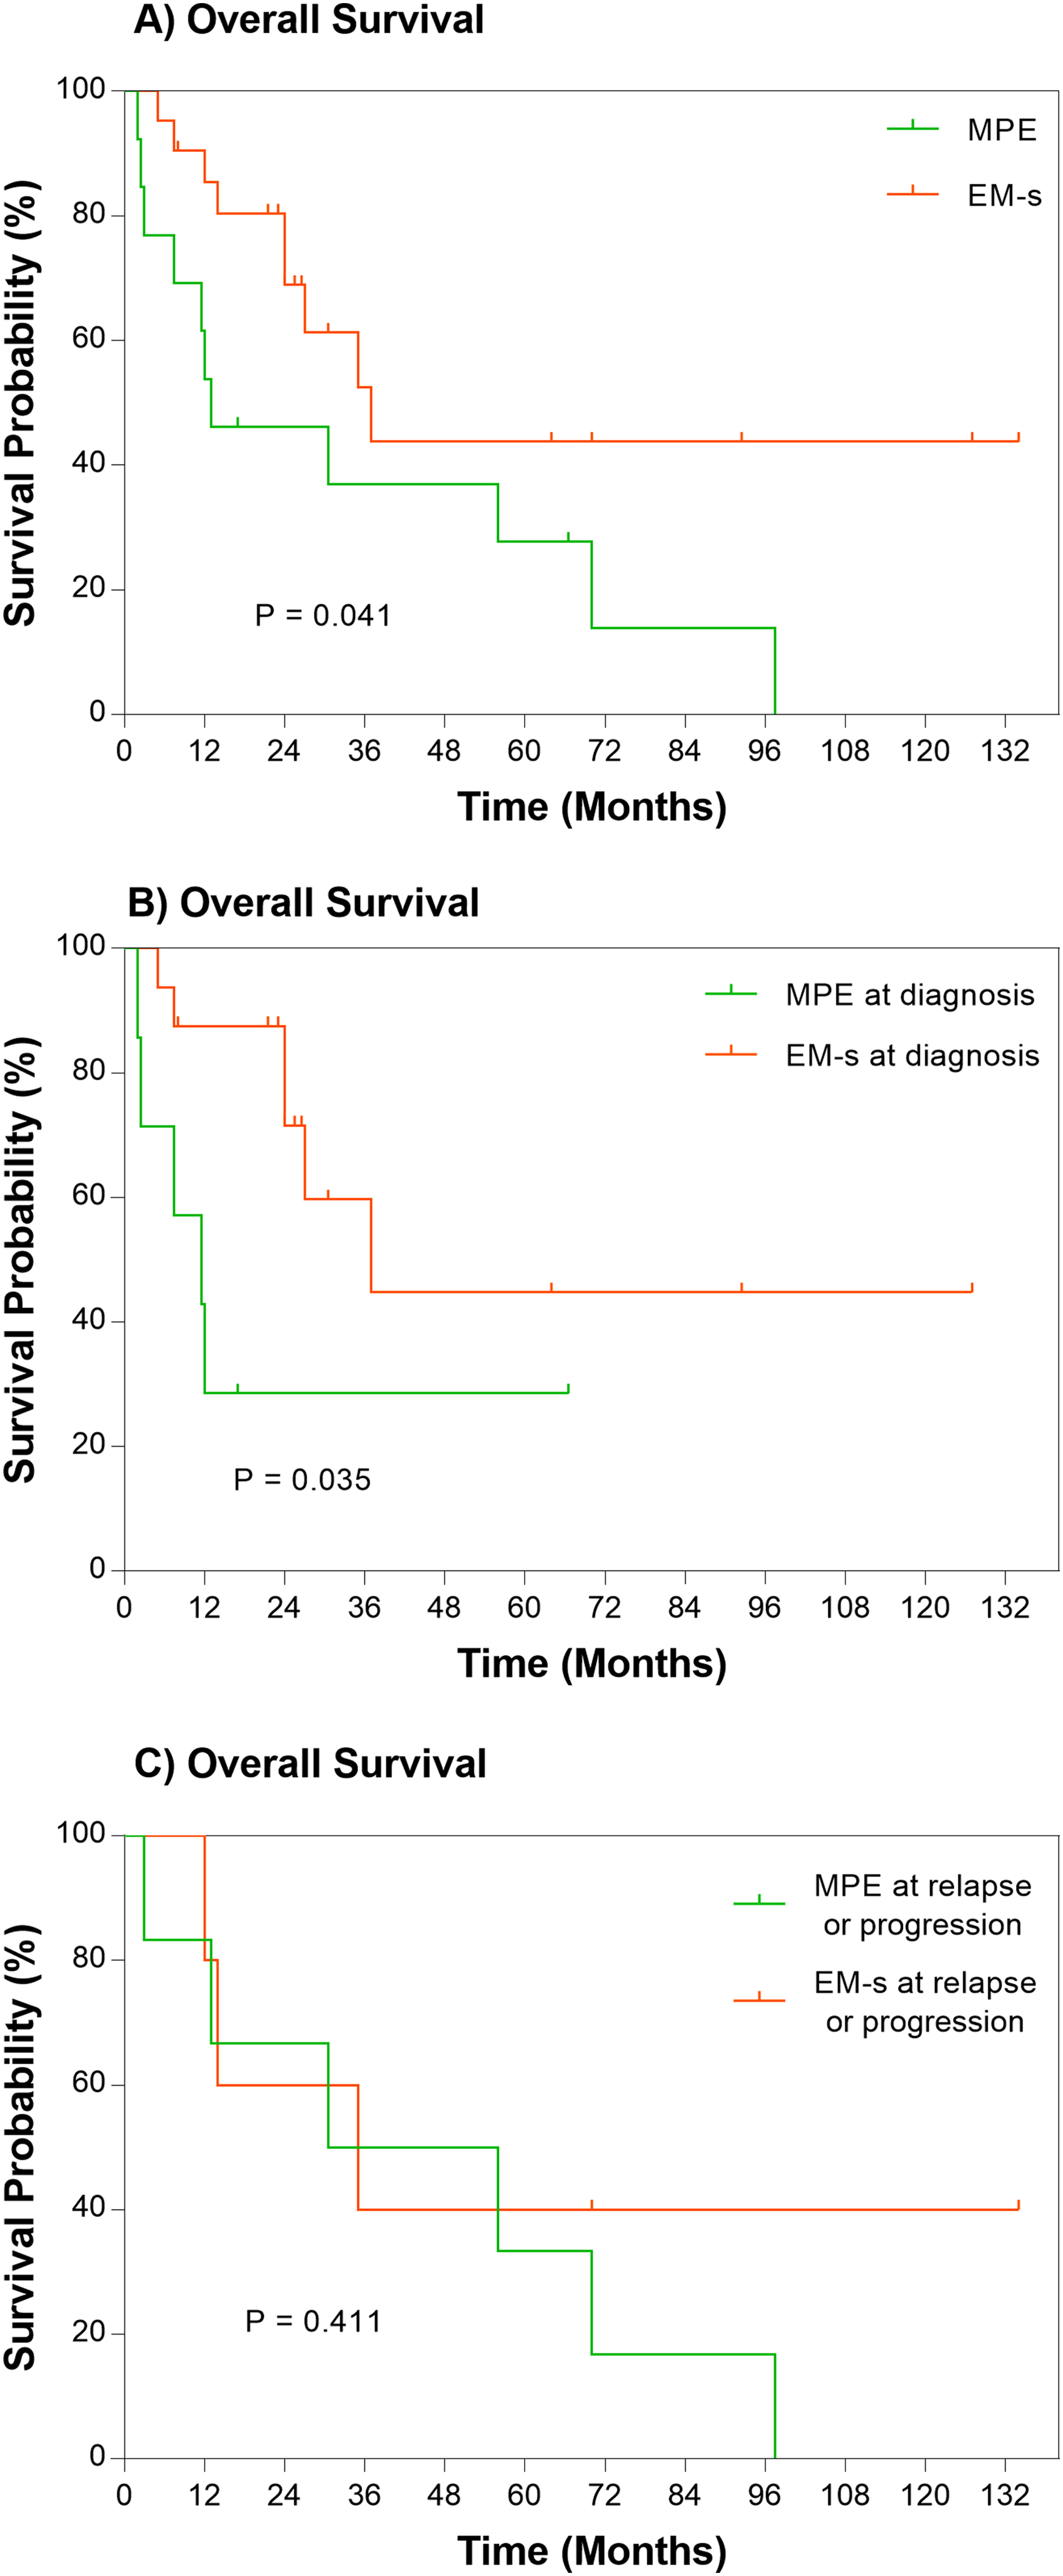
Kaplan–Meier curves showing overall survival compared between patients with (A) MPE and EM-s, (B) MPE and EM-s existed at the time of diagnosis and (C) MPE and EM-s occurred at disease progression or relapse. Abbreviations: MPE, myelomatous pleural effusion; EM-s, extramedullary disease in soft tissue or organs.

Kaplan–Meier curves showing overall survival compared between patients who attained and didn't attain objective remission.

Kaplan–Meier curves showing survival under EMD compared between patients with (A) MPE and EM-other, (B) MPE and EM-s. Abbreviations: MPE, myelomatous pleural effusion; EM-s, extramedullary disease in soft tissue or organs; EM-other, other sites of extramedullary disease.
Some known prognostic factors such as ISS stage and cytogenetic parameters have been reported to be different between MPE and EM-other groups although without statistical significance. Therefore, a multivariate model was used to adjust for possible confounding factors. MPE was disclosed as an independent prognostic indicator of OS (HR 2.669 [1.132-6.293], P = .025) and survival under EMD (HR 5.136 [2.117-12.459], P < .001). Besides, β2-MG (HR 1.172 [1.025-1.340], P = .020) and treatment response (HR 4.962 [1.810-13.601], P = .002) were also identified with independent prognostic significance of OS. For survival under EMD, therapy response was revealed as an independent prognostic factor (HR 3.585 [1.431-8.891], P = .006). Multivariate model results were shown in Table 3.
Multivariate Analysis on Survival.

Survival under EMD was defined as time from onset of EMD to death or last follow-up.
Objective remission included partial remission, very good partial remission, complete remission, stringent complete remission.
Discussion
MPE is rare and the available data describing its incidence, clinical features and prognosis is limited. Most published studies are case reports or descriptive studies.5,6,8 Due to imaging techniques were not routinely conducted on MM patients to detect EMD as well as the technical limitations of imaging methods, the reported incidence of EMD might be underestimated. 10 Similarly, diagnostic thoracentesis was not performed on every MM patient who developed pleural effusion. Malignant plasma cells may experience clonal evolvements and differ in appearances, which may incur miss-identification of their plasma-cytic origin, especially if low in number. However, flow cytometry was not routinely conducted on effusion if cytologic negative, the underestimation of MPE also possibly exists. As we have indicated that patients with MPE might be more advanced with higher tumor burden, more aggressive clones of myeloma cells independent of bone marrow microenvironment are possible to emerge. Similar to other types of EMD, MPE may result from direct pleural infiltration of myeloma cells from adjacent pulmonary or chest wall lesions, hematogenous spread and or lymphatic obstructions.
EMD has been demonstrated as an independent adverse prognostic factor in MM patients by previous studies and those developed EMD at the diagnosis of MM (EMD at diagnosis) portends worse outcomes.10,14 Our study also showed a consistent result that OS of patients without EMD was longer than patients with EMD, especially concurrent EMD at diagnosis. Kamble et al 6 (2005) reported median survival was 4 months from onset of MPE and 24 months from initial diagnosis of MM. Another single center analysis of 23 MPE patients revealed the progression free and OS were 5.7 and 11.7 months from diagnosis of MM. 7 The real word experience and review of literature revealed the median survival from 2.8-4.0 months even under active treatment. 8 MPE may be associated with dismal outcomes, but the efficacy of novel agents in the management of MPE has not been reported. In this study, most patients with MPE adopted proteasome inhibitor in combination with thoracic drainages and revealed OS of 13 months from initiation of MM and 7.5 months from the onset of MPE, which seems slightly longer than previous reports. Worse outcomes of MPE patients were observed compared to EM-other patients, especially survival from onset of MPE decreased remarkably. The result of the survival comparison of MPE to EM-s furtherly supported the disclosure of its inferior outcomes. Additionally, MPE was indicated as an independent adverse prognostic factor in EMD patients. Similarly, central neural system (CNS) involvement in MM has also been disclosed with an extremely dismal prognosis, with median OS ranging from 2 to 47 months.10,16,17 These findings, therefore, indicated the prognostic effect of heterogeneity among EMD in different anatomic locations, which stressed the importance of adopting individualized treatment strategy. Deng et al (2015) reported EMD at diagnosis, rather than EMD at disease progression, was an independent adverse prognostic factor in MM. 14 Consistently, our study found MPE at diagnosis had worse outcomes than EM-other at diagnosis, but no difference between MPE and EM-other at progression or relapse, which reminded us to more focus on the initial presentation of myeloma and consider to take more active therapy promptly.
Subsequently, it deserves investigating what is likely to result in poor prognosis of MPE. Kamble et al 6 (2005) reported a significant increase in β2-MG (median: 8.9 mg/L) and LDH (median: 620 IU/L) at the time of MPE compared with the initial presentation of myeloma. Similarly, another single-center study reported 69.5% of MPE patients presented elevated β2-MG (≥5.5 mg/L). 7 Moreover, in the case of comparison to EMD-other, a greater percentage of MPE patients (84.6%), with the level of β2-MG higher than 5.5 mg/, was also revealed in our study. Β2-MG is normally regarded as a tumor burden indicator, which showed heavier tumor burden held by MPE. Additionally, the higher percentage of patients in MPE group was observed presenting with ISS stage III and multisites of EMD also indicated more advanced disease condition. Consequently, heavier tumor burden and more advanced disease conditions might contribute to the dismal outcome. Besides, it has been reported the frequency of high-risk chromosomal aberrations was higher in EMD patients, with del(17p) (40%) and t(4;14) (45%) the most frequent.18–20 We observed the proportion of patients who presented high-risk mutations was higher in the group of MPE although no significant difference which was possibly attributed to the limited sample size. It was indicated worse cytogenetic phenotype might incur shorter survival of MPE patients as current consensus defines both del(17)(p13) and gain(1q) as high-risk cytogenetics in MM resulting in poor outcome.21,22 Last but not least, intravenous chemical and novel drugs might lead to low drug concentration inside the pleural cavity and thus made it difficult to eliminate malignant plasma cells. Some cases reported that chemotherapy combined with intrathoracic injection of interleukin 2 or interferon α attained a proven curative effect, achieving a remission duration of up to 30 months. 7 The intrathoracic injection is likely to overcome the low drug concentration and improve prognosis. More studies are warranted to investigate its efficacy and safety.
Response rate was disclosed to be similar in patients conventionally treated irrespective of the presence or absence of EMD.1,23 Similarly in our study, no statistical difference was disclosed in ORR between MPE and EM-other (61.5% vs 62.1%, P = .804). Consequently, there was no evidence to support that the dismal outcomes of MPE attributed to adverse therapy response, notwithstanding patients who reached to objective remission had a longer survival than those not. However, 1 possible reason elucidating the similar ORR is that, for EMD evaluation, current response criteria only contain the assessment of size and metabolic uptake of solid soft-tissue plasmacytoma by imaging techniques such as PET/CT, nevertheless not taking the change of serous membrane fluid volume into consideration. 11 Consequently, it could be considered that treatment response may not capable to reflect the exact degree of improvement for patients with MPE. A recent review on EMD also expected to adopt the liquid biopsy in assessment to help further ensure disease eradication in all compartments. 10 From another perspective, at the presence of similar ORR and shorter survival, the duration of remission in MPE might be shorter and active interventions were suggested even in the case of better response after initial treatment.
There were several limitations in the present study. First, given that CNS involvement presented extraordinary worse outcomes,10,16,17 EM-other group in our study didn't include patients with CNS involvement. Therefore, the prognosis of EM-other might be overestimated. Second, the sample size was inadequate without enough power. The result should be further verified by expanding the sample size. Lastly, beyond the primary disease, some common complications such as heart failure and respiratory failure may present due to the physical constrictions of large pleural effusion after MPE occurred, which contribute to poor outcomes. Therefore, patients with a small amount of pleural effusion without compression or relief of compression by chest drainage might be the target population in subsequent studies.
Conclusion
MPE may adversely affect the prognosis of patients with EMD independently. Survival of MPE was found to be significantly shorter than EM-other as well as EM-s regardless of therapy. More active therapy was possibly recommended even with a good initial response as the duration of remission might be shorter. MPE patients presented heavier tumor burden including higher ratio of ISS stage III and higher level of β2-MG as well as multisites of extramedullary infiltration, which might contribute poor outcomes.
Supplemental Material
sj-docx-1-tct-10.1177_15330338221132370 - Supplemental material for Clinical Characteristics and Prognosis of Multiple Myeloma With Myelomatous Pleural Effusion: A Retrospective Single-Center Study
Supplemental material, sj-docx-1-tct-10.1177_15330338221132370 for Clinical Characteristics and Prognosis of Multiple Myeloma With Myelomatous Pleural Effusion: A Retrospective Single-Center Study by Liang Gao, BS, Junhui Xu, MD, Weiwei Xie, BS, Bingjie Wang, MD, Xinan Cen, MD, and Mangju Wang, MD in Technology in Cancer Research & Treatment
Footnotes
Abbreviations
Authors’ Note
Liang Gao and Weiwei Xie are medical doctor candidates. Junhui Xu, Bingjie Wang, Xinan Cen and Mangju Wang are medical doctors.
Acknowledgments
The authors thank all the patients included in this study and their relatives for allowing us to publish this article.
Declaration of Conflicting Interests
The authors declared no potential conflicts of interest with respect to the research, authorship, and/or publication of this article.
Funding
The authors received no financial support for the research, authorship, and/or publication of this article.
Supplemental Material
Supplemental material for this article is available online.
References
Supplementary Material
Please find the following supplemental material available below.
For Open Access articles published under a Creative Commons License, all supplemental material carries the same license as the article it is associated with.
For non-Open Access articles published, all supplemental material carries a non-exclusive license, and permission requests for re-use of supplemental material or any part of supplemental material shall be sent directly to the copyright owner as specified in the copyright notice associated with the article.