
Abstract
Introduction
To ensure the safety and accuracy of radiotherapy, pre-treatment patient-specific quality assurance (PSQA) is a very important process to verify the consistency between the calculated and delivered doses. 1 Volumetric modulated arc therapy (VMAT) is becoming the preferred treatment technology for radiotherapy due to significantly improved treatment efficiency while maintaining plan quality.2‐5 However, there may be different individual delivery errors since VMAT has more degrees of freedom, such as position errors of multileaf collimators (MLC), gantry, collimator, and changes in dose rate and output. This demands higher requirements and challenges to meet PSQA guidelines. Previous studies showed that changes in the dose-volume histogram (DVH) caused by the MLC aperture opening/closing errors are larger compared to other errors.6‐9 These MLC errors have a larger impact on dose distribution, which could compromise the patient’s clinical outcome. MLC position accuracy is essential for a complex VMAT plan delivery. Therefore, PSQA should focus more on the detection of leaf gap errors.
The primary method to determine the consistency between 2 dose distributions is to use gamma evaluation, as proposed by Low et al.10,11 This method combines the dose difference (DD) and distance to agreement (DTA) criteria to calculate the gamma index of each point. The gamma pass rate (%GP) is the ratio of points passing the gamma evaluation (gamma index < 1) to all points. Different devices can be used for VMAT PSQA in clinical practice. The devices that are based on phantom measurement are the most commonly used, such as ArcCHECK (AC) (Sun Nuclear Corporation), Delta4 (ScandiDos), and Octavius (PTW). Quality assurance (QA) based on phantom measurement usually requires a complex phantom setup and additional machine delivery time, which is time-consuming and labor-intensive. Another commonly used device is the electronic portal imaging device (EPID), using software such as portal dosimetry (PD) (Varian Medical System) or Perfraction (Sun Nuclear Corporation) for analysis of the measurement. The EPID is usually installed on the medical linear accelerator (LINAC). Therefore, this type of device, which does not require additional setup, is more efficient than the device based on phantom measurement.
In recent years, a more time and labor-efficient QA method, based on logfiles, has attracted the interest of researchers. Almost all of the delivered parameters of the LINAC can be conveniently entered in the logfile to enable machine performance QA. Some studies have validated the accuracy of the information in the logfile, which supports the use of logfiles for PSQA.12,13 Logfile-based QA does not require a phantom for measurement. Following delivery, the data are automatically recorded and can be automatically evaluated by some QA systems, thereby avoiding setup errors, reducing labor costs, and significantly improving PSQA efficiency. However, it has been reported that the parameters recorded in the logfile are not always correct. 14 Another contentious factor of logfile-based QA is its independence. It is not measured by a third-party system but from the LINAC itself. Therefore, whether logfile-based QA can replace measurement-based QA remains a controversial topic among physicists.
Although several systems can be used for PSQA and gamma evaluation, the results in equivalent conditions are not the same and this difference in results is not widely understood. Therefore, users are unsure which results can be trusted, particularly when one plan fails validation on one system but passes or is approved on another system. Moreover, there is no uniform standard for the method and result analysis of plan verification among radiotherapy institutions. The accuracy and comparability of different systems and their detection ability of errors are issues that have attracted much attention. To promote PSQA standardization, the American Association of Physicists in Medicine (AAPM) Task Group No. 218 (TG218) conducted relevant investigations and studies and proposed the methods as well as standards of gamma evaluation, which recommended the universal tolerance limits and action limits of %GP to be 95% and 90% for gamma analysis using global normalization in absolute dose with 3%/2mm (DD/DTA) criteria and a 10% dose threshold. 15 However, using the same gamma analysis criteria and limits for all PSQA systems may be inappropriate because the %GP of different systems may vary widely.
The receiver operating characteristic curve (ROC) is a common method used in clinical studies to compare the ability of different tests to distinguish between negative and positive. ROC has been used to analyze the ability to detect radiotherapy errors in several studies.16‐19 The ROC curve is the line connecting each point with a false positive rate (1-Specificity) as the abscissa and the true positive rate (Sensitivity) as the ordinate under different thresholds of a test. The value of the area under the curve (AUC) is between 0.5 and 1. The higher the value, the better the test’s ability to distinguish between positive and negative. The corresponding optimal cut-off value can be calculated through ROC analysis.
This study used AC, PD, and an in-house logfile-based system (LF) to perform PSQA on the retrospective head and neck VMAT plans and plans generated by introducing MLC aperture open/close errors to these plans. We investigated the differences between the systems and evaluated their sensitivity to MLC aperture errors based on gamma analysis results. The impact of MLC aperture errors on the dose distribution of the targets and organs at risk (OARs) and the correlation between the gamma results and the dose error were analyzed. At the same time, ROC was used to obtain the AUC and the optimal cut-off value for detecting a certain MLC aperture or dose error for different PSQA systems under various gamma analysis criteria.
Materials and Methods
Patient and Study Plan
The research process is shown as a flowchart in Figure 1. From the clinical database, we obtained 12 retrospective head and neck VMAT plans that were treated. All the plans had 2 full arcs, of which the gantry of one rotated clockwise from 181° to 179°, and the collimator was set around 10°. The other arc rotated back counterclockwise, and the collimator was set around 350°. The dose was calculated using the AAA (Anisotropic Analytical Algorithm) algorithm with a 2.5mm grid in the Eclipse (version 13.6, Varian Medical System) treatment planning system (TPS) at 6MV of photon energy. All the plans were delivered on a TrueBeam LINAC (Varian Medical System) equipped with Millennium 120-leaf MLC. One oncologist contoured the targets and OARs based on the planning CT. The planning targets named planning target of gross tumor volume of the nasopharynx (PGTVnx), planning target of involved lymph nodes (PGTVnd), planning target of high-risk clinical target volume (PTV1), and planning target of low-risk and preventive radiation volume (PTV2) were generated by adding a margin of about 3 to 5mm to gross tumor volume (GTVnx), involved lymph nodes (GTVnd), high-risk clinical target volume (CTV1), and low-risk and preventive radiation volume (CTV2), respectively. Similarly, the planning organ at risk volume (PRV), named planning organ at risk volume of brainstem (BR_PRV) and planning organ at risk volume of spinal cord (SP_PRV), were generated from the brainstem and spinal cord, respectively. The prescribed doses were 69.96Gy/33f for PGTVnx and PGTVnd, 62.7Gy/33f for PTV1, and 54.45Gy/33f for PTV2, respectively.
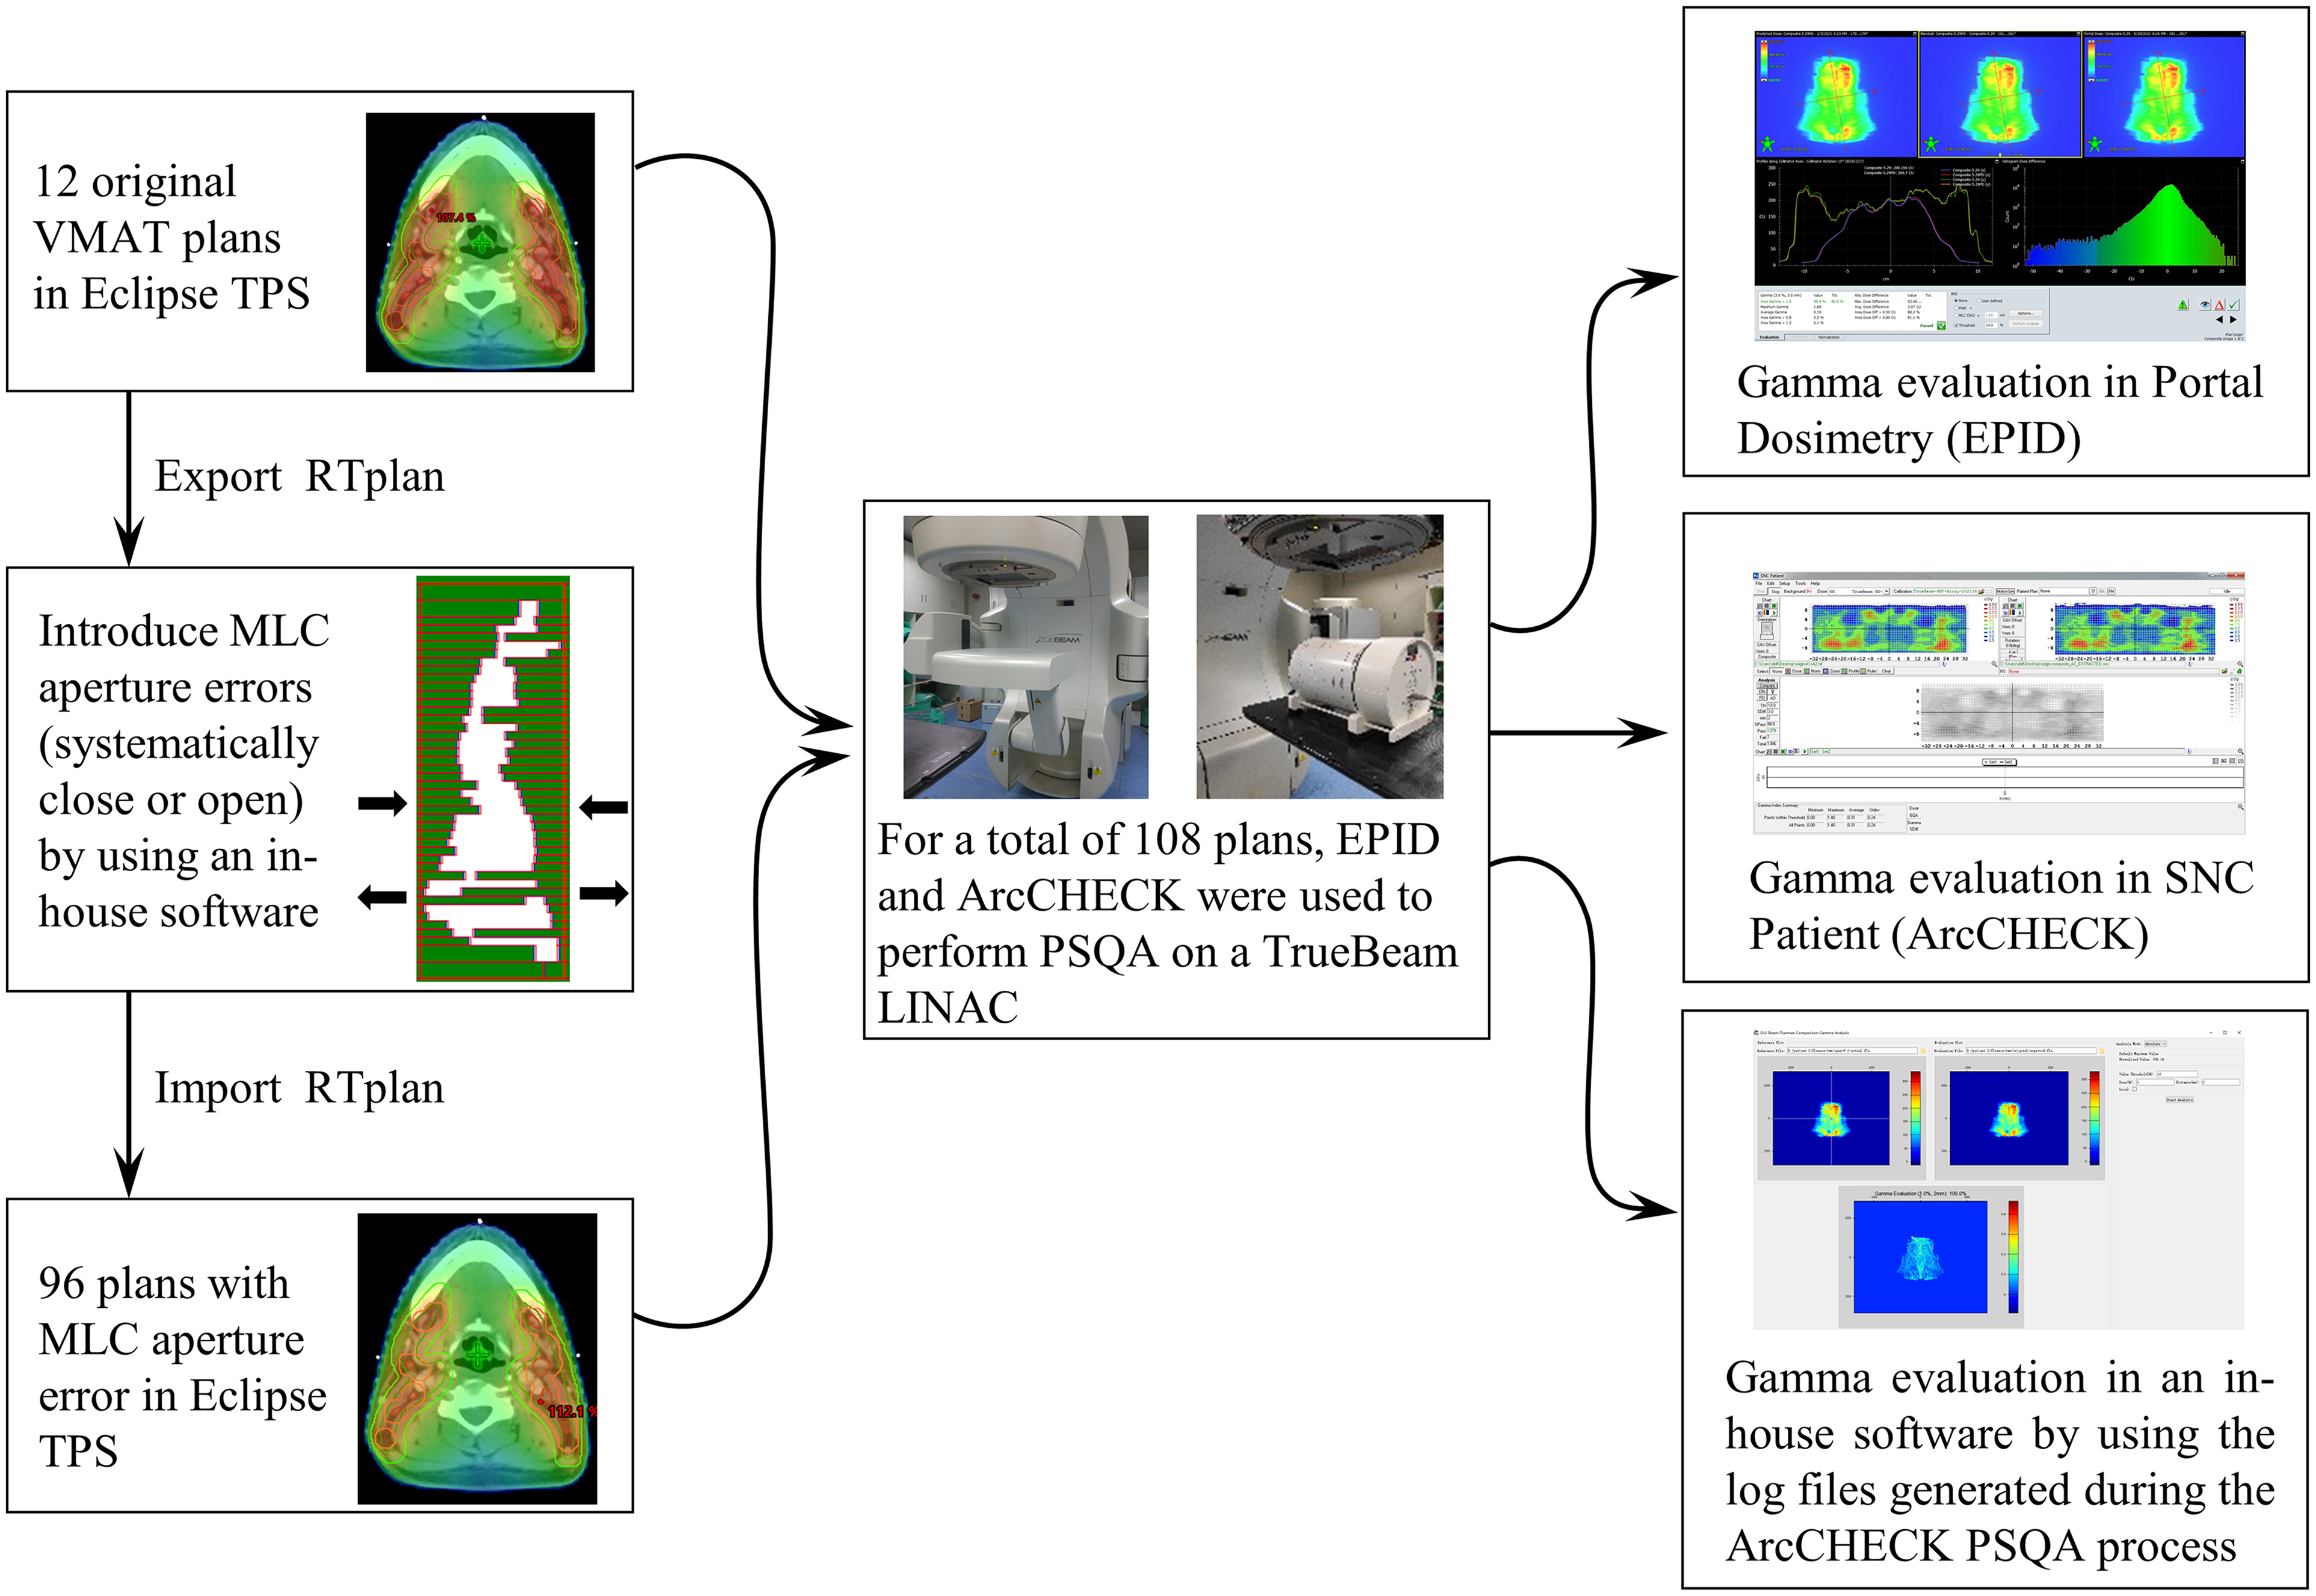
Flowchart of the research process.
These 12 plans were regarded as the original plans. Next, the RTplan files of the original plans were exported to an in-house software to edit the position of each leaf in the bank on both sides under the jaw aperture at every control point to move in the opposite direction by 0.2mm, 0.6mm, 1mm, and 1.5mm, meaning that the MLC aperture systematically opened or closed 0.4mm, 1.2mm, 2mm, and 3mm, respectively. Each original plan formulated 8 plans that contained MLC errors, meaning that there were 96 plans with MLC errors. These plans were then imported into the Eclipse TPS for dose calculation. The absolute dose percentage error (%DE) of the MLC error plan and original plan were compared using the following dose metrics: D98%, D2% (dose received by 98% and 2% of the volume), and generalized equivalent uniform dose (gEUD) for the planning target, Dmax (maximum dose), and gEUD for BR_PRV and SP_PRV, and gEUD for the left and right parotid. The gEUD is calculated by the following formula:

The absolute %DE is calculated as follows:

We used AC and EPID to perform PSQA on TrueBeam LINAC for 108 plans. The logfiles generated during the AC measurement were used for logfile-based PSQA. All measurements were completed within 2 consecutive days to minimize daily output variation. All PD and AC measurements were completed on the first and second days, respectively. The machine QA of LINAC including absolute dose calibration using DOSE1 (IBA Dosimetry) was performed each day prior to PSQA systems calibration and measurement. The dose and array response calibrations of AC and EPID were implemented before the measurement.
ArcCHECK
The AC, Model 1220, is a three-dimensional beam dosimetry QA system, with 1386 diode detectors of 0.8 × 0.8 mm size and 10mm sensor spacing, arranged in a spiral pattern on a cylindrical water-equivalent phantom with 21cm array diameter and length.
The original plan was calculated on the AC phantom using the same algorithm and grid. The dose distribution was exported to SNC Patient software (version 6.2.3, Sun Nuclear Corporation) for gamma evaluation. The AC phantom was then irradiated to measure the dose distribution of each plan. All the measured distributions were compared with the calculated distribution of the original plan.
Portal Dosimetry
The PD (version 13.6) is a system to perform gamma evaluation based on EPID measurement data. The TrueBeam LINAC has an amorphous silicon EPID (Portal vision aS1000) with 1024 × 768 pixels and a measuring area of 40cm × 30 cm. PD verification plan was created for all the plans using the Portal Dose Image Prediction (PDIP) algorithm. The data measured by EPID are automatically recorded into the corresponding verification plan once these verification plans are delivered on the TrueBeam LINAC.
Logfile-Based System
TrueBeam synchronized the planned and actual delivery with an update rate of 20ms. The information recorded in the logfile includes the MU, position of MLC and jaw, angle of gantry and collimator, etc. In this study, the logfiles generated during the AC PSQA process were used for evaluation. In-house software was created using Python script based on Pylinac v2.5.1 22 and Flashgamma23,24 to perform the logfile-based evaluation. The leaf position, jaw position, and MU were extracted from the logfile to generate the actual and expected fluence map with a 1mm resolution. Gamma evaluation was performed between the delivered actual fluence map of each plan and the expected fluence map of the original plan.
Gamma Evaluation
For all 3 systems, the dose distributions of the 2 arcs of each plan were computed into one. Next, gamma evaluation was performed between the measured distribution of each plan and the computed distribution of the original plan. In this study, 3 different criteria of 3%/3mm, 3%/2mm, and 2%/2mm, with the recommended settings of TG218, were used for gamma evaluation.
Data Analysis and Statistics
Sensitivity was expressed by the gradient and the area under the ROC curve (AUC). The gradient was the slope obtained by linear regression between %GP and MLC aperture errors, which equals the change in the value of %GP per unit error. The larger the absolute value of the gradient, the larger the response of the corresponding system to the errors of the MLC aperture.
The correlation between the %GP at different DD/DTA criteria and the absolute %DE including all dose metrics of all targets or all OARs was analyzed by linear fitting. The average of the absolute %DE of all dose metrics for all targets (including all D98%, D2%, and gEUD) in each MLC error plan was sorted at 1% intervals. For example, the %DE of 1% to 2% means the average of the absolute value of the percentage change in D98%, D2%, and gEUD of all targets in a certain plan is ≥ 1% and < 2%. The original plan without introducing error was regarded as a negative plan, and the plan with introducing error was regarded as a positive plan. The ROC curves, their corresponding AUC, and the cut-off values of the 3 DD/DTA criteria were calculated for different absolute MLC aperture errors or average absolute %DE of targets at 1% interval.
All data were analyzed using GraphPad Prism 8 (GraphPad Software Inc.).
Results
The %DE between the plans with MLC aperture error and the original plan is shown in Table 1. The %DE of the dose metrics of OARs was larger than the %DE of the dose metrics of the targets of most cases. Gradient analysis shows that the changes of D98% of the target varied from 1.93% to 3.22% per millimeter of MLC aperture error. Changes of D2% and gEUD of target were 1.63%/mm to 2.47%/mm and 1.82%/mm to 2.76%/mm. Changes in gEUD of OARs were 3.16%/mm to 4.34%/mm. Changes in Dmax of BR_PRV and SP_PRV were 3.87%/mm and 4.29%/mm.
Percentage Dose Error (%DE, Mean ± Standard Deviation [SD]) of Dose Metrics Between the Plans With Multileaf Collimators (MLC) Aperture Errors and the Original Plan and the Equation of Linear Fitting Between %DE and MLC Aperture Error.

%DE using the original plan as the baseline.
Abbreviations: BR_PRV, planning organ at risk volume of brainstem; gEUD, generalized equivalent uniform dose; PGTVnd, planning target of involved lymph nodes; PGTVnx, planning target of gross tumor volume of the nasopharynx; PTV1, planning target of high-risk clinical target volume; PTV2, planning target of low-risk and preventive radiation volume; SP_PRV, planning organ at risk volume of spinal cord.
The average %GP at different MLC aperture errors and DD/DTA criteria is shown in Figure 2. With the error increase, the %GP of the 3 systems has a significant difference. For the mean and standard deviation (SD) of %GP, LF had a larger mean and smaller SD in all the cases compared with the other 2 systems. The mean and SD of AC were larger than PD in most cases. The slope of linear fitting between %GP and MLC aperture error at different DD/DTA criteria is shown in Table 2. Compared with the other 2 systems, LF had the smallest absolute slope in any case. The absolute slope of PD was larger than AC, except for the case of opening error at the 2%/2mm criteria, where the slope of PD was −15.12%/mm and the slope of AC was −16.94%/mm.
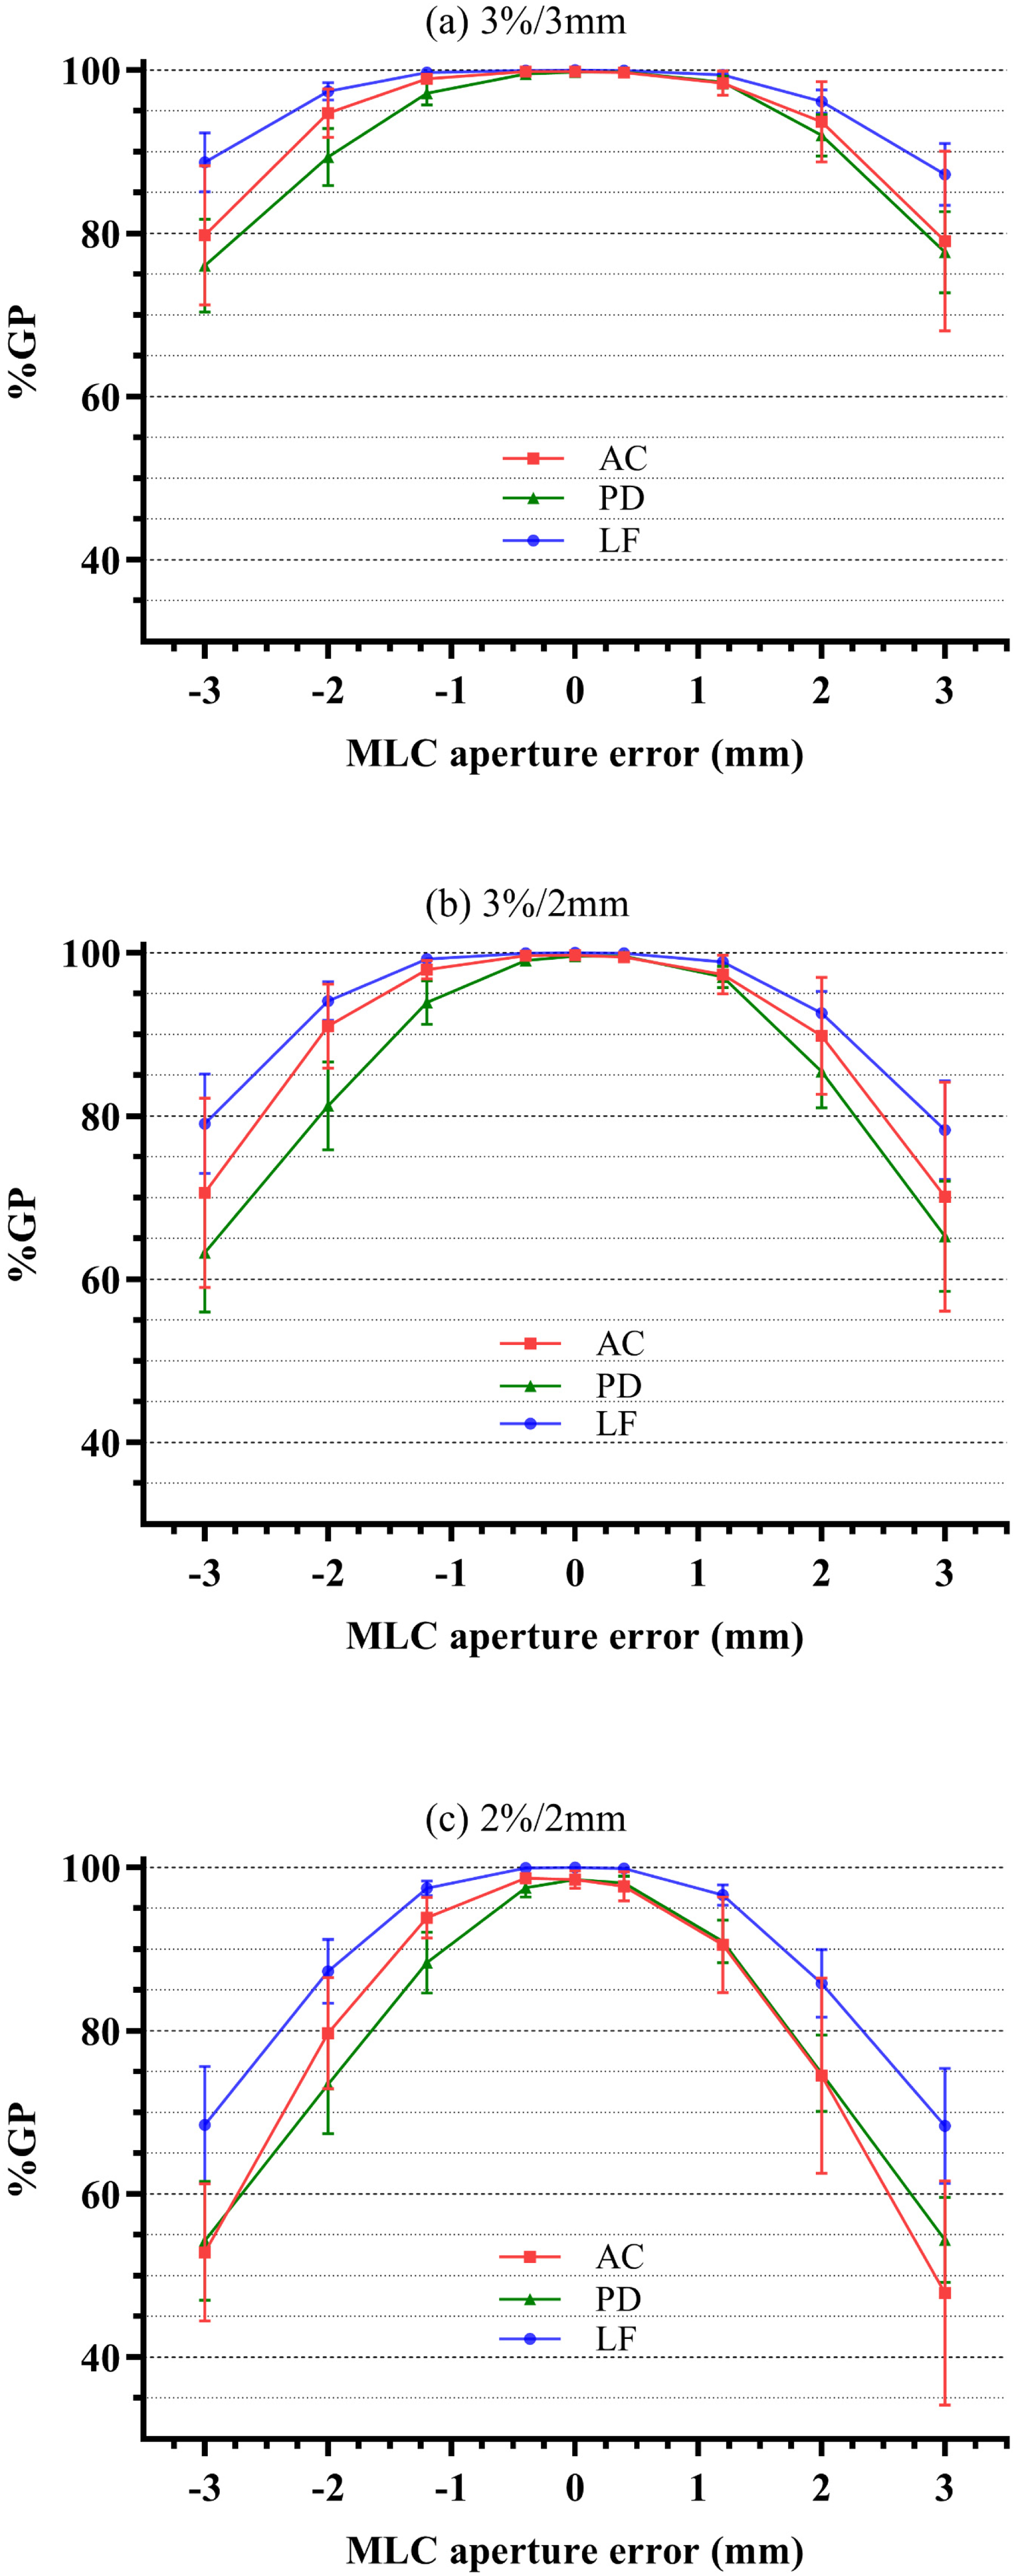
The average gamma pass rate (%GP, mean ± standard deviation [SD]) at different multileaf collimators (MLC) aperture errors of ArcCHECK (AC), portal dosimetry (PD), and logfile-based system (LF) at 3%/3mm (a), 3%/2mm (b), and 2%/2mm (c) criteria.
The Gradient (slope) of Linear Fitting Between Gamma Pass Rate (%GP) and Multileaf Collimators (MLC) Closing/Opening Error for ArcCHECK (AC), Portal Dosimetry (PD) and Logfile-Based System (LF) at Different Dose Difference (DD)/Distance to Agreement (DTA) Criteria.

The correlation between the %GP at different DD/DTA criteria and the absolute %DE including all dose metrics of all targets or all OARs is shown in Figure 3. In all the cases, the range of R2 was 0.56 to 0.85. PD has the largest R2, followed by LF, and AC the smallest. The R2 of all cases increased gradually as the DD/DTA criterion became stricter. The data was scattered, %GP does not fully represent the level of %DE, and there were cases where both %DE and %GP were large, which was obvious for the case of OARs.

The correlation between the gamma pass rate (%GP) at different dose difference (DD)/distance to agreement (DTA) criteria ((A, B) 3%/3mm criteria, (C, D) 3%/2mm criteria, (E, F) 2%/2mm criteria) and the absolute value of percent dose error (%DE) including all dose metrics of all targets (A, C, E) or OARs (B, D, F).
Figure 4 shows the AUC and optimal cut-off value calculated from the ROC curve of different systems as a function of different absolute MLC aperture errors at different DD/DTA criteria. Before the AUC value of all systems reaches 1, the AUC of AC was the smallest among the 3 systems. The AUC of most cases increased gradually as the DD/DTA criterion became stricter. When the error was ± 0.4 mm, the AUC value of LF and PD at 2%/2mm criteria were 0.79 and 0.7, and the AUC values of the other cases were all < 0.7, of which AC was < 0.6. When the error was ± 1.2 mm, the AUC value of AC at 3%/3mm criteria was 0.88, and the AUC values of the other cases were all larger than 0.9. The AUC value increases as the error increases, and when it is equal to 1, it means that the system can perfectly identify the error. For the 3%/3mm criteria (Figure 4 (a,d)), the error that AC, PD, and LF can perfectly identify were ± 3mm, ± 2mm, and ± 1.2mm, respectively, and the corresponding optimal cut-off values were 98.8%, 98.4%, and 99.95%, respectively. For the 3%/2mm criteria (Figure 4 (b,e)), the error that AC, PD, and LF can perfectly identify were the same as the 3%/3mm criteria, and the corresponding optimal cut-off values were 97.65%, 96.95%, and 99.85%, respectively. For the 2%/2mm criteria (Figure 4 (c,f)), AC can perfectly identify the error of ± 2mm, and PD and LF can identify the error of ± 1.2mm. The corresponding optimal cut-off values were 95.95%, 96.6%, and 99.45%, respectively.

The area under the receiver operating characteristic (ROC) curve (AUC) and optimal cut-off value of ArcCHECK (AC), portal dosimetry (PD), and logfile-based system (LF) as a function of multileaf collimators (MLC) aperture error at 3%/3mm (A, D), 3%/2mm (B, E), and 2%/2mm (C, F) criteria.
Figure 5 shows AUC and the optimal cut-off value calculated from the ROC curve of different systems as a function of the average absolute %DE with a 1% interval in targets at different DD/DTA criteria. Before the AUC value of all systems reaches 1, the AUC of AC was the smallest among the 3 systems except for some cases where %DE ≤ 2%. For the 3%/3mm criteria (Figure 5 (a,d)), when the %DE were 0% to 1% and 1% to 2%, the AUC of all systems were all-around 0.6 but for the AUC of PD at 1% to 2% was 0.8. When the %DE was 2% to 3%, all systems had an AUC larger than 0.85. The %DE that AC, PD, and LF can perfectly identify were 4% to 5%, 3% to 4%, and 2% to 3%, respectively, and the corresponding optimal cut-off values were 99.45%, 98.95%, and 99.95%, respectively. For the 3%/2mm criteria (Figure 5 (b,e)), the AUC of all systems was slightly larger than the 3%/3mm criteria except for the AUC of AC when %DE is 0% to 1%. However, the %DE that AC, PD, and LF can perfectly identify were the same as the 3%/3mm criteria, and the corresponding optimal cut-off values were 98.65%, 97.95%, and 99.85%, respectively. For the 2%/2mm criteria (Figure 5 (c,f)), PD and LF showed large improvement in the ability to identify dose error of 1% to 2%, where the AUC were 0.89 and 0.85. AC can perfectly identify the %DE of 3% to 4%, and PD and LF can identify the %DE of 2% to 3%. The corresponding optimal cut-off values were 96.15%, 96.6%, and 99.45%, respectively.
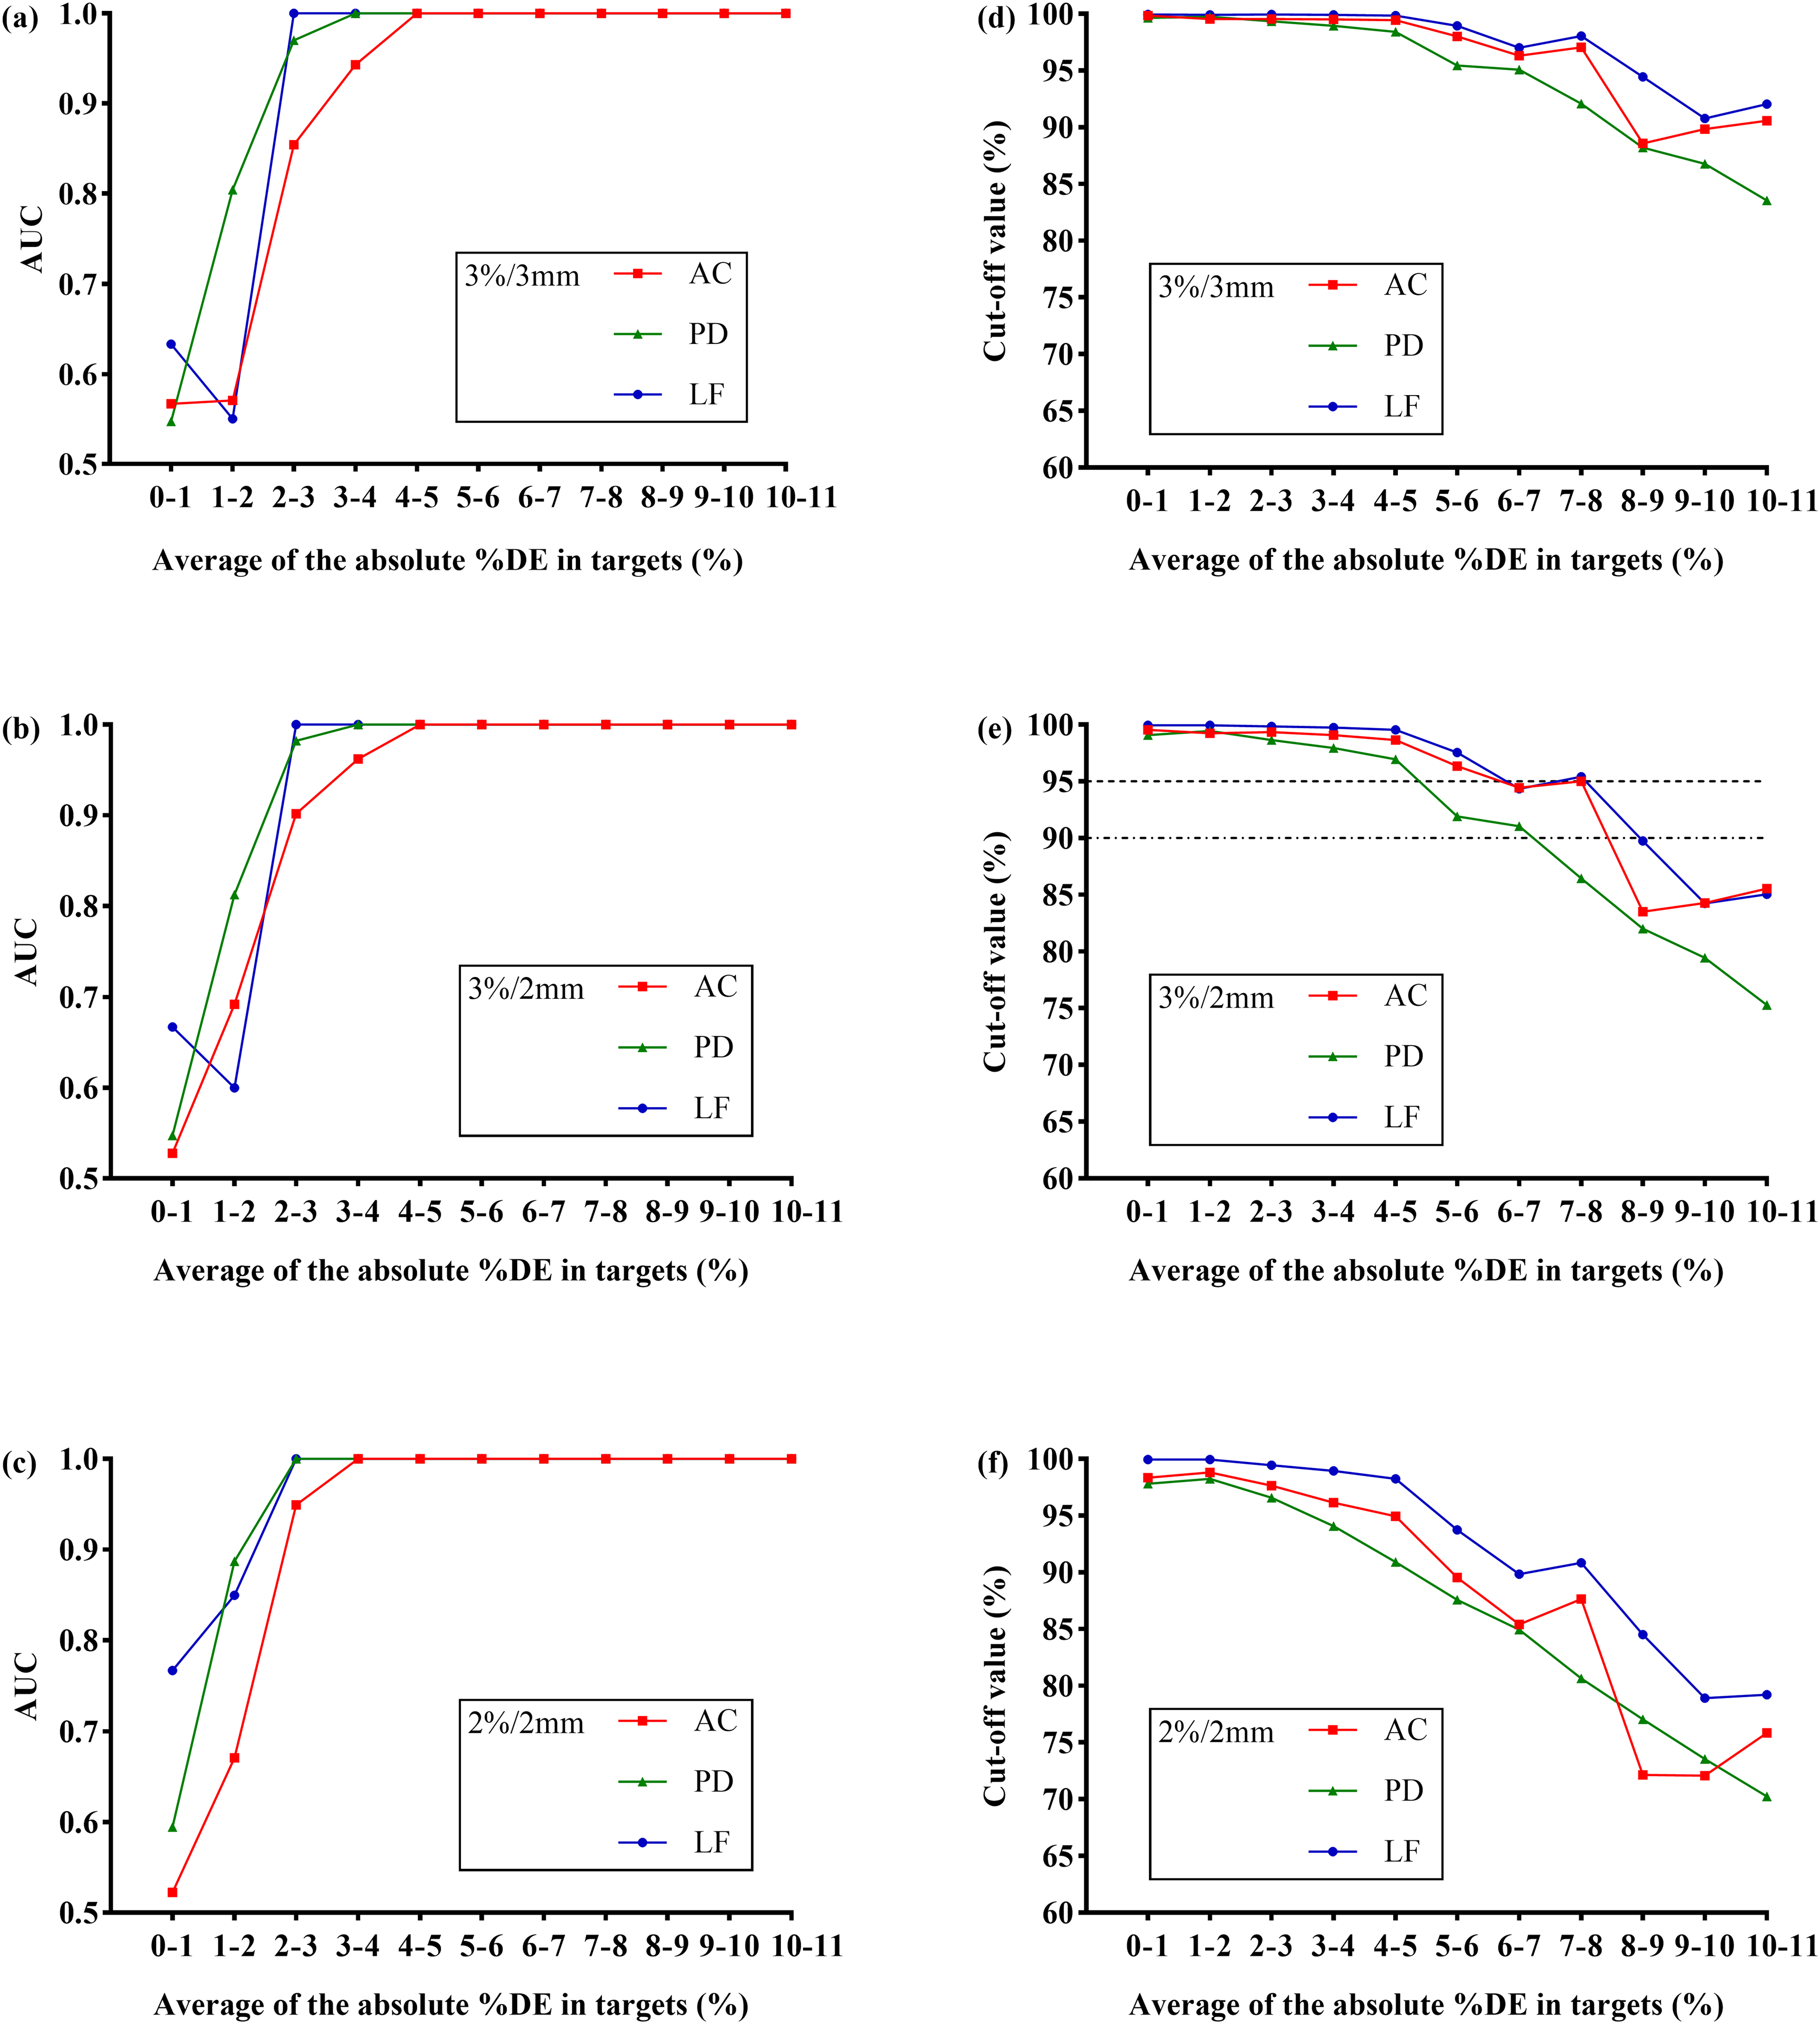
The area under the receiver operating characteristic (ROC) curve (AUC) and optimal cut-off value of ArcCHECK (AC), portal dosimetry (PD) and logfile-based system (LF) as a function of the average absolute value of percent dose error (%DE) in targets at 3%/3mm (A, D), 3%/2mm (B, E), and 2%/2mm (C, F) criteria. The ROC curve was obtained by considering the original plans as negative and the plans within different %DE ranges as positive, respectively. For example, the %DE range from 1% to 2% means the average of the absolute value of the percentage change in D98%, D2%, and generalized equivalent uniform dose (gEUD) of the target is ≥ 1% and < 2%.
Discussion
In this study, the impact of MLC aperture errors on dose distribution of head and neck VMAT plans was analyzed, and the sensitivity of 3 PSQA systems to these errors was compared. The TG-218 suggested that dose verification should use the method that best identifies errors. True composite method was recommended for AC, but per beam analysis was recommended for EPID because composite field may mask errors. However, the simulated error in this study was MLC opening and closing error, and the composite field will not mask this type of error but may be more conducive to the identification of this type of error, so the composite field was used for comparison in all systems. The results show that the MLC aperture error has a large effect on the dose distribution of the VMAT plan. The average %DE of most structures was ≥ 3% when the MLC aperture error was ≥ 1.2mm. There was a large difference in %GP among the 3 systems. PD was more sensitive to MLC aperture errors, followed by AC, and LF was the least sensitive. LF had a larger mean but smaller SD and slope compared with the other 2 systems at different DD/DTA criteria. Compared with AC, PD had a smaller mean and SD but a larger slope in most cases. The high %GP of logfile-based dose verification was reported in the study of Stanislav et al, 25 which compared the %GP between a LF using python script API Pylinac and the PD system by changing the dosimetric leaf gap (DLG). They found that the results of the LF were “too good” compared with PD while using the DD/DTA criteria of 3%/1mm, 2%/2mm, and 1%/1mm, respectively. To make the results of these 2 systems more comparable, they found that the dose difference criterion used for the LF should be 8 to 10 times smaller than the criterion used with PD. The LF was not affected by factors such as detector and setup error, which explains the better results of the LF compared to the other systems. Furthermore, QA based on a logfile can analyze each delivery parameter and find small delivery errors that cannot be detected by the phantom-based measurement.26,27 Despite several advantages, replacing measurement-based QA with logfile-based QA remains controversial among physicists. 28 Logfile is not considered an independent measurement tool since the recorded data is measured by LINAC and not by a third party. The logfile cannot record some errors caused by machine calibration, hardware malfunction, etc. Agnew et al 14 reported that the MLC position recorded on the logfile was inconsistent with the measurement results of EPID due to a loose T-nut. Strict machine QA for LINAC should be performed before logfiles are used for PSQA.
The data was scattered in correlation analysis between the %GP at different DD/DTA criteria and the absolute %DE including all dose metrics of all targets or all OARs. A %GP may correspond to many different %DE, and a %DE may correspond to many different %GP. This is because the impact of the error on different structures and dose metrics is not the same. The same error may have a larger impact on some structures and dose metrics and a smaller impact on others. %GP does not fully represent the level of %DE, and there were cases where both %DE and %GP were large. The effectiveness of the gamma evaluation method for pre-treatment PSQA has been questioned by researchers, with some studies suggesting that %GP does not reflect clinical outcome.18,29,30 The gamma index is more about the accuracy of machine delivery rather than the dose distribution of the patient in that it does not indicate the location and distribution of the non-passing points in the patient. For example, if the %GP was 95% with 3%/2mm criteria, usually it was considered the plan could be used for clinical treatment. However, if it were known that the failed 5% are concentrated on the spinal cord, it could lead to a serious impact on its maximum dose. At this time, it is important to consider whether the plan can be used for treatment. McKenzie et al 18 investigated the ability of several PSQA systems to identify acceptable and unacceptable intensity-modulated radiation therapy (IMRT) plans. They found that most systems performed poorly at identifying unacceptable plans. However, most of these studies are based on looser %GP limits. In fact, whether a plan is accepted or not has much to do with the acceptable error size and the corresponding %GP limit.
Carlone et al 16 investigated the use of the ROC curve to get tolerance limits for gamma evaluation using MapCHECK by introducing random MLC errors to the prostate IMRT plan. They found that the gamma criterion achieved nearly 100% sensitivity/specificity for random errors larger than 3mm, and the optimal cut-off values for different error detection range from 92% to 99% for 3%/3 mm criteria, whereas for 2%/2 mm, the range was from 77% to 94%. In this study, the AUCs and cut-off values were obtained from ROC curves of 3 PSQA systems at different DD/DTA criteria for different absolute MLC aperture errors or average absolute %DE of targets. Although the %GP of LF was generally high, it had good stability (small SD value) at different errors; therefore, it was easier to find a suitable limit to distinguish plans with and without errors. Compared with the other 2 systems, the AUC of LF can reach 1 faster in most cases, indicating that the error of perfect identification is smaller. Except for LF at 2%/2mm criteria, all systems had poor recognition ability for ± 0.4mm MLC aperture error or 0% to 1% dose error, with AUC less than 0.7. AC has the worst ability to distinguish plans with and without errors in most cases. For MLC aperture error, the error of AC to achieve perfect discriminative ability appears to be large. This may be related not only to the characteristics of the AC itself but also to the plan. First, in terms of the characteristics of the AC itself, it is a lot harder to perfectly predict the doses to be measured in every detector, considering they are irradiated with both entrance and exit doses and a lot more scattered and oblique doses than an EPID where all is a perfectly perpendicular entrance dose. In addition, EPID has a much higher spatial resolution than AC. Therefore, there may be larger uncertainty when using AC to verify plans with large errors. The %GP vary over a wide range for different plans with large errors making it more difficult to find an appropriate limit to distinguish plans with and without errors. Second, the error of the same size has different effects on different plans. In this study, we only simulated the MLC aperture error without simulating the error of the jaws. The same open error may have a smaller impact on plans with more leaves close to the edge of the jaws. Furthermore, the impact of MLC errors on plans with a large average segment width may be smaller. Moon et al 31 investigated the correlation between average segment width and %GP as a function of MLC position error. They confirmed a strong correlation between the %GP descent gradient due to MLC position error and average segment width. MLC position errors have less effect on plans with larger average segment width, so we can reduce the effect of MLC position errors on dose delivery uncertainty by limiting the plan's minimum segment width. Therefore, for all verification systems, it is possible that the pass rate of individual plans is still high when the MLC error is large, which may lead to the failure of finding a perfect limit to distinguish plans with and without errors. For %DE, there are many dose metrics of many different structures that can be used to evaluate the quality of a plan, and it is difficult to decide which one or several metrics of which structures are used as the evaluation objects. In this study, ROC analysis was performed using the average absolute %DE of D98, D2, and Dmean in all targets of a certain plan, regardless of the dose metrics of OARs. The effect of MLC aperture errors on the dose metrics of OAR was larger than on the dose metrics of the target. It is more difficult to determine the magnitude of acceptable %DE of OAR than the target since even a large %DE may be acceptable when the dose metrics of OAR are far below the clinical limit.
It can be seen from Figures 4(e) and 5(e) that some large errors may be omitted if the universal tolerance limits (95%) are adopted in the case of this study. When the cut-off value is set on the universal tolerance limit, the MLC aperture error that can be well identified by AC, PD, and LF is larger than 3mm, approximately 2mm, and approximately 3mm, respectively. And the %DE that can be well identified by PD is approximately 4% to 5%, while AC and LF are approximately 6% to 8%. This suggests that the universal tolerance limits are not necessarily applicable to all situations in different institutions. In some cases, it may not be sensitive enough to detect clinically significant errors, resulting in potential risks to the PSQA process. We usually focus more on the %GP of PSQA systems than on their ability to identify errors. In fact, the %GP is affected by many factors, such as different TPS, LINACS, plan types, and even different quality control personnel may bring about alternative results. A high %GP does not necessarily mean that the plan is error-free, and a low %GP does not mean that the plan contains errors. Therefore, it may not be appropriate to use the same gamma analysis criteria and limits for all PSQA systems. What is more important than a high or low %GP is finding an appropriate limit to distinguish the plans with errors. The %GP of PD and LF were significantly different, but they could all obtain good error identification ability using an appropriate limit value. Each institution should formulate its own customized %GP limit based on its PSQA process. ROC curve is one of the common research methods used to reflect the ability to discriminate between negative and positive aspects of a certain index in clinical research. However, the premise of its application is that a group of known negative and positive plans is required. In this study, only the MLC opening and closing errors, which have large clinical impact, were simulated in head and neck VMAT plans. More error types such as machine output, gantry speed, and other treatment sites or modalities such as SBRT/SRS need to be investigated in future studies. In addition, the method based on statistical process control is also considered an effective way to find a suitable limit to detect errors in the PSQA process.15,32,33 The advantages and disadvantages of this process can be determined by comparing it with the ROC method in future studies.
Conclusions
Gamma evaluation can be greatly affected by QA systems and user-defined parameters. The sensitivity of 3 PSQA systems to MLC aperture errors of head and neck VMAT plan was investigated in this study. The gradient analysis showed that LF had the lowest sensitivity to MLC aperture errors. The sensitivity of PD was higher than AC, except for the case of open error at 2%/2mm criteria. However, the ROC analysis demonstrated that the AC had the lowest ability to identify plans with errors in most cases. The error that LF can fully identify is usually smaller than the other 2 systems. The error identification ability usually increased gradually as the DD/DTA criterion became stricter. %GP does not fully represent the level of %DE. We should be more concerned with finding an appropriate limit to identify plans with errors rather than just pursuing a high %GP thus institutions should formulate their own customized limits based on their PSQA process through ROC or other methods.
Footnotes
Abbreviations
Declaration of Conflicting Interests
The author(s) declared no potential conflicts of interest with respect to the research, authorship, and/or publication of this article.
Funding
The author(s) disclosed receipt of the following financial support for the research, authorship, and/or publication of this article: This work was supported by the National Key Research and Development Program of China (grant No. 2016YFC0105103).