
Abstract
Introduction:
Osteosarcoma is the most common primary tumor of bone, although some molecular markers have been identified, the detailed molecular mechanisms underlying osteosarcoma are currently not fully understood. In the present study, we attempted to identify the potential key genes and pathways in osteosarcoma using bioinformatics analysis.
Methods:
GSE14359 was downloaded from the GEO database, and analyzed using Limma package. Gene Ontology and pathway enrichment analyses of the DEGs were performed in the DAVID database, followed by the construction of a protein–protein interaction (PPI) network with software Cytoscape, subnetwork modules were subsequently identified and analyzed, and further validation in human osteosarcoma tissues and osteosarcoma cells line was performed.
Results:
964 Differentially expressed genes (DEGs) identified, of which 222 were up-regulated and 742 were down-regulated. Among them, 10 genes (including BIRC5, MAD2L1, Bub1, DSN1, SPC24, CDCA8, STAG2, CENPA, MLF1IP and Mis12) were identified as hub genes and they were mainly enriched in pathways, including mRNA surveillance, RNA transport and PI3K-Akt signaling pathways. Further validation indicated 6 gene (DSN1, BIRC5, CDCA8, MLF1IP, MAD2L1 and SPC24) is highly expressed in osteosarcoma tissues. Among them, CDCA8, DSN1 and BIRC5 significantly promoted the proliferation of osteosarcoma cells in vitro. In terms of mechanism, DSN1 and CDCA8 were mainly involved in cell cycle regulation, while BIRC5 was mainly involved in the regulation of apoptosis pathway.
Conclusions:
We identified some key genes and pathways in osteosarcoma, which might be used as molecular targets or diagnostic biomarker for the diagnosis and therapy of osteosarcoma.
Introduction
Osteosarcoma is the most common malignant primary bone tumor that accounts for a large proportion of cancer-related deaths among children and young adults with a highly risk of metastasis to the lung. 1 Long bones of extremities, especially distal femur, proximal tibia and humerus are the most common sites of osteosarcoma. 2 Further, complex karyotype and genomic instability are believed to be among the potential molecular mechanisms involved in the pathogenesis of osteosarcoma. 3 Accumulating evidences have implicated multiple cellular pathways in the characteristic pathogenesis of osteosarcoma cells. 1,3 However, the lack understanding of the precise mechanism of osteosarcoma tumorigenesis has been a barrier to the development of drug therapy. A deeper understanding of the precise molecular pathology that underlies proliferation, apoptosis and metastasis of osteosarcoma will offer novel insights, improve diagnostics and help identify therapeutic targets.
Modern technologies, such as microarrays, are capable of performing parallel analysis of thousands of proteins and genes in a single experiment with the help of high-throughput platforms. 4 These technologies have been widely used and facilitated the identification of potential targets for diagnosis and therapy of different cancers. Importantly, they provide opportunities to unravel the detailed pathogenic mechanism of complex diseases. 5 When the powerful analytical technology in conjunction with bioinformatics tools they have enabled analysis of DEGs in the proliferation, apoptosis and metastasis of osteosarcoma and identify many well-established cancer biomarkers. Over the past decade, a few gene expression profiling studies have been performed in OS and several molecular markers have been identified. 6,7 For example, Fritsche-Guenther el al. identified ephrins may stimulate OS metastasis for the upregulation and de novo expression of ephrins in OS are involved in oncogenic signaling using genome wide microarrays. 6 Liu el al. identified 4 DEGs associated with the OS metastatic process through comparing the gene expression level between non-metastatic and corresponding metastatic OS tumor samples. 7 However, there is a continuing medical need to study the detailed molecular mechanisms governing OS development and dissemination and provide new molecular targets or diagnostic biomarker for the better treatment of OS.
In the present study, the gene expression profile data of GSE14359 was downloaded from GEO database and DEGs were identified between osteosarcoma samples and non-neoplastic primary osteoblast samples. Subsequently, the DEGs were taken for Gene Ontology (GO) and KEGG pathway enrichment analyze, followed by the construction of a protein–protein interaction (PPI) network, several key hub genes and pathways were identified to be potential molecular targets or diagnostic biomarker for the diagnosis and therapy of OS. Finally, we identified several key genes (CDCA8, DSN1 and BIRC5) in osteosarcoma with high expression and demonstrated their effects on osteosarcoma cell cycle and apoptosis regulation. Collectively, the study provides a valuable resource for understanding of the molecular mechanisms underlying OS development and dissemination.
Materials and Methods
Microarray Data
The gene expression profile of GSE14359 was downloaded from Gene Expression Omnibus (GEO) database (http://www.ncbi.nlm.nih.gov/geo/), which is a database repository of high throughput gene expression data, hybridization arrays, chips and microarrays. The data was based on the GPL96 platform (Affymetrix HG U133A microarrays) and was submitted by Fritsche-Guenther et al. In total, the dataset contained 20 samples, including 10 osteosarcoma samples, 8 lung metastasis samples and 2 non-neoplastic primary osteoblast cell lines. The osteosarcoma samples and non-neoplastic primary osteoblast cell lines were further selected for more detailed characterization.
Identification of DEGs
The Limma (Linear Models for Microarray Data) package from bioconductor (http://www.bioconductor.org/packages/release/bioc/html/limma.html) was used to identify the DEGs at the probe level between osteosarcoma samples and non-neoplastic primary osteoblast samples. If multiple probes corresponded to the same gene, we will take the mean value as the expression of this gene. The genes with an adjusted pvalue P < 0.01 and |logFC| > 1 (FC represent fold change) were considered as significantly differentially expressed.
Gene Ontology and Pathway Enrichment Analysis of DEGs
Gene ontology analysis, a commonly used method for annotation of genes and gene products, can provide functional annotation and descriptive framework for the high-throughput gene data sets. Kyoto Encyclopedia of Genes and Genomes pathway (KEGG, http://www.genome.jp/) is a collection of databases for systematic analysis of gene functions and genomic information, which was designed to link genes in the genome to gene products (mostly proteins) in the pathway. The Database for Annotation, Visualization and Integrated Discovery DAVID (https:/david.ncifcrf.gov/) provide a comprehensive set of functional annotation tools to analyze high-throughput gene function. GO and KEGG pathway enrichment analysis were performed for DEGs using DAVID and pvalue P < 0.05 was set as the cut-off criterion.
Integration of Protein–Protein Interaction Network and Module Analysis
To evaluate the PPI information of DEGs, we construct the PPI network using the open-source software Cytoscape (version 3.5.1) on the basic of Search Tool for the Retrieval of Interacting Genes database (STRING; version 10.0; http://www.string-db.org/). The plug-in Molecular Complex Detection (MCODE) was used to screen the functional modules of PPI network in Cytoscape. Protein interactions with a combined score < 0.4 were selected as significant. The top 10 hub nodes with higher degrees were further screened. In addition, Gene Set enrichment analysis was performed for DEGs in the modules. pvalue P < 0.05 was considered to statistically significant.
Cell lines and Antibodies
Saos-2 cells were purchased in ATCC and cultured in conditioned medium containing 90% DMEM and 10% FBS. The antibodies of Bad (Abcam, ab32445), Bcl-2 (Abcam, ab692), cl-caspase 3 (Abcam, ab13585), CDC25C (Cell Signaling Technology, 4688), cyclin B1 (Cell Signaling Technology, 4138), CDK2 (Cell Signaling Technology, 2546), cyclin A (Cell Signaling Technology, 4656), GAPDH (Abcam, ab37168) were purchased.
Tumor Samples
Tumor samples were collected from patients who were operated on at The First People’s Hospital of Yichang (Hubei, China). Ten pair of osteosarcoma samples and corresponding para-cancerous samples were used in this study. The study was approved by the Ethics Committees of The First People’s Hospital of Yichang, and all subjects gave written informed consent.
RT-PCR
Total RNA was isolated from frozen tissue samples using TRIzol, reverse transcribed into cDNA and subjected to RT-PCR using Roche FastStart Universal SYBR Green. The primers used in this study include: BIRC5 (AGGACCACCGCATCTCTACAT, AAGTCTGGCTCGTTCTCAGTG), MAD2L1 (GGACTCACCTTGCTTGTAACTAC, GATCACTGAACGGATTTCATCCT), Bub1 (TGGGAAAGATACATACAGTGGGT, AGGGGATGACAGGGTTCCAAT), DSN1 (CTCAGCCGGTCTATCAGTGTC, AGTGTCCCTTAGGAAAGGTTCAA), SPC24 (GCCTTCCGCGACATAGAGG, CCTGCTCCTTCGCATTGAGA), CDCA8 (GCAGGAGAGCGGATTTACAAC, CTGGGCAATACTGTGCCTCTG), STAG2 (CAAGCATGACCGAGATATAGCAC, CCGTACTAACACGCCAATGAAT), CENPA (GACGCCTATCTCCTCACCTTA, GTTGCACATCCTTTGGGAAGA), MLF1IP (ACCCACCTAGAGCATCAACAA, ACTTCAATCATACGCTGCCTTT) and Mis12 (CCAGTGCAGATTCGCAAATGC, AGAAGGGCCTGCTTAGTACAT).
shRNA
The shRNA sequences used in the study included: DSN1 (CCGGCCTATGACATATCTTGGGTCTCTCGAGAGACCCAAGATATGTCATAGGTTTTTTG), BIRC5 (Sequence: CCGGCCTTTCTGTCAAGAAGCAGTTCTCGAGAACTGCTTCTTGACAGAAAGGTTTTTG), CDCA8 (CCGGCGGAGAGAGCCTGCGATTATTCTCGAGAATAATCGCAGGCTCTCTCCGTTTTTG), MLF1P (CCGGGCATTGAAGAAAGTGATACAACTCGAGTTGTATCACTTTCTTCAATGCTTTTTG), MAD2L1 (CCGGCTGCTGATTTATACAGACAAACTCGAGTTTGTCTGTATAAATCAGCAGTTTTT) and SPC24 (CCGGCAGGAAATTCATCAGCGACTACTCGAGTAGTCGCTGATGAATTTCCTGTTTTTTG). 293 T cells were used to package lentiviruses containing shRNA vectors. After Saos-2 cells were infected with lentivirus, they were screened by puromycin to finally obtain Saos-2 cell lines that stably interfered with the gene of interest.
CCK-8 Analysis
Cell proliferation was measured using a CCK-8 kit (MCE, HY-K0301). The cells treated by each group were inoculated into 96-well plates at a density of 5000 cells per well and cultured for 5 days. On the 3 rd and 5th day, 10 µL of CCK-8 solution was added to each well, and then cell viability was measured by measuring the absorbance at 450 nm.
Colony Formation Analysis
The cells treated by each group were seeded into a 12-well plate at a density of 1000 cells per well, and then cultured at 37° C for about 15 days. The cells were washed twice with PBS solution and fixed with 4% paraformaldehyde for 30 minutes. 500 µL of crystal violet was stained for 15 minutes, and cell colonies were counted and statistically analyzed.
Statistical Analysis
All statistical analyses were performed using SPSS 19.0. All cell experiments must undergo at least 3 independent experiments. The t test was used to analyze the differences between the experimental groups. All differences were considered statistically significant at P < 0.05.
Results
Identification of DEGs
The osteosarcoma samples and non-neoplastic primary osteoblast cell lines were selected for an integrated analysis. In total, 964 DEGs were identified by the Limma package from bioconductor, of which 222 were up-regulated and 742 were down-regulated (Supplemental table). The heatmap of DEGs expression is shown in Figure 1.

A heatmap of the expression of all the DEGs (10 osteosarcoma samples and 2 control samples, non-neoplastic primary osteoblast cell lines). Red and green in the heatmap indicate high and low relative expression levels, respectively.
Gene Ontology Term Enrichment Analysis
To gain more insights into the GO enrichment functions of the DEGs, we uploaded DEGs to the online software DAVID. The top 3 clustering groups obtained by GO enrichment analysis were shown in Table 1. The up-regulated DEGs were primarily involved in biological processes (BP), including mitotic cell cycle process, chromatid segregation, and cell cycle process; the down-regulated DEGs were primarily involved in biological processes such as biological adhesion, cell adhesion, and movement of cell or subcellular components. For molecular function (MF), the up-regulated DEGs were primarily involved in poly(A) RNA binding, RNA binding, and organic cyclic compound binding, while the down-regulated DEGs were primarily involved in cell adhesion molecule binding, protein complex binding, and integrin binding. In addition, GO cell component (CC) analysis also revealed that the up-regulated DEGs were primarily involved in nucleoplasm, chromosomal part, and chromosome, while the down-regulated DEGs were primarily involved in extracellular exosomes, extracellular vesicle and extracellular organelle.
Gene Ontology Term Enrichment Analysis of Differentially Expressed Genes Associated With Osteosarcoma.

KEGG Pathway Analysis
The significant enrich pathways analyzed by KEGG pathway enrichment was shown for the up-regulated and down-regulated DEGs separately (Table 2). The up-regulated DEGs were primarily enriched in cell cycle, DNA replication, and platelet activation, while the down-regulated DEGs were mainly enriched in cancer pathways, leukocyte transendothelial migration, regulation of actin cytoskeleton, and PI3K-Akt signaling pathway.
KEGG Pathway Analysis of Differentially Expressed Genes Associated With Osteosarcoma.

Module Screening From the PPI Network
A PPI network of the DEGs, which consist of 527 nodes and 2587 edges, was constructed based on STRING database by Cytoscape. The top 10 hub nodes with higher degrees were further screened, including DSN1 (DSN1 homolog, MIS12 kinetochore complex component), MIS12 (MIS12, kinetochore complex component), SPC24 (SPC24, NDC80 kinetochore complex component), BIRC5 (baculoviral IAP repeat containing 5), CDCA8 (cell division cycle associated 8), STAG2 (stromal antigen 2), MAD2L1 (MAD2 mitotic arrest deficient-like 1 (yeast)), BUB1 (BUB1 mitotic checkpoint serine/threonine kinase), CENPA (centromere protein A), CSTF2 (cleavage stimulation factor subunit 2), and MLF1IP (myeloid leukemia factor-1 interacting protein). These genes showed the same node degree of 25. The functional annotations of the genes involved in the top 3 modules were analyzed (Figure 2). KEGG pathway enrichment analysis showed that the genes in module 1-3 were mainly enriched in mRNA surveillance pathway, RNA transport, and PI3K-Akt signaling pathway (Table 3).
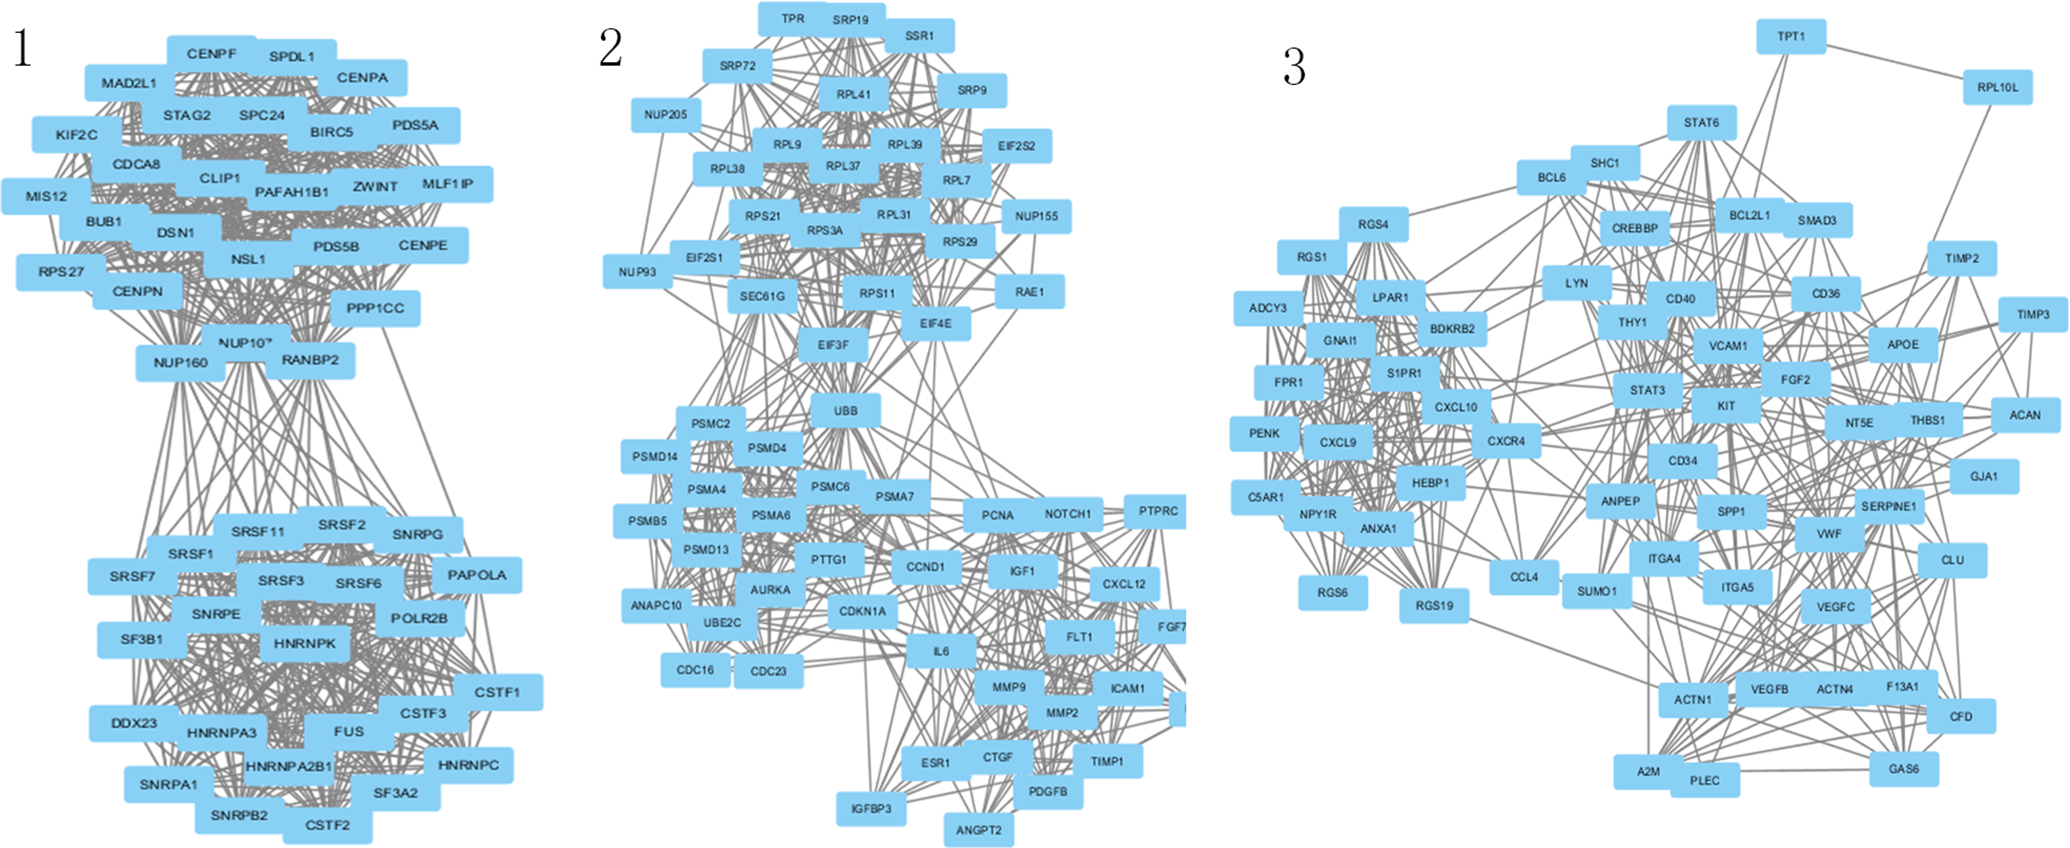
Modules 1-3 from the protein–protein interaction network of differentially expressed genes.
KEGG Pathway Analysis of Differentially Expressed Genes in Modules 1-3.

Highly Expression of 6 Genes in Osteosarcoma
We verified the differential expression of the above 10 genes in 10 pairs of osteosarcoma tissues and normal cartilage tissues by quantitative RT-PCR. The results showed that DSN1, BIRC5, CDCA8, MLF1P, MAD2L1 and SPC24 were highly expressed in osteosarcoma tissues, while the remaining 4 genes were not significantly different (Figure 3).

RT-PCR assays demonstrated high expression of 6 genes in 10 pairs of osteosarcoma tissues and normal cartilage tissues. Black columns represent normal cartilage tissue and red columns represent osteosarcoma tissue. NS-no significant, *P < 0.05, **P < 0.01, ***P < 0.001.
The Promotion of CDCA8, DSN1and BIRC5 in Osteosarcoma Cell Proliferation
Further, we knocked down the above 6 genes in osteosarcoma cell line Saos-2 cells by shRNA (Figure 4A), and verified the cell proliferation changes before and after gene knockdown by CCK-8. It was found that knockdown of CDCA8, DSN1 and BIRC5 genes significantly inhibited cell proliferation, while the other 3 genes did not significantly inhibit cell proliferation after knockdown (Figure 4B).

CDCA8, DSN1 and BIRC5 significantly promoted the proliferation of osteosarcoma cells. A, RT-PCR experiments confirmed that shRNA in Soas-2 cells has an obvious knockdown effect on 6 genes. B, The proliferation rate of 6 genes before and after knockdown was detected by CCK-8 assay.
Signal Pathways Regulated by CDCA8, DSN1 and BIRC5 in Osteosarcoma Cells
Colony formation assays demonstrated that cell proliferation was significantly reduced after knockdown of CDCA8, DSN1 or BIRC5 with shRNA (Figure 5A). It was found by western blot that BIRC5 mainly regulated the cell apoptosis pathway. DSN1 and CDCA8 were mainly involved in the regulation of cell cycle, thereby controlling cell growth (Figure 5B). These data demonstrate that CDCA8, DSN1and BIRC5 play key roles in the proliferation of osteosarcoma cells and play an important role in the development of osteosarcoma.

CDCA8, DSN1 and BIRC5 regulated cell cycle and apoptosis of osteosarcoma, which in turn promoted cell proliferation. A, The number of clones of Soas-2 cells before and after CDN8, DSN1 and BIRC5 knockdown was detected by colony formation assay. B, Western blot was used to detect the expression of cell cycle and apoptosis-related proteins in Soas-2 cells before and after CDCA8, DSN1 and BIRC5 knockdown.
Discussion
Numerical and structural chromosomal alterations associated with tumor cell migration and invasion, tumor angiogenesis, tumor apoptosis and proliferation are known to play a key role in the pathogenesis of osteosarcoma. 8 Discovery of potential molecular targets of osteosarcoma will contribute to better medical treatment and prognosis. 9 High-throughput screening in conjunction with novel analytical strategies provides an opportunity to discover novel biomarkers and predict response to corresponding therapies for osteosarcoma. 5 In the present study, we attempted to identify the potential key genes and pathways in osteosarcoma using bioinformatics analysis. The DEGs were identified between osteosarcoma samples and non-neoplastic primary osteoblast samples, followed by Gene Ontology and KEGG pathway enrichment analyze. In addition, a PPI network was constructed and analyzed. Then, we identified several key hub genes and pathways, which are potential diagnostic or therapeutic targets in OS. Collectively, the study made a better understanding of the molecular mechanisms underlying OS and provided valuable resource for improved treatment of OS.
Gene ontology term analysis showed that up-regulated DEGs were mainly involved in mitotic cell cycle process, chromatid segregation, and cell cycle process, while the down-regulated DEGs were involved in biological adhesion, cell adhesion, and movement of cell or subcellular components. According to previous reports, human cancer cells underwent cell death or senescence through induction of mitotic catastrophe. 8 This is consistent with the previous findings that defects in mitotic checkpoint may drive tumor progression. 10 It is further improved by another report that cell adhesion is responsible for the metastatic and invasive growth characteristics of osteosarcoma cells. 11 Furthermore, the enriched KEGG pathways of up-regulated DEGs included cell cycle, DNA replication, and platelet activation. Previous studies have shown that some protein kinase inhibitors inhibit osteosarcoma cell proliferation via dysregulation of cell cycle control and cell division. 12,13 Consistent with former studies, deregulated DNA replication and DNA damage response plays an important role in the early progression of major human cancer types. 14 Moreover, the interaction of tumor cells with platelets can enhance the rate of tumor embolization in the microvasculature and promote osteosarcoma proliferation via activation of the PDGFR-Akt signaling axis. 15 Down-regulated DEGs were related to cancer pathways, leukocyte transendothelial migration, regulation of actin cytoskeleton, and PI3K-Akt signaling pathway. Prior studies have demonstrated that aberration of PI3K/Akt pathway is a very common mechanism in the context of osteosarcoma. Since the PI3K/Akt pathway is crucial to cell growth and survival, 16 monitoring these signaling pathways may unravel new therapeutic agents for osteosarcoma.
We also constructed the PPI network of DEGs and listed the top degree hub genes: BIRC5, MAD2L1, Bub1, DSN1, SPC24, CDCA8, STAG2, CENPA, MLF1IP and Mis12. BIRC5 (codes for survivin protein), a member of the inhibitor of apoptosis (IAP) gene family, shows an inverse correlation with apoptosis inhibition, either directly or indirectly via inhibition of the activity of caspases via its’ baculovirus inhibitor of apoptosis repeat (BIR) protein domain. 17 Survivin is also known as a chromosomal passenger protein that plays an important role in cell division. 18 Due to its dual role in the regulation of cell division and apoptosis, activation of survivin may be an essential element in tumorigenesis. Survivin is expressed in the majority of human cancers, including human osteosarcoma. In recent study, knockdown of survivin resulted in inhibition of cell proliferation and induction of apoptosis in osteosarcoma cells, moreover, survivin may serve as an indicator of poor prognosis in patients with osteosarcoma. 19 Therefore, understanding the mechanism of involvement of survivin in osteosarcoma can potentially allow for development of diagnostics and drug therapy. MAD2L1, an important part of the anaphase-promoting complex or cyclosome (APC/C) inhibitory complex, participates in abrogation of the mitotic checkpoint, chromosome mis-segregation. 20 Evidence suggests that MAD2L1 is associated with tumor cell proliferation and aggressive behavior with a high risk of tumor recurrence and poor survival. 21 Bub1 is a conserved SAC protein kinase involved in the monitoring of chromosome segregation during mitosis in eukaryotes. 22 Therefore, dysregulation of Bub1 may lead to chromosomal instability and induce tumorigenesis. According to Wei et al., overexpression of Bub1 may block the osteosarcoma cells with multipolar spindle in metaphase, and thereby inhibit proliferation of osteosarcoma cells. 23 SPC24, a component of the conserved Ndc80 kinetochore complex, accelerates spindle expansion period through S phase, but induces a lag in anaphase. 24 However, pengpeng et al. reported that the expression of SPC24 may serve as a novel prognostic biomarker in patients with hepatocellular carcinoma. Additionally, depletion of SPC24 suppressed proliferation, adhesive ability and invasive growth of hepatocellular carcinoma cells, and increased apoptosis in hepatocellular carcinoma cells. 25 STAG2, a subunit of the cohesin complex was reported to promote correction of kinetochore-microtubule attachment errors to avoid chromosome missegregation during mitosis. As a clinically relevant tumor suppressor and an indicator of cancer prognosis, frequencies of STAG2 mutants have been reported in several types of cancers. 26,27 CENPA, a histone H3-like variant of centromeric nucleosomes, is involved in the regulation of chromosome segregation. Its overexpression was shown to lead to carcinogenesis. 28 MLF1IP, localized to human chromosome 4q35.1, has been reported to be involved in the progression of several types of malignancies, recent evidence indicates an association between MLF1IP over-expression progression and prognosis of luminal breast cancer. 29 Mis12 complex acts as a ‘hub’ that interacts with other inner kinetochore subunits, and is required for proper chromosomal segregation and cell cycle progression as a result of its crucial role in kinetochore assembly. 30 However, the role of Mis12 complex in the initiation and progression of osteosarcoma is not clear.
DSN1, which is involved in cell cycle transition, cell growth and proliferation, contributes to chromosomal alignment and segregation in HeLa cells. 23 In recent study, overexpression of DSN1 gene showed a correlation with CIN-driven progression from CRA to CRC. In contrast, depletion of DSN1 induced G2/M arrest and significantly decreased migration and invasion of colorectal cancer cells. 31 High DSN1 expression was related to poor HCC patient survival and that DSN1 can serve as an independent prognostic factor for overall survival and disease-free survival for HCC patients. 32 CDCA8 is a component of chromosomal passenger complex (CPC) in vertebrates, which is associated with correction of kinetochore attachment errors and stabilizes the bipolar spindle in human cells. 33 Furthermore, CDCA8 was shown to be involved in cancer progression via selective activation of the NF-YAL-CDCA8 pathway. 34 CDCA8 shRNA inhibited the survival and growth detected by cell number and colony formation, while promoted cell cycle G1 phase arrest determined with flow cytometry in breast cancer cells. 35 CDCA8 was overexpressed in cutaneous melanoma tissues and cells lines compared with normal tissues, and high expression of CDCA8 was significantly associated with poorer prognosis in patients with cutaneous melanoma. In in vitro experiments, CDCA8 knockdown inhibited A375 and MV3 cell proliferation, migration and invasion. 36 Our study showed that knockdown of CDCA8 and DSN1 significantly reduced cell proliferation in colony formation assays. DSN1 and CDCA8 were mainly involved in the regulation of cell cycle, thereby controlling cell growth. BIRC5-knocked out cells by CRISPR/Cas9 showed a significant decrease of survivin. Moreover, cell death and apoptosis were significantly induced in BIRC5-CRISPR/Cas9-transfected cells compared to the scramble vector. 37 Silencing of BIRC5 in neuroblastoma cell lines by various antisense molecules resulted in massive apoptosis as measured by PARP cleavage and FACS analysis. 38 Our study showed that BIRC5 regulated the cell proliferation via the apoptosis pathway in osteosarcoma. These data demonstrate that CDCA8, DSN1and BIRC5 play key roles in the proliferation of osteosarcoma cells and play an important role in the development of osteosarcoma.
On enrichment analysis of the modules in the PPI network, osteosarcoma progression showed a correlation with mRNA surveillance pathway, RNA transport, and PI3K-Akt signaling pathway. The mRNA surveillance pathway, a translation-dependent process to monitor the quality of mRNAs, serves a dual function, i.e. to discriminate normal from aberrant mRNAs and deplete aberrant transcripts from the cell. 39 Nonsense-mediated mRNA decay pathway (NMD), a conserved mRNA surveillance mechanism, may play a critical role in the progression of hereditary diffuse gastric cancer with an earlier onset of cancer. Genetic mutation of NMD gene was recently reported in patients with pancreatic adenosquamous carcinoma. 40 As an important regulator of cell proliferation, cell growth and survival, PI3K-Akt signaling pathway was reported to be activated in human tumors by a series of mechanisms, such as tumorigenesis, proliferation, invasion, cell cycle progression, inhibition of apoptosis, angiogenesis, metastasis and chemoresistance. 41 Accumulating evidences have shown that a few oncogenes are significantly correlated with the initiation and progression of osteosarcoma via activation of the PI3K/Akt pathway. Thus, clinical trials of anticancer drugs that are targeted against the PI3K/Akt pathway can be designed for subsequent treatment strategies.
Conclusion
In conclusion, we identified several genes with altered expression profiles using bioinformatics analysis, which may contribute to the current knowledge base of the pathogenesis of osteosarcoma. Based on the enrichment analysis and PPI network analysis, novel targets and biomarkers were identified to further clarify the pathogenetic mechanisms and explore potential therapeutic targets for osteosarcoma. Nevertheless, further biological investigations and clinical trials of drugs are required to elucidate the functional significance of the identified genes in osteosarcoma.
Supplemental Material
Supplemental Material, Supplemental_tables - Identification of CDCA8, DSN1 and BIRC5 in Regulating Cell Cycle and Apoptosis in Osteosarcoma Using Bioinformatics and Cell Biology
Supplemental Material, Supplemental_tables for Identification of CDCA8, DSN1 and BIRC5 in Regulating Cell Cycle and Apoptosis in Osteosarcoma Using Bioinformatics and Cell Biology by Qinwen Li, Jie Liang and Bo Chen in Technology in Cancer Research & Treatment
Footnotes
Declaration of Conflicting Interests
The author(s) declared no potential conflicts of interest with respect to the research, authorship, and/or publication of this article.
Funding
The author(s) received no financial support for the research, authorship, and/or publication of this article.
Supplemental Material
Supplemental material for this article is available online.
References
Supplementary Material
Please find the following supplemental material available below.
For Open Access articles published under a Creative Commons License, all supplemental material carries the same license as the article it is associated with.
For non-Open Access articles published, all supplemental material carries a non-exclusive license, and permission requests for re-use of supplemental material or any part of supplemental material shall be sent directly to the copyright owner as specified in the copyright notice associated with the article.