
Abstract
Keywords
Introduction
Among all cancers in the world, esophageal cancer is the sixth leading cause of death. In 2020, there will be approximately 604 000 newly diagnosed esophageal cancer cases worldwide. 1 Esophageal cancer is traditionally divided into esophageal squamous cell carcinoma (ESCC) and adenocarcinoma (EAC) subtypes based on histology. The prevalence of each subtype varies greatly depending on the geographic area.2,3 In Western countries, the incidence of esophageal squamous cell carcinoma has dropped significantly compared with adenocarcinoma, but squamous cell histology still accounts for approximately 90% of all esophageal cancer cases worldwide. Chemotherapy is the main treatment for esophageal cancer. Currently, KEYNOTE-181, 4 ATTRACTION-03, 5 and ESCORT 6 have established the standard for second-line treatment of advanced esophageal squamous cell carcinoma with PD-1 (programmed cell death receptor 1) inhibitors. However, PD-1 inhibitor was not available at the time of second-line treatment in the patients enrolled in this study, and it is necessary to explore new treatment methods.
Apatinib is a novel small molecule vascular endothelial growth factor receptor-2 (VEGFR-2) tyrosine kinase inhibitor. It strongly inhibits tumor angiogenesis by blocking the signal transduction pathway after vascular endothelial growth factor (VEGF) binds to its receptor, thus exerting an anti-tumor effect. In phase II clinical study, 7 a total of 141 patients with advanced gastric cancer or gastroesophageal junction adenocarcinoma who failed second-line and above chemotherapy were included. The patients were randomly divided into 3 groups: placebo control group, apatinib 850 mg qd group, and apatinib 425 mg bid group. Using the full analysis set (FAS), compared with the control group, apatinib not only has a certain objective response rate (ORR), but also has a survival benefit. Li and Wang 8 applied apatinib for second-line treatment to 62 patients with advanced esophageal squamous cell carcinoma who failed the first-line treatment with platinum-based chemotherapeutics. The results showed that 15 patients had PR, 31 patients had SD, 16 patients had PD, ORR was 24.2%, DCR was 74.2%, median PFS was 115 days, and median OS was 209 days. It also shows that apatinib has a significant effect on advanced esophageal squamous cell carcinoma, and may become a potential second-line treatment for advanced esophageal squamous cell carcinoma. In recent years, some studies have confirmed that apatinib has a certain effect on the second-line and above treatment of esophageal squamous cell carcinoma,9–11 but how to screen the effective population is one of the most urgent clinical problems.
Some studies have shown that some indicators in the blood reflect inflammatory changes in the tumor microenvironment.12–14 Neutrophil-to-lymphocyte ratio (NLR), platelet-to-lymphocyte ratio (PLR), lymphocyte-to-monocyte ratio (LMR), and systemic inflammation index (SII) reflected the level of systemic inflammation in the body.15,16 Some studies have found the relationship between NLR, PLR, LMR, SII, and the results of esophageal cancer surgery, radiotherapy, and chemotherapy.17–22 A study was proved that the baseline NLR value is an independent prognostic factor for patients with metastatic colorectal cancer treated with apatinib. It shows that the prognosis of patients in the high-baseline NLR group was worse than that of the low-baseline NLR group. 23 Another study to evaluate the prognostic value of preoperative PLR in the treatment of transarterial chemoembolization (TACE) combined with apatinib for advanced liver cancer was conducted on 134 patients who received TACE + apatinib (TACE-A) treatment and TACE treatment alone retrospective analysis. The study found that the PLR value can be used to predict the prognosis of patients with advanced liver cancer receiving TACE-A treatment. Patients with advanced liver cancer with a PLR value> 150 may not be suitable for TACE-A treatment. 24 A large number of studies have confirmed that platelets play an important role in the growth and metastasis of tumors. 25 Platelets interact with tumor cells through surface receptors to help tumor metastasis. 26 At the same time, tumor cells will further activate platelets, stimulate platelets to release active substances, and optimize the tumor’s growth environment. 27 Platelet volume (MPV) is a new indicator of platelet size and activity and has been thought to be a sign of platelet function and activation. 28 In recent years, studies on platelet activation to promote tumor angiogenesis have attracted widespread attention, and platelet parameters can predict the therapeutic effect of tumors.29,30 In the targeted therapy of tumors, a study found that MPV is an independent predictor of shorter PFS in the treatment of EGFR-mutant lung adenocarcinoma with EGFR tyrosine kinase inhibitors. 31 Although more and more platelet parameters have been found to be related to anti-tumor efficacy, there is no research on the relationship between platelet parameters and apatinib treatment in advanced esophageal squamous cell carcinoma.
Thus, the purpose of this study was to retrospectively analyze the clinical characteristics of 80 patients with advanced ESCC in Apatinib ≥ 2 lines treatment, analyze the effectiveness of apatinib treatment, and explore PLT and PLT/MPV on the prognostic effect in Apatinib ≥ 2 lines treatment for advanced ESCC.
Materials and Methods
Patients
We retrospectively collected a total of 915 patients diagnosed with advanced ESCC from October 1, 2017, to April 1, 2021, in Anhui Provincial Hospital. A total of 80 patients met the enrollment criteria and had complete follow-up data. The entry criteria are as follows: patients were pathologically diagnosed as progressive or metastatic ESCC; failed after receiving at least the first-line standard treatment; all patients received 250 mg or 500 mg apatinib orally daily treatment for 1 month or more; patients in the combination therapy group received apatinib in combination with paclitaxel-based or fluorouracil-based chemotherapy; patients had at least one target lesion according to RECIST Standard Version 1.1; patients took a radiological examination to assess therapeutic effect every 2 to 3 months; patients did not receive chemotherapy or radiation therapy for at least 1 month before receiving apatinib; patients did not receive long-term glucocorticoid therapy; patients did not have immune system diseases, hematological diseases, or hepatitis virus infections. We randomly selected 35 patients from the 80 patients as the internal-validation cohort.
Clinical Data Collection
Clinical data collected including gender, age, the primary site of the tumor, the number of treatment lines, single drug, or combined chemotherapy treatment, previous surgery, previous radiotherapy, and first evaluation result. Blood parameters were recorded before treatment with apatinib, including total platelet count (PLT), mean platelet volume (MPV), and then the quantitative values of PLT/MPV ratio were calculated. Progression-free survival (PFS) was measured as the time from treatment initiation to the disease progression or death.
Laboratory Testing
Blood samples were collected in the early morning when patients were at a resting state. All samples were tested by Sysmex XE-5000 automatic blood analyzers within 2 h.
Statistical Analysis
All statistical analyses and graphs were performed using Graphpad Prism version 9.0 (GraphPad Software Inc., San Diego, CA, USA) and SPSS version 26.0 (IBM Corporation, Armonk, NY, USA) software. The optimal cut-off values of baseline blood parameters were determined using X-tile software version 3.6.1 (Yale University, New Haven CT, USA). The Chi-square or Fisher’s exact test was used for comparison of rates, Student’s t-test was used for the comparison of data with normal distribution. Spearman test was used for the correlation analysis. Survival curves were estimated using the Kaplan–Meier method and the log-rank test was used for statistical comparisons. Cox regression analysis was performed for univariate and multivariate analysis. The difference was considered statistically significant at P <.05.
Ethical Approval and Informed Consent
This study was approved by the Ethics Committee of Anhui Provincial Hospital. The requirement for informed consent was waived by the ethics committee because of the study’s retrospective nature.
Statement
We have de-identified all patient details.
Results
Baseline Characteristics
The data of 80 patients had been collected. The average age of these patients was 62.58 ± 9.44 years old. All patients had received apatinib ≥ 2 lines treatment. The clinical characteristics of the total patients are shown in Table 1. Among these patients, 40 cases were treated as second-line treatment; 32 cases were treated as third-line treatment; 6 cases were treated as fourth-line treatment; 2 cases were treated as fifth-line treatment. All patients completed the efficacy evaluation, including CR 0 cases (0%), PR 18 cases (22.5%), SD 48 cases (60.0%), PD 14 cases (17.5%), ORR was 22.5%, and DCR was 82.5%.
The Clinical Characteristics of 80 Patients With Advanced ESCC.

Abbreviations: CR, complete response; PR, partial response; SD, stable disease; PD, progressive disease; Upper, upper thoracic esophageal squamous cell carcinoma; Middle, middle thoracic esophageal squamous cell carcinoma; Lower, lower thoracic esophageal squamous cell carcinoma.
The Cut-off Value for PLT and PLT/MPV Ratio
The optimal cut-off value for the PLT and PLT/MPV ratio was analyzed by X-tile software (survival time: cut-off at PFS = 135 days). The optimal cut-off value of PLT was calculated as 153, PLT/MPV ratio was calculated as 15.9. Thus, patients were divided into high PLT group (PLT > 153) (n = 56), low PLT group (PLT ≤ 153) (n = 24), high PLT/MPV ratio group (PLT/MPV ratio > 15.9) (n = 52), and the low PLT/MPV ratio group (PLT/MPV ratio ≤ 15.9) (n = 28) (Figure 1).

Cut-off values for the pretreatment blood parameters determined by X-tile software.
The Association Between the Baseline Blood Parameters and Clinical Characteristics
The Chi-square test demonstrated the difference between the baseline blood parameters and clinical characteristics. Gender, age, the primary site of the tumor, the number of treatment lines, single drug, or combined chemotherapy treatment, previous surgery, previous radiotherapy, and first evaluation result showed no difference in different blood parameter groups before the treatment (P > .05). However, PFS (PFS ≥135 days vs PFS <135 days) showed a significant difference between all different blood parameter groups (P < .001) (Table 2).
Correlation Between Hematological Parameters and Clinical Features of 80 Patients With Advanced ESCC by Chi-Square Test.

Abbreviations: ORR, objective response rate; CR, complete response; PR, partial response; SD, stable disease; PD, progressive disease; PLT, platelet; PLT/MPV ratio, total platelet count/mean platelet volume.
Kaplan–Meier Analysis in Blood Parameters
Kaplan–Meier analysis of 80 patients showed that PFS of the high PLT group (PLT > 153) was significantly longer than the low PLT group (PLT ≤ 153) (156 d vs 80 d, P < .001) (Figure 2A), and high PLT/MPV ratio group (PLT/MPV ratio > 15.9) was significantly longer than the low PLT/MPV ratio group (PLT/MPV ratio ≤ 15.9) (157 d vs 85 d, P < .001) (Figure 2B).
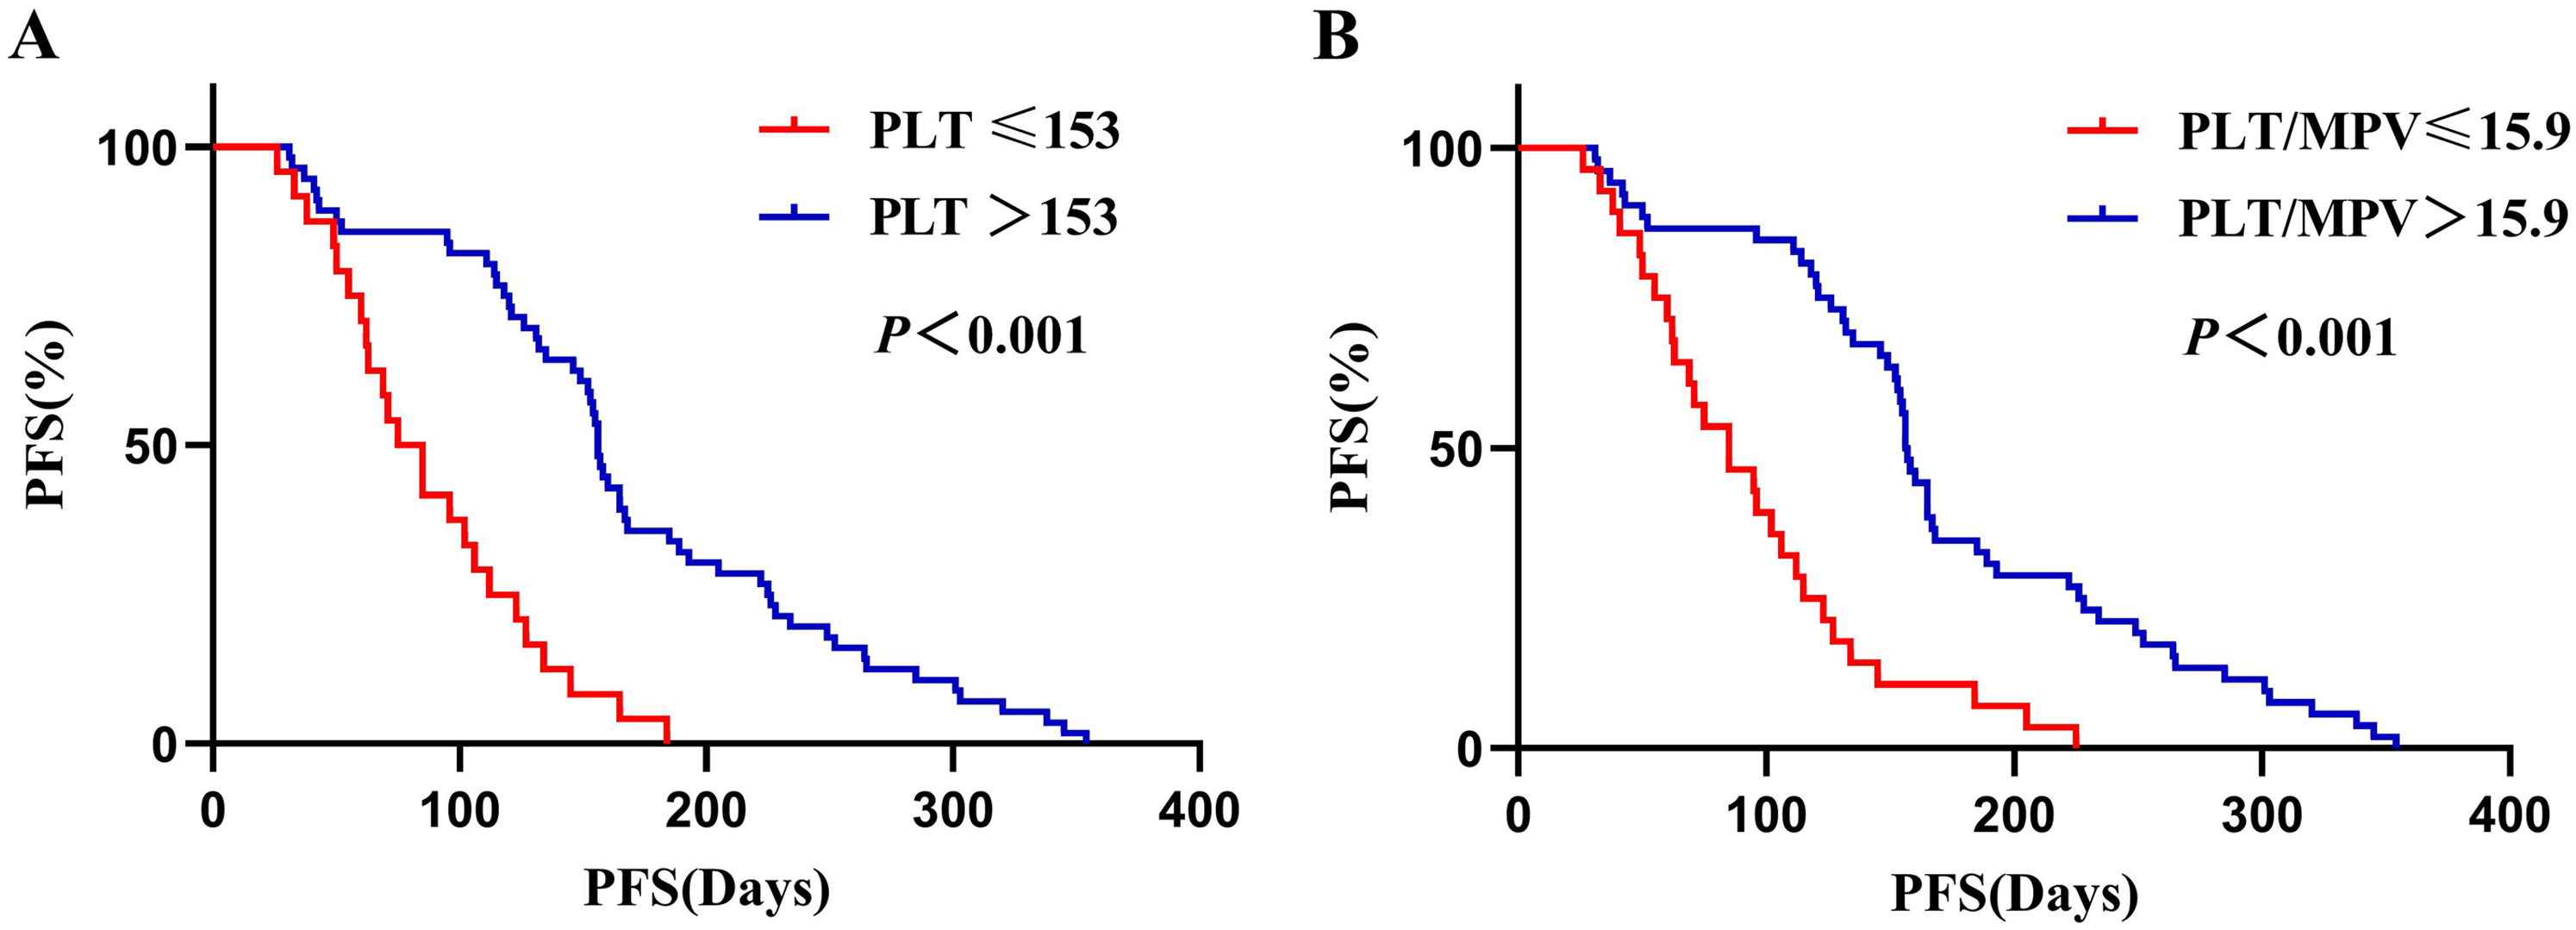
Kaplan–Meier analysis for progress-free survival (PFS) in 80 patients with advanced ESCC patients.
Correlation Analysis Between Blood Parameters and PFS
The correlation between baseline blood parameters and PFS was demonstrated by Pearson test. The results showed that PLT and PLT/MPV are pleasurable correlated with PFS, and it was statistically significant (P < .05) (Figure 3).

Correlation analysis between progress-free survival (PFS) and blood parameters in 80 patients with advanced ESCC patients.
The PFS in Patients With Different Clinical and Blood Parameters
The student’s t-test revealed the differentiation of PFS between different clinical and blood parameter groups. PFS showed no statistical difference in gender, age, the primary site of the tumor, single drug or combined chemotherapy treatment, and previous radiotherapy (P > .05). But, patients in the second-line treatment group had longer PFS than after the second-line treatment group (P = .016), the surgery group had longer PFS than the no-surgery group (P = .002), the first-time evaluation results was ORR group had longer PFS than no-ORR group (P < .001). In high PLT group (PLT > 153), PFS was longer than low PLT group (PLT ≤ 153) (P < .001); meanwhile, in high PLT/MPV ratio group (PLT/MPV ratio > 15.9), PFS was longer than low PLT/MPV ratio group (PLT/MPV ratio ≤ 15.9) (P < .001) (Figure 4).

Student’s t-test for PFS between different clinical features and blood parameters. (A) Comparison of mean PFS between the different clinical feature groups; (B) comparison of mean PFS between the different blood parameter groups.
The Univariate and Multivariate Analysis of Clinical and Blood Parameters
The univariate analysis identified that treatment lines, surgery, results of the first evaluations, pretreatment PLT and PLT/MPV ratio were significantly associated with PFS (Table 3). Multivariate analysis distinctly revealed that the treatment lines (HR: 2.725, 95% CI: 1.452-5.115, P = .002), surgery (HR: 3.176, 95% CI: 1.715-5.882, P < .001) PLT/MPV ratio (HR: 0.257, 95% CI: 0.089-0.743, P = .012) were independent prognostic factors for PFS (Table 4).
Univariate Analysis of PFS in 80 Patients With Advanced ESCC.

Abbreviations: ORR, objective response rate; CR, complete response; PR, partial response; SD, stable disease; PD, progressive disease; PLT, platelet; PLT/MPV ratio, total platelet count/mean platelet volume.
*P<.05, the difference was statistically significant.
Multivariate Analysis of PFS in 80 Patients With Advanced ESCC.

Abbreviations: PLT, platelet; PLT/MPV ratio, total platelet count/mean platelet volume.
Kaplan–Meier Analysis of Blood Parameters for Internal Validation
Kaplan–Meier analysis of 35 patients from the internal-validation datasets showed that PFS of the high PLT group (PLT > 153) was significantly longer than the low PLT group (PLT ≤ 153) (149 d vs 73 d, P < .001) (Figure 5A), and high PLT/MPV ratio group (PLT/MPV ratio > 15.9) was significantly longer than the low PLT/MPV ratio group (PLT/MPV ratio ≤ 15.9) (149 d vs 80 d, P = .006) (Figure 5B).

Kaplan–Meier analysis for progress-free survival (PFS) in 35 patients from internal-validation cohort.
Discussion
There were some studies about the relationship between blood parameters and esophageal cancer, but most studies reveal the relationship between blood parameters and the results of surgery, radiotherapy, and chemotherapy.17–22 The relationship between PFS of targeted therapy for advanced ESCC and blood parameters had not been fully uncovered.
Platelet activation is a common phenomenon in cardiovascular diseases, such as acute ischemic stroke, myocardial infarction, and renal artery stenosis.32,33 The clinical significance of this process in several malignant tumors has received more attention.34,35 The 2 main aspects of evaluating platelet activation status are PLT and MPV. 36 As the 2 main indicators of platelet activation, the clinical significance of PLT and MPV in ESCC patients has received increasing attention. Our study demonstrated that the baseline PLT and PLT/MPV ratio had a preliminary prognostic value of PFS in the light of univariate analysis, and we found high PLT group (PLT >153) and high PLT/MPV ratio group (PLT/MPV ratio >15.9) had a superior PFS. Multivariate analysis showed PLT/MPV ratio was the independent factor of PFS. The Chi-square test and student’s t-test both revealed that PLT and PLT/MPV ratio of baseline had a relationship with PFS. Kaplan-Meier analysis showed PFS of patients in high PLT group (PLT > 153) was longer than low PLT group (PLT ≤ 153), and high PLT/MPV group (PLT/MPV ratio > 15.9) was longer than low PLT/MPV ratio group (PLT/MPV ratio ≤ 15.9). We did not find the prognostic significance of MPV in the treatment of apatinib for advanced ESCC patients. Zhang et al 37 found that baseline PLT and MPV (COP-MPV) before surgery were independent prognostic factors for DFS and OS, and could be used as an effective predictor of survival for ESCC patients after surgery.
Angiogenesis is an important pathological feature of tumor occurrence and development. It can not only provide oxygen to tumor cells but also deliver proteases and cytokines that help tumor cells penetrate and spread. Tumor angiogenesis is closely related to platelets. 38 Platelets come into contact with prethrombus structures such as collagen in blood vessels, causing changes in blood flow, and endothelial cells release von Willebrand factor to activate platelets. Activated platelets mainly release regulatory factors that promote angiogenesis, such as VEGF and PDGF. It also releases regulatory factors that inhibit angiogenesis, such as endostatin, thrombin sensitive protein 1, etc, and releases TGF-β, which has a bidirectional regulation of angiogenesis. These substances jointly regulate tumor angiogenesis. Most scholars believe that in terms of angiogenesis, the promoting effect of platelets is greater than the inhibiting effect.39–41 VEGF has high specificity to endothelial cells and is the most effective mitogen inducer to promote angiogenesis. Under hypoxic conditions, it can effectively bind to the VEGF receptor (VEGFR) on the endothelial cell membrane to phosphorylate VEGFR. Phosphorylation of VEGFR activates the mitogen-activated protein kinase signal channel, induces endothelial cells to deform, move, proliferate and divide, and promote capillary angiogenesis. The meta-analysis by Kut et al. 42 found that the level of VEGF in platelets of tumor patients increased significantly compared with healthy controls (413 ng/mL vs 216 ng/mL). Some studies also confirmed that high baseline platelet levels in tumor patients indicate a more significant increase in VEGF levels.43,44 The angiogenesis effect of VEGF is mainly mediated by VEGFR2, which is highly expressed on vascular endothelial cells. 45 Thus, VEGFR2 has become an important target for tumor therapy. 46 As an anti-angiogenic drug, apatinib blocks the signal transduction pathway after the binding of VEGF to its receptor and has shown certain efficacy in the treatment of a variety of solid tumors.47,48 In our study, we speculate that patients in the high PLT group and high PLT/MPV ratio group at baseline have a more significant increase in VEGF levels compared to patients in the low PLT group and low PLT/MPV ratio group, thus having a better effect on the treatment of apatinib.
This study had some limitations. This research was a single-center retrospective study. There might be selection and information bias due to the study design and the sample size of patients included in the study was relatively small. Nowadays, the second-line standard treatment for advanced esophageal squamous cell carcinoma is PD-1 inhibitors, and the use of apatinib may not be appropriate. Thus, multi-center, prospective, and larger population studies are needed to verify these results.
Conclusions
This study aimed to investigate the prognostic significance of platelet (PLT) and platelet to mean platelet volume (PLT/MPV) ratio for advanced ESCC patients with apatinib second-line or late-line treatment. Baseline PLT and PLT/MPV ratio was a significant predictor of outcome and a high level of baseline PLT and PLT/MPV ratio suggested superior PFS in apatinib ≥ 2 lines treatment for advanced ESCC patients.
Footnotes
Abbreviations
Acknowledgments
The authors thank all the patients who participated in this study.
Declaration of Conflicting Interests
The authors declared no potential conflicts of interest with respect to the research, authorship, and/or publication of this article.
Funding
The authors received no financial support for the research, authorship and/or publication of this article.