
Abstract
To compare the dosimetric influence of applicator displacement on two-dimensional brachytherapy (2D-BT) and three-dimensional brachytherapy (3D-BT) for cervical cancer. Nineteen patients who received computed tomography-guided tandem-and-ovoid (T&O) brachytherapy were retrospectively selected. Both 2D (point-based) and 3D (volume-based) plans with and without virtual applicator displacement in the 3 axes were created for each patient. Dose changes at point A, D90 of the high-risk clinical target volume (HR-CTV) and intermediate-risk CTV (IR-CTV), and the D0.1cc, D1cc, D2cc, and D5cc of organs-at-risk (OARs) caused by applicator displacement were evaluated. Both 2D-BT and 3D-BT plans were sensitive to T&O applicator displacement. The D90 of the CTV and the dose at point A were very sensitive to applicator displacement in the right–left direction (X-axis). An applicator shift of >2 mm in the X-axis resulted in a change of >5% in the dose at point A and D90 of HR-CTV and IR-CTV. In addition, the doses to the OARs were mostly affected by applicator displacement in the anterior–posterior direction (Z-axis). A displacement of <1.5 mm in the Z-axis was required to avoid a dose change of >10% for OARs. For both 2D-BT and 3D-BT plans, T&O displacement greater than ± 2 mm in the X-axis or T&O applicator displacement ± 1.5 mm in the Z-axis resulted in significant dose changes to the tumor and OARs. In comparison with 3D-BT plans, 2D-BT plans delivered a higher dose to the tumor, and the OARs received more undesirable doses when applicator displacement occurred. The influence of applicator displacement on the doses to the tumor and OARs differed between 2D-BT and 3D-BT. Physicians should take individual patient differences into account when selecting a brachytherapy plan to mitigate the influence of applicator displacement.
Introduction
The Groupe Européen de Curiethérapie-European Society for Therapeutic Radiology and Oncology Working Group recommends a combination of external beam radiotherapy (EBRT) and brachytherapy as the standard treatment for advanced cervical cancer.1-3 The major advantage of brachytherapy is the steep dose gradient around the radioactive source, which ensures that the tumor cell receives a higher radiation dose with the surrounding organs at risk (OAR) spared to the largest degree. There are 2 main types of brachytherapy technologies currently used in clinical practice. Two-dimensional conventional brachytherapy (2D-BT) 4 uses orthogonal 2D X-ray images to prescribe a dose to a specific well-defined point (eg, point A) and to obtain a pear-shaped isodose distribution. 2D-BT is widely used because of its simplicity and practicality, especially in developing countries. 3D image-guided brachytherapy (3D-BT)5,6 improves over 2D-BT by using 3D computed tomography (CT) and/or magnetic resonance imaging (MRI) images to better delineate the tumor target and OARs. Both target coverage and OAR sparing are then evaluated accurately in the brachytherapy treatment planning system (TPS). 7
In current practice, both brachytherapy techniques include the process of transferring the patient from the gynecological room to the X-ray/CT/MRI imaging room, and then to the brachytherapy room, which inevitably causes applicator displacement8-10 even with an immobilization device. Wulf et al 10 investigated the intra-fractional applicator displacement and found that the standard deviations (SD) of variability were 2.5 mm (minimum/maximum, − 17/+ 19 mm), 5.5 mm (minimum/maximum, − 21/+ 23 mm), and 4.2 mm (minimum/maximum, − 15/+ 18 mm) in the right–left (X-axis), caudal–cranial (Y-axis), and anterior–posterior (Z-axis) directions, respectively. On the basis of 2D radiographs, a maximum applicator displacement of 12 mm has been demonstrated even with an applicator immobilization device, 9 while a 0.94-cm shift in the caudal–cranial direction has been reported by Ebruli et al. 8 Previous studies have demonstrated that applicator displacements can result in significant dose changes in 2D-BT11,12 or 3D-BT plans. 13 However, few studies have focused on comparing the influences of these displacements on 2D-BT and 3D-BT plans. Moreover, comprehensive data clarifying the applicator shift direction that has a greater influence on the dose changes to the tumors and OARs is not available. Therefore, a systematic and comprehensive study on the relationship between applicator displacement and dose deviation of tumors and OARs in both 2D-BT and 3D-BT treatments is necessary. Thus, this study aimed to compare the sensitivity of dosimetric parameters to applicator displacement in 2D-BT plans with that in 3D-BT plans and to identify the direction of applicator displacement showing the maximum influence on both plans.
Materials and Methods
Patients
We used 19 patient datasets in our retrospective study, with a median patient age of 50 years old. These patients were diagnosed with cervical cancer (International Federation of Gynecology and Obstetrics stage IIb-IIIb) and treated at Anhui Provincial Cancer Hospital between August 2016 and October 2017. Histologic findings revealed squamous cell carcinomas in 18 patients and adenocarcinoma in 1 patient. All patients were treated first with EBRT and then with CT-based high dose rate (HDR) brachytherapy. Written informed consent was obtained from each patient before EBRT and HDR brachytherapy. The EBRT dose was 45 Gy in 25 fractions over 5 weeks and was delivered with intensity-modulated radiation therapy (IMRT) or volumetric modulated arc therapy (VMAT).
Preparation and Imaging
On the basis of the vaginal anatomy and the length of the uterine cavity of different patients, different tandems (angle: 15°, 30°, or 45°) and ovoids (size: 16, 20, or 25 mm diameter) were inserted by an experienced radiation oncologist. For each patient, after implantation of a tandem and ovoid (T&O) applicator (Varian Medical Systems, Inc.), damp gauze was packed into the vagina to prevent the movement of the applicators. A Foley balloon was also placed and pulled down to be seated on the bladder trigone with an 7-mL injection of contrast agent to allow clear visualization of the bladder location. Before imaging and dose delivery, the bladder was emptied and refilled to a fixed saline volume of 100 cm3. CT images with a 2.5-mm slice thickness were obtained on Discovery CT590 RT (General Electric Company), with a protocol of 120 kV and 500 mAs per slice and a 50-cm field of view (FOV). The CT images were then transferred to a BrachyVision 10.0 (Varian Medical Systems, Inc.) treatment planning system (TPS). According to the GEC-ESTRO recommendations,1,3,5 a doctor contoured the high-risk clinical target volume (HR-CTV), the intermediate-risk clinical target volume (IR-CTV), and OARs, including the bladder, rectum, sigmoid, and intestine. Based on the contoured CT images, both 2D-BT and 3D-BT plans were created for each patient.
2D-BT Treatment Planning (Point A-Based)
Based on the Manchester system, the points 2 cm above and 2 cm lateral to the cervical os were defined as point A (left and right). In accordance with the instructions of the ICRU No. 38 report, 14 the bladder point was located at the central point of the Foley catheter at the anterior–posterior radiograph and the point on the lowest posterior surface on the lateral radiograph. The rectum point was defined as the midpoint of T&O and 0.5 cm behind the posterior vaginal wall. A dose of 6 Gy was prescribed to point A in all the patients. Meanwhile, the doses to the bladder and rectum points were maintained below 4.8 Gy (80% of the dose to point A).
3D-BT Treatment Planning (Volume-Based)
The total physical doses in EBRT and 3D-BT were normalized to a biologically equivalent dose of 2 Gy per fraction (Gy/F) (EQD2) using a linear-quadratic model with α/β = 10 Gy for tumor effects and α/β = 3 Gy for late normal tissue damage. To meet the dose requirements 15 of D90 > 85 Gy (EQD2) for the HR-CTV, D90 > 60 Gy (EQD2) for the IR-CTV, D2cc < 90 Gy (EQD2) for the bladder, and D2cc < 75 Gy (EQD2) for the rectum, sigmoid, and intestine, the physical dose objectives of 3D-BT were 6 Gy/F for HR-CTV and 3 Gy/F for IR-CTV, while the D2cc of OARs was less than 5.5 Gy in the bladder and 4.3 Gy in the rectum, sigmoid, and intestine. A volume optimization algorithm was adopted to accomplish the above goals, and dose–volume histograms (DVHs) were used to evaluate the dosages to the target and OARs.
Simulation of Applicator Displacement
To evaluate the influence of applicator displacement on the dose to the CTV and OARs, the applicators in the 2D-BT and 3D-BT plans were virtually moved in 3 directions: left (+ X) or right (−X), cranial (+ Y) or caudal (− Y), and anterior (+ Z), or posterior (−Z). Since most of the current studies reported displacement measurements of less than 1 cm in clinical practice,9-11,16-18 we set the simulated shift distances as ± 0.15, ± 0.2, ± 0.4, ± 0.6, ± 0.8, and ± 1 cm in this study. After changing the spatial position of T&O, the dwell times and relative positions of the radiation sources in the applicators remained the same as those in the original plans for both 2D-BT and 3D-BT.
Statistical Analysis
The dosimetric changes to the tumor target (A1, A2, and D90 of HR-CTV and IR-CTV) and the doses to the 0.1, 1, 2, and 5 cm3 volumes (D0.1cc, D1cc, D2cc, D5cc) received by the bladder, rectum, sigmoid, and intestine were quantified and compared. The relative differences were calculated as ΔD = (Dshift−Dunshift)/Dunshift (%), where Dshift is the dose with shifts and Dunshift is the dose without shifts. The median values of the sample data were used for statistical processing of percentage dosimetric changes. The maximum ranges of applicator displacements in the 3 directions were evaluated when the dosimetric changes to the tumor and OARs were limited to below 5% or 10%. Finally, the dose sensitivities of the applicator displacements for the 2D-BT and 3D-BT plans were compared. The Wilcoxon signed-rank test for nonparametrically distributed data was used to determine the differences in dose parameter changes between the 2D-BT and 3D-BT plans. All tests were 2-sided, and a difference of P < .05 was considered statistically significant. The statistical analysis was performed using SPSS software (IBM Corp.).
Results
Dosimetric Results for 2D-BT and 3D-BT Plans Without Applicator Displacement
Table 1 presents the median differences between the planned dose to the tumor (A1, A2, D90 of HR-CTV, and IR-CTV) and the prescribed dose (HR-CTV: 600 cGy, IR-CTV: 300 cGy, point A: 600 cGy) and the median differences between the planned dose to OARs (D2cc of bladder, rectum, sigmoid, and intestine) and the dose limits (D2cc of bladder: 550 cGy, D2cc of rectum/sigmoid/small intestine: 430 cGy) without applicator displacement. The results of the Wilcoxon signed-rank test for comparison of the 2D-BT and 3D-BT plans are also presented. Both the 2D-BT and 3D-BT plans achieved the goals of treatment planning. Under these conditions, the doses to the tumor and OARs in the 2D-BT plans were higher than those in the 3D-BT plans. Specifically, the median dose differences (MDDs) of D90 of the HR-CTV and IR-CTV in 2D-BT plans were significantly higher than those in 3D-BT plans (P < .05). For the D2cc of OARs, the MDDs for the bladder, sigmoid, and intestine in the 2D-BT plans were significantly higher than those in the 3D-BT plans (P < .05).
Results of Wilcoxon-Signed Rank Test for Comparison of the Median Differences in the Planned Dose and Prescribed Dose for Both 2D-BT and 3D-BT Plans Without Applicator Displacement.
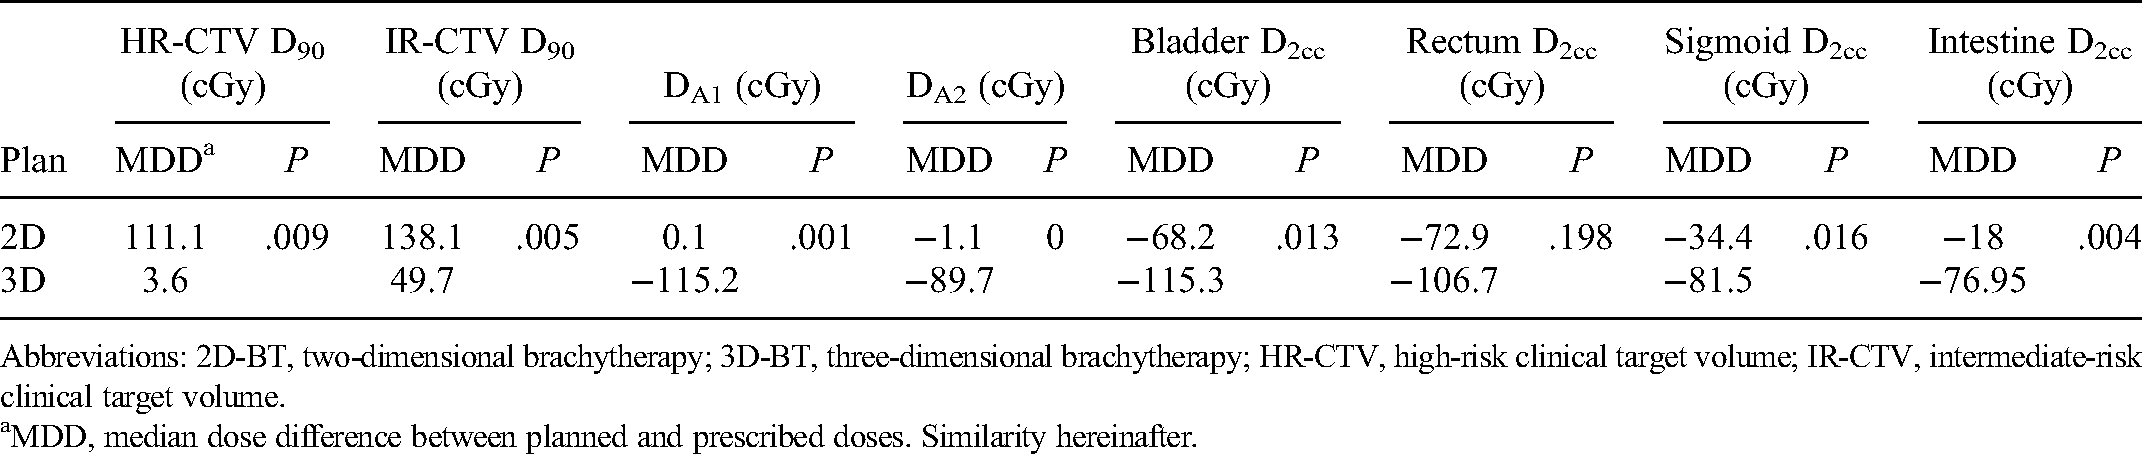
Abbreviations: 2D-BT, two-dimensional brachytherapy; 3D-BT, three-dimensional brachytherapy; HR-CTV, high-risk clinical target volume; IR-CTV, intermediate-risk clinical target volume.
MDD, median dose difference between planned and prescribed doses. Similarity hereinafter.
Dosimetric Influence of Applicator Displacement on Tumor
Figure 1 shows the change in the median percentage dose to D90 of the HR-CTV, IR-CTV, A1, and A2 when virtually shifting the T&O in the X, Y, and Z axes for the 2D-BT and 3D-BT plans. The overall trend of the percentage dose change to the CTV and point A caused by applicator displacement in the 2D-BT plans was similar to that in the 3D-BT plans. Only a small difference in the degree of change was observed between the 2 types of plans. In particular, the median percentage deviation of D90 of the HR-CTV was less than zero (ΔD90 < 0) when shifting along the X, Y, and Z axes. Moreover, over the same degree of displacement in the 3 directions, the displacement in the X-axis had the greatest influence on the dose change of HR-CTV, followed by the Z and Y axes. More than 2 mm of applicator displacement in the X-axis resulted in more than 5% dosimetric change to D90 of the HR-CTV in both brachytherapy plans (Table 2).
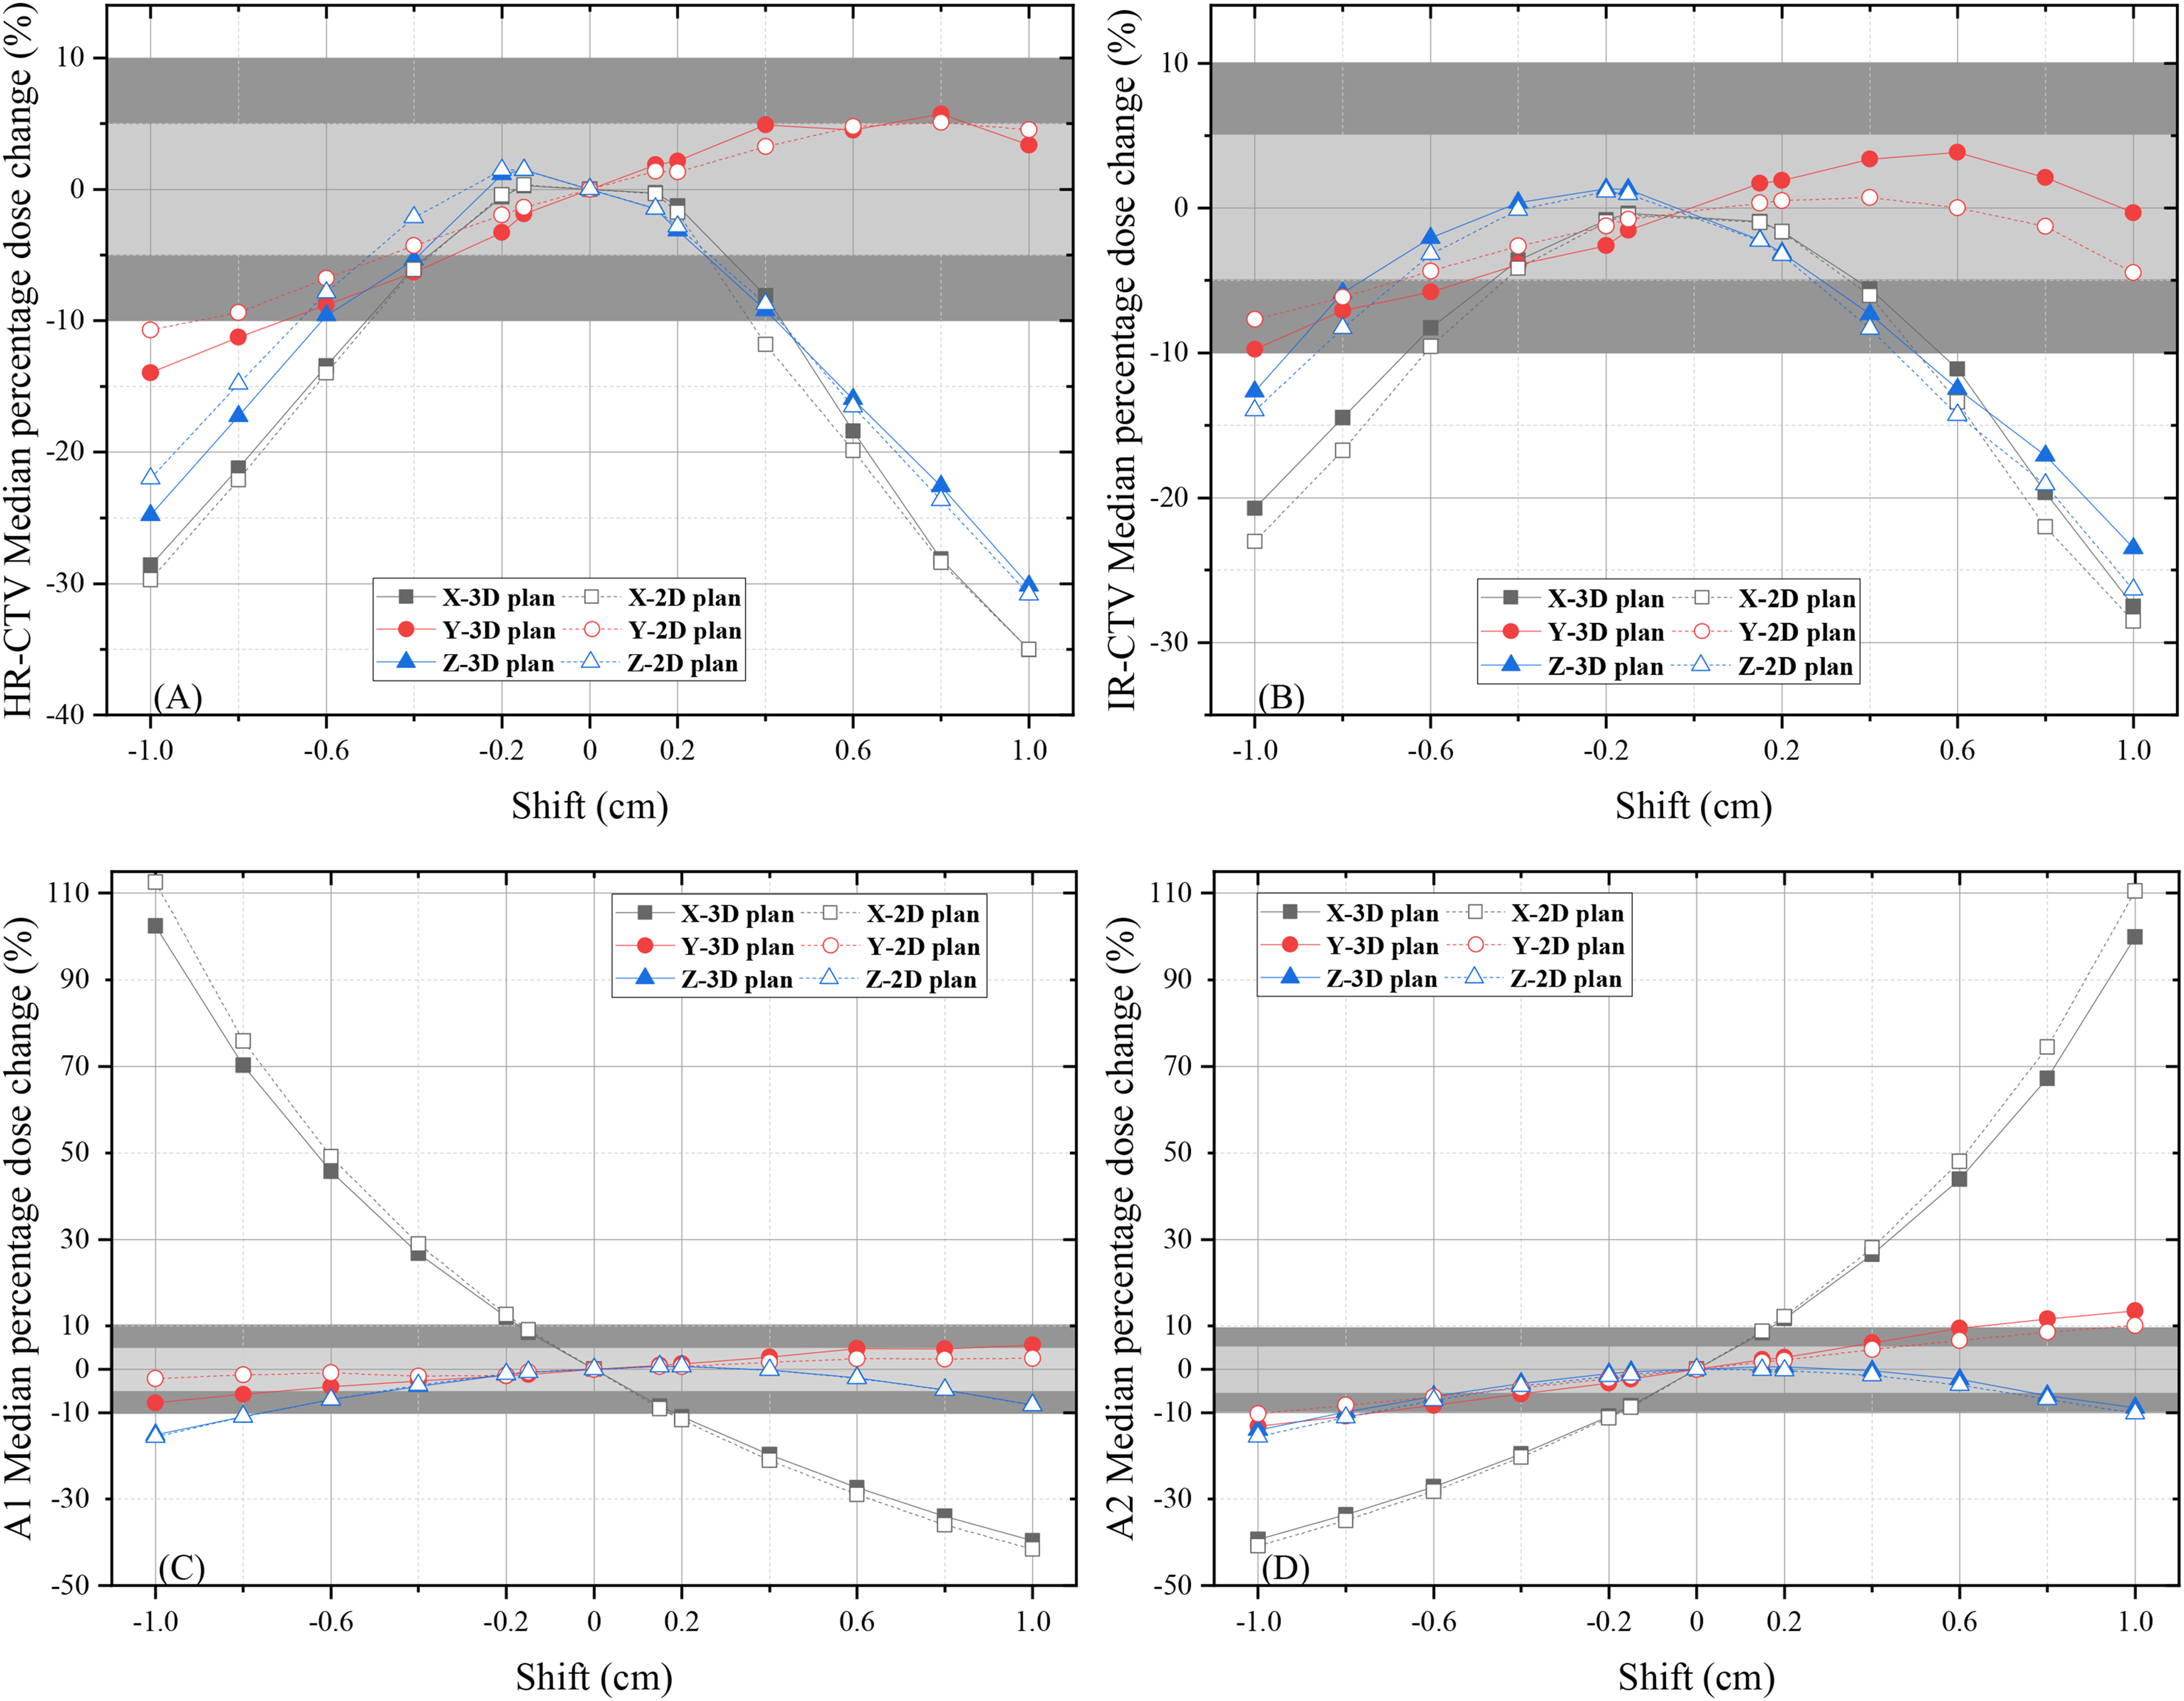
The changes in the median percentage dose to D90 of the HR-CTV (A), IR-CTV (B), A1 (C), and A2 (D) when virtually shifting the T&O in the X, Y, and Z axes in the 2D-BT and 3D-BT plans. The grey areas and dark areas represent median percentage dose changes exceeding 5% and 10%, respectively.
Maximum Distance Limit (mm) for Less Than 5% Dose Changes to the Tumor Target in Both 2D-BT and 3D-BT due to Applicator Displacement in the X, Y and Z Axes.

Abbreviations: 2D-BT, two-dimensional brachytherapy; 3D-BT, three-dimensional brachytherapy; HR-CTV, high-risk clinical target volume; IR-CTV, intermediate-risk clinical target volume.
* “–” means even a small displacement (1.5 mm) could cause a percentage dose change of more than 5%.
Similarly, shifting of the applicators in the X-axis had the greatest impact on the changes in the median percentage dose to point A1/A2. As illustrated in Table 2, even a displacement of 1.5 mm in the X-axis alone would lead to a change greater than 10% in the dose to the point A1/A2 in both the 2D-BT and 3D-BT plans, while the shifts in the Y or Z axes had relatively lower effects on the point A1/A2 dose.
Dosimetric Impact of Applicator Displacement on OARs
Figure 2 shows the change in the median percentage dose to the OARs in the 2D-BT and 3D-BT plans when simulating T&O displacement in the X, Y, and Z axes. Similarly, the overall trend of the percentage dose changes to the OARs caused by applicator shifts in these 2 types of plans were comparable, with a small difference in the degree of change. For all OARs, the shift in the Z-axis evidently had the greatest effect on the dose change. In addition, the dose to a smaller reference volume of OARs was more sensitive to T&O displacement. For instance, the range of variation was as follows (from broad to narrow): D0.1cc (−50% to 140%), D1cc (−40% to 110%), D2cc (−40% to 100%), and D5cc (−40% to 80%).

Changes in the median percentage doses to D0.1cc, D1cc, D2cc and D5cc of the bladder, rectum, sigmoid, and intestine when virtually shifting the T&O in the X, Y, and Z axes for 2D-BT and 3D-BT plans. The gray areas in these plots indicated that the change in the percentage dose was less than 10%.
Table 3 summarizes the maximum distance limits (mm) for changes of less than 10% to the D2cc of OARs in both the 2D-BT and 3D-BT plans due to applicator displacements. For the bladder, only when the displacement in the Z-axis was maintained within ± 2 mm (or −2 to 1.5 mm), the D2cc of the bladder in 2D-BT (or 3D-BT) plans could present a relatively low dosimetric change of less than 10% in D2cc. The shift in the Y-axis played a relatively smaller role than the influence of the displacement in the X-axis. In contrast, the X-axis displacement (within ± 10 mm) resulted in a percentage dose change of no more than 10% to the rectum and sigmoid for 2D-BT or 3D-BT. In addition, to ensure a dosimetric change of less than 10% in D2cc of the rectum (or sigmoid), a value of less than 1.5 mm (or 2 mm) in the Z-axis displacement was required for both BT plans. The shifts in the X or Y axes had a relatively greater influence on the dose changes in the intestine than those in the other OARs. To control the percentage change in the D2cc of the intestine within 10%, the displacement in the Z-axis had to be restricted to a small range (±2 mm for 2D-BT; −4 to 2 mm for 3D-BT).
Maximum Distance Limit (mm) for Dose Changes of Less Than 10% of the D2cc of OARs in Both 2D-BT and 3D-BT as a Result of Applicator Displacement in the X, Y, and Z Axes.

Abbreviations: 2D-BT, two-dimensional brachytherapy; 3D-BT, three-dimensional brachytherapy; OAR, organs-at-risk.
Comparison of the Dose Sensitivity of 2D-BT and 3D-BT to 6-mm Applicator Displacement
In a previous study, Bou-Zeid et al 19 measured a maximum T&O applicator displacement of 6.66 mm in 14 patient cases. On the basis of their results, we assumed that the maximum range of T&O applicator displacements in the 3 axes was ± 6 mm. Figure 3 shows an example of the dose distribution for a typical patient with and without applicator displacement of ± 6 mm in the X-axis. Table 4 shows the MDDs for the tumor and OARs with an applicator displacement of ± 6 mm in 3 axes in the 2D-BT and those in the 3D-BT plans. The results of the Wilcoxon signed-rank test for comparison of the 2D-BT and 3D-BT plans are also shown in Table 4. The 2D-BT and 3D-BT plans showed significant differences in the MDDs for the HR-CTV, IR-CTV, A1, A2, bladder, sigmoid, and intestine with a shift distance of ± 6 mm in 3 axes (P < .05). In comparison with 2D-BT plans, the 3D-BT plans were more likely to show underdosing of the tumor with applicator displacement. For example, the D90 of the HR-CTV in the 3D-BT plans was underestimated when the applicator was shifted by 6 mm in the X- and Z-axes and −6 mm in the X, Y, and Z axes, while the dose was inadequate in the 2D-BT plans only when the applicator was shifted to 6 mm in the X and Z axes. In contrast, the OAR doses were more likely to exceed the dose limits with applicator displacement in the 2D-BT plans in comparison with the 3D-BT plans. The MDD of the D2cc of the bladder was much higher in the 2D-BT plans than in the 3D-BT plans with a 6-mm displacement in the Z-axis. Similar results were observed in the MDD of the D2cc of the sigmoid with a −6-mm shift in the Z-axis and that of the intestine with a 6-mm shift in the Y and Z axes.
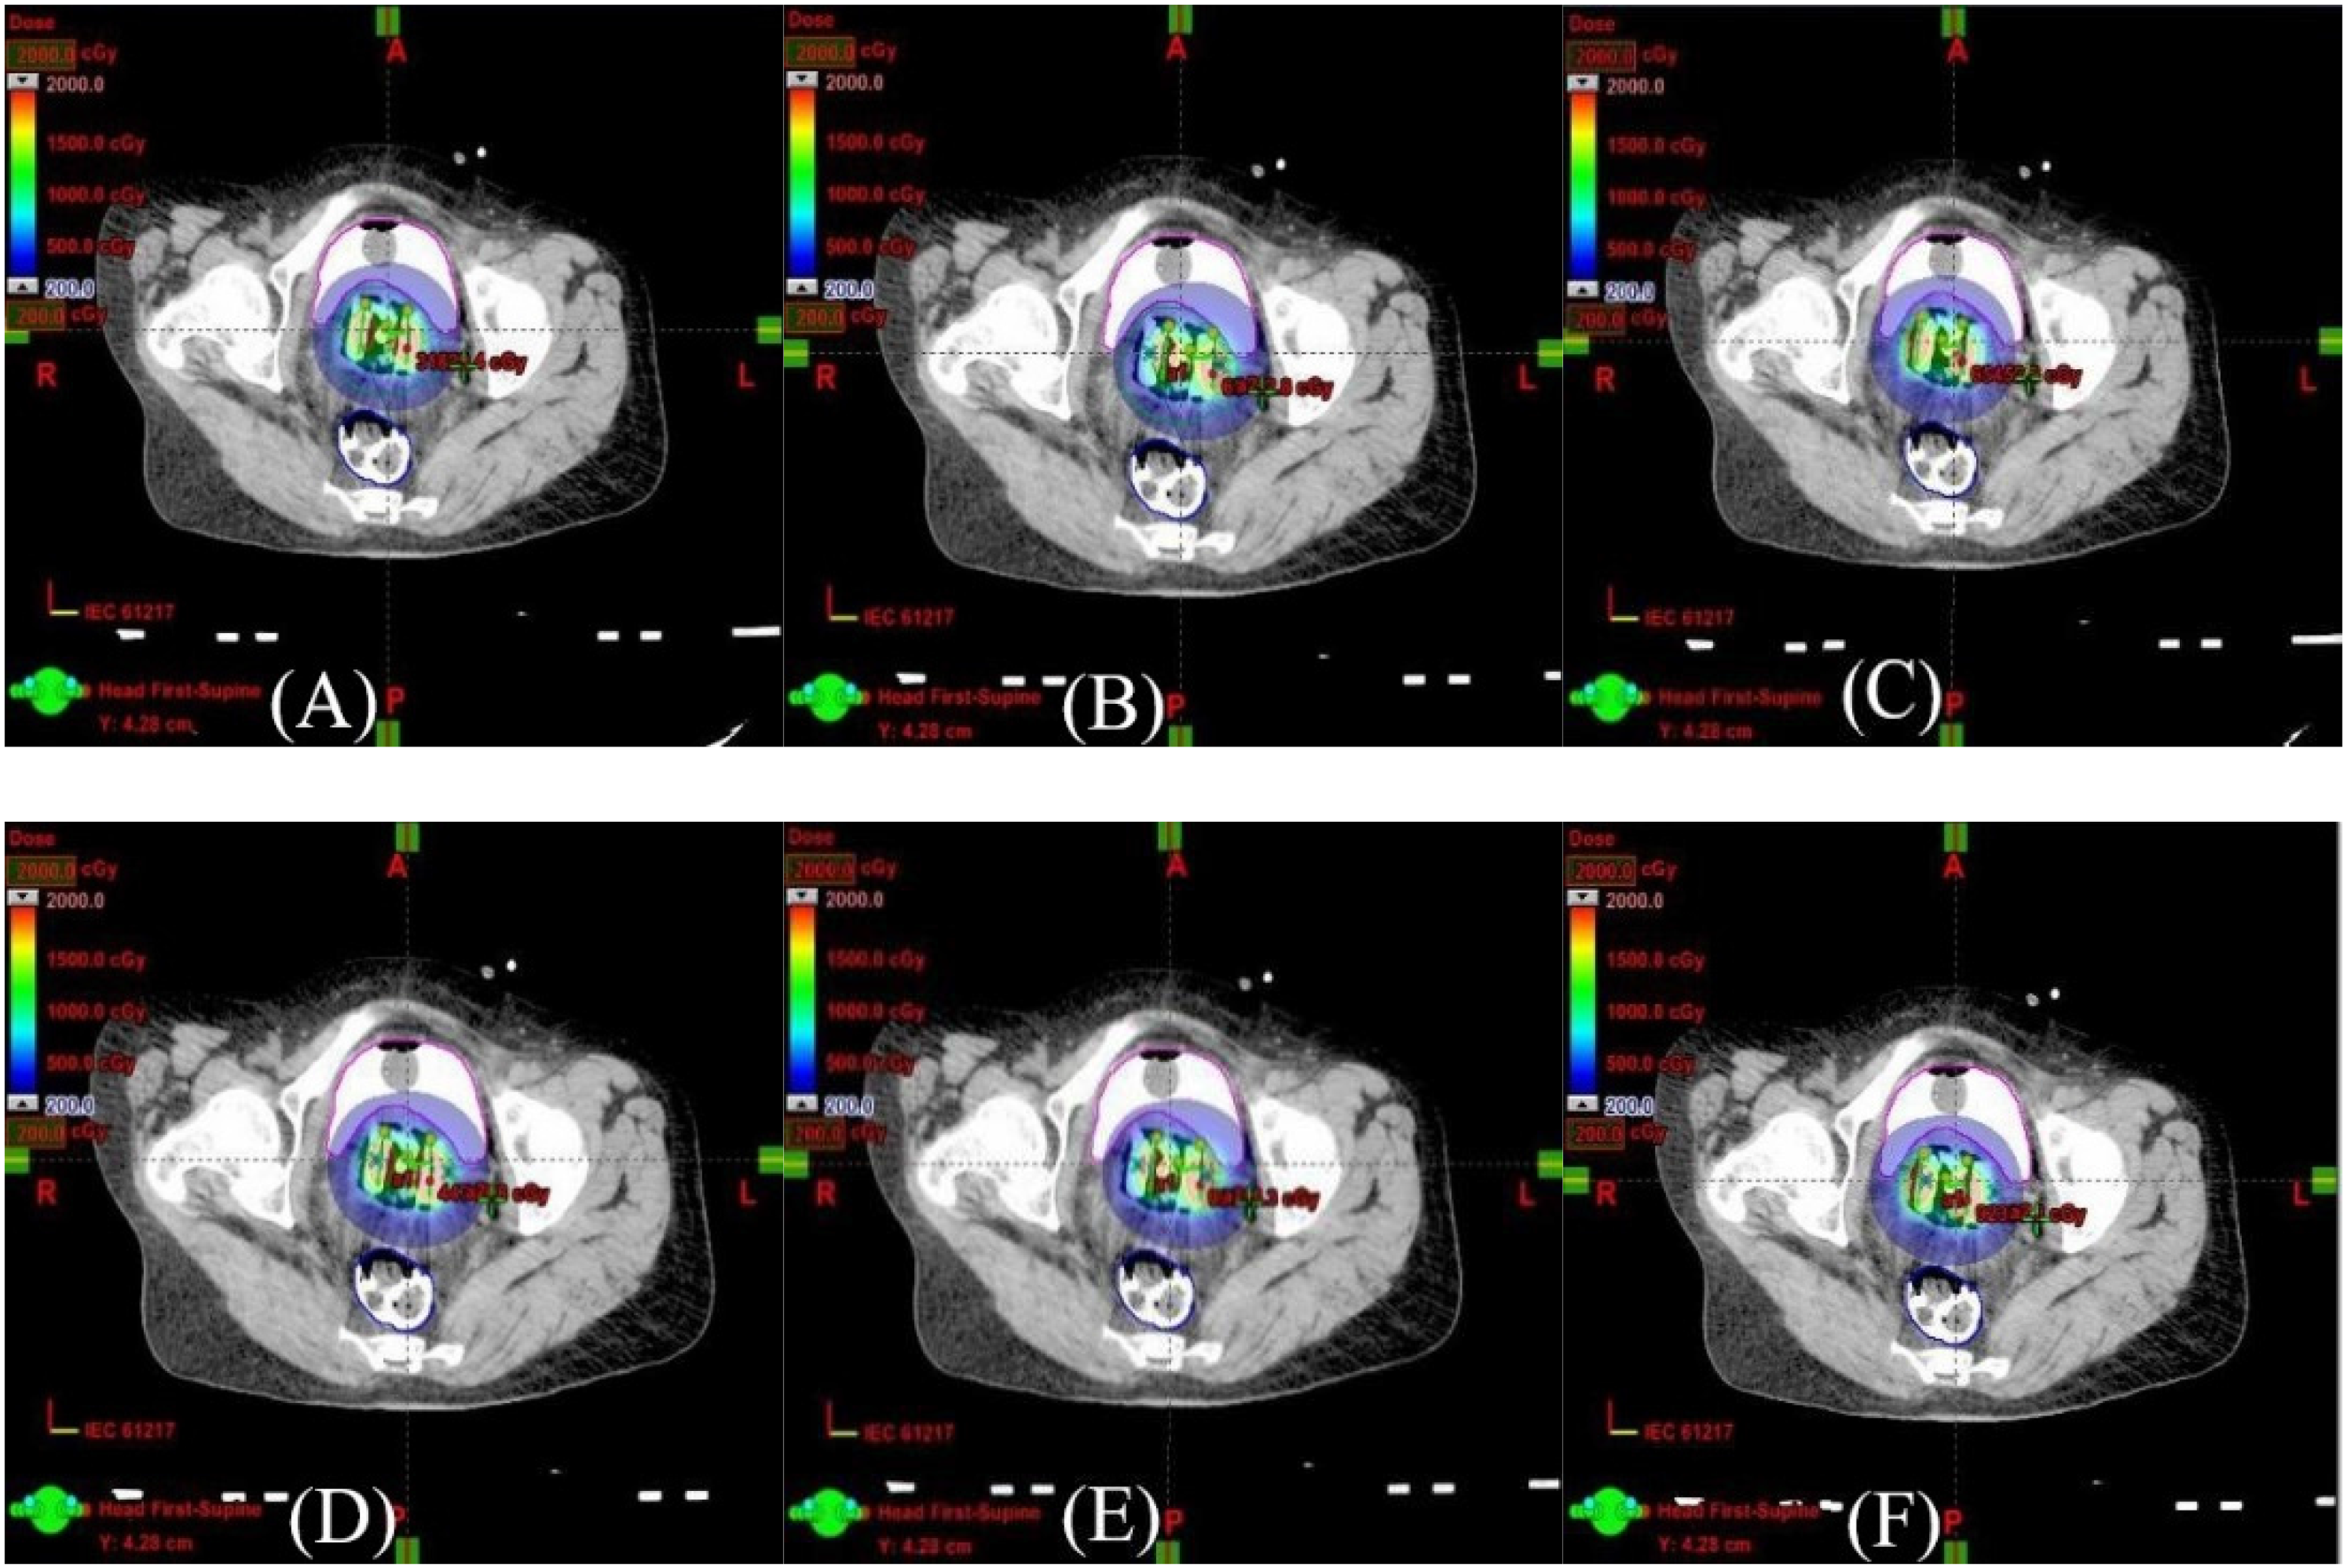
The dose distribution for a typical patient with an unshifted applicator in the 2D-BT plan (A) and the 3D-BT plan (D) and with the applicator virtually shifted by 6 mm in the X-axis in the 2D-BT plan (B) and the 3D-BT plan (E) and by −6 mm in the X-axis in the 2D-BT plan (C) and the 3D-BT plan (F).
Results of the Wilcoxon-Signed Rank Test for Comparison of the Median Differences in the Plan Dose and Prescribed Dose for Both 2D-BT and 3D-BT Plans With Applicator Displacement of ± 6 mm in 3 Axes.

Abbreviations: 2D-BT, two-dimensional brachytherapy; 3D-BT, three-dimensional brachytherapy; HR-CTV, high-risk clinical target volume; IR-CTV, intermediate-risk clinical target volume; MDD, median dose difference.
To further evaluate the influence of ± 6 mm of applicator displacement on the treatment, the total EQD2 of EBRT and 5 fractions of BT dose were calculated based on the assumption that the EQD2 of EBRT was 45 Gy. Table 5 provides the results of the Wilcoxon signed-rank test for comparison of the total EQD2 of EBRT and BT with an applicator displacement of ± 6 mm in 3 axes for both the 2D-BT and 3D-BT plans. The D90 of the HR-CTV in 3D-BT plans failed to reach the total EQD2 of 85 Gy, as recommended by Pötter et al 15 when the applicator was shifted by 6 mm in the X and Z axes and by −6 mm in the X, Y, and Z axes. However, the total EQD2 for D90 of the HR-CTV was higher than 85 Gy in 2D plans with an applicator shift of ± 6 mm in all 3 axes. For OARs, the EQD2 of the D2cc of the sigmoid and intestine in 2D-BT plans were significantly higher than those in 3D-BT plans (P < .05) with the shifted applicator, indicating that the D2cc of the sigmoid and intestine was more likely to exceed the hard constraints recommended by Pötter et al 15 in 2D-BT plans in comparison with those in 3D-BT plans.
Results of the Wilcoxon-Signed Rank Test for Comparison of the EQD2 of External Therapy and Brachytherapy With Applicator Displacement of ± 6 mm in 3 Axes and for Both 2D-BT and 3D-BT Plans.

Abbreviations: 2D-BT, two-dimensional brachytherapy; 3D-BT, three-dimensional brachytherapy; HR-CTV, high-risk clinical target volume; IR-CTV, intermediate-risk clinical target volume; EQD, equivalent dose.
Discussion
Applicator displacement during the process of brachytherapy may be caused by a combination of factors, including insufficient anesthesia, unsatisfactory vaginal packing, an ineffective immobilizing device, and patient transport among rooms (gynecological room, imaging rooms, and treatment room). Because of a large dose gradient around the radiation source, even a small displacement can result in an unacceptable dose change to the tumor and OARs. This study systematically elucidated the influence of such displacements in both the 2D-BT and 3D-BT plans. We found a significant influence of the X-axis (left–right) applicator displacement on tumor dose changes. The simulation results showed that a 1.5-mm X-axis shift leads to a dose change of more than 10% at points A1/A2 in the 2D-BT plans. This is mainly because the location of point A1/A1 is defined on the basis of the tandem applicator. Meanwhile, the deviation of the HR-CTV D90 was less than 5% for both the 2D-BT and 3D-BT plans when the X-axis applicator displacement was maintained within 2 mm. These results agree with the data provided in the literature.11-13 For the dose to the OARs, our results indicated that the Z-axis displacement caused a more significant dosimetric change compared to the displacements in the X and Y axes. In addition, the order of sensitivities of volumetric doses to applicator shifts was as follows: D0.1cc > D1cc > D2cc > D5cc. This was mainly because a small statistical volume would be more easily affected by the dose deviation. Shifting the applicator in the Y and X axes had no obvious effect on the dosimetric changes in the bladder, rectum, and sigmoid. To reduce the dose changes to OARs to less than 10%, applicators were only allowed to be shifted in the Z-axis by a very small range (1.5 mm). These results appear to agree with the findings of other reports.11-13 Furthermore, our results suggest that the D90 of the HR-CTV and D2cc of the sigmoid and intestine in 3D-BT plans were significantly lower than those in 2D-BT plans when the applicators were displaced ± 6 mm in 3 directions. This may be attributed to the better target conformity of the 3D-BT plans, which leads to a relatively lower dose to both the CTV and OARs. These results indicate that if the applicator's displacement cannot be completely avoided, physicians should choose the appropriate brachytherapy plan while carefully considering the tumor location, shape, shrinkage situation, and sparing of OARs after EBRT to minimize the effect of the displacement. For instance, if tumor shrinkage is not satisfactory for a patient after EBRT, while the dose received by OARs is low in EBRT, 2D-BT may be a better choice to ensure a higher target dose. In contrast, if tumor shrinkage is evident after EBRT, while OAR sparing is unfavorable in EBRT, 3D-BT may be a better choice.
Many techniques have been used to effectively control the shifting of applicators and thereby reduce the risk of local recurrence and the side effects of brachytherapy. The measures that have been adopted to reduce applicator displacement can be divided into 4 main categories: (1) improvement of the vaginal packing effect, (2) usage of more advanced immobilization and transport systems, (3) supervision of the shift distance, which can be used to correct the initial treatment plan; and (4) installation of a CT/MR scanner in the brachytherapy room. For the first category, techniques such as a new balloon-based approach 20 have been implemented to replace traditional gauze packing. The rectal balloon could potentially minimize patient discomfort and reduce the dose to the rectum. The resultant improvements in patient comfort could contribute to minimizing applicator displacement. For the second category, Fan et al. designed a belt immobilization system that consists of a specialized bracket, buckle, and straps. 17 Subsequently, the mean translational and rotational displacements of the applicator were set to less than 3 mm and 1.5°, respectively. In another study, using a hover transport device during patient transports between the imaging table and the treatment table, Andrew et al 17 reported a mean applicator displacement of 2.27 mm. The third category includes a real-time applicator position monitoring (RAPS) system, 21 which is an infrared marker-based system that is suitable for MRI-guided HDR brachytherapy. However, this system only focused on applicator displacement in the craniocaudal direction. The fourth category of measures aims to address the influence of patient transfer on the applicator displacement by installing a CT/MRI scanner in the brachytherapy treatment room. However, the cost of this method is usually too high to be viable.
This study had several limitations. First, the target size and shape were assumed to be unchanged before and after the application displacement because the displacement was virtually simulated in the TPS. However, the size and shape of the target may change with the position of the applicator, which may influence the dose distribution in the target and OARs. 22 Further research is needed to clarify the influence of these changes. Second, the dose calculation was based on an updated version of the American Association of Physicists in Medicine Task Group No. 43 (AAPM TG43-U1) algorithm, 23 which utilized the dose rate distributions precalculated in a standard, homogeneous water geometry. However, this algorithm neglected the specific variations in the applicator's material, packing gauze, and human tissue composition. 24 Thus, the actual dosimetric changes in the tumor and OARs may not be as high as those presented above.25,26
Conclusion
The influence of applicator displacement on HDR intracavitary 2D and 3D brachytherapy for cervical cancer was investigated and compared using simulated planning studies. The results showed that the doses to the tumor and OARs were very sensitive to applicator displacement in the X and Z axes, respectively. For both the 2D-BT and 3D-BT plans, a displacement of no more than ± 2 mm in the X-direction is permitted to avoid a significant dose change of the tumor. Meanwhile, applicator displacement in the Z-direction should be controlled within ± 1.5 mm to ensure a dosimetric change of less than 10% to the OARs. Therefore, multiple approaches to minimize the effects of applicator displacement should be developed further. Physicians should carefully select brachytherapy plans for patients on the basis of tumor location, shape, shrinkage situation, and OAR sparing after EBRT to mitigate the influence of applicator displacement.
Footnotes
Declaration of Conflicting Interests
The authors declared no potential conflicts of interest with respect to the research, authorship, and/or publication of this article.
Funding
The authors disclosed receipt of the following financial support for the research, authorship, and/or publication of this article: This work was supported by the National Natural Science Foundation of China (Grant No. 11805198), the Fundamental Research Funds for the Central Universities (Grant No. WK2030040089) and Ministry of Science and Technology of the People's Republic of China (Grant No. 2016YFC0101400).
Data Availability
The raw data extracted from the dose–volume histogram results for each treatment plan and the raw data of statistics analysis in this study are available from the corresponding author by request.
Ethics Approval
This study was performed in a treatment planning system without any clinical application. The position of the applicator was shifted virtually. This activity does not require ethical approval according to our institution's rules.