
Abstract
Objective:
Glioblastoma multiforme (GBM) is the most malignant primary brain tumor in adults. This study aimed to identify significant prognostic biomarkers related to GBM.
Methods:
We collected 3 GBM and 3 healthy human brain samples for transcriptome and proteomic sequencing analysis. Differentially expressed genes (DEGs) between GBM and control samples were identified using the edge R package in R. Functional enrichment analyses, prediction of long noncoding RNA target genes, and protein-protein interaction network analyses were performed. Subsequently, transcriptomic and proteomic association analyses, validation using The Cancer Genome Atlas (TCGA) database, and survival and prognostic analyses were conducted. Then the hub genes directly related to GBM were screened. Finally, the expression of key genes was verified by quantitative polymerase chain reaction (qPCR).
Results:
Totally, 1140 transcripts and 503 proteins were significantly up- or down-regulated. A total of 25 genes were upregulated and 62 were downregulated at both the transcriptome and proteome levels. Results from TCGA database showed that 84 of these 87 genes matched with transcriptome sequencing results. A Cox regression analysis suggested that Fibronectin 1(FN1) was a prognostic risk factor. The qPCR results showed that FN1 was significantly upregulated in GBM samples.
Conclusions:
FN1 may play a role in GBM progression through ECM-receptor interaction and PI3K-Akt signaling pathways. FN1 may be considered as a prognostic biomarkers related to GBM.
Keywords
Introduction
Glioma is one of the most common tumors originating in the central nervous system. 1 Although the treatment of glioma has made great progress in the past few decades, the clinical outcome of most patients is still poor, especially for glioblastoma (GBM), with a median survival of only 14.6 months, after timely and effective treatment, only 5% to 10% of patients can survive for 2 years. 2 In recent years, surgery combined with radiotherapy and tinidazolamide chemotherapy have become the standard treatment for glioblastoma, but even if they receive the same treatment, the survival of patients is significantly different. 3,4 Survival is affected by many factors, including treatment strategy, patient’s physical condition, and tumor characteristics. 5,6 Biomarkers related to these factors are often the key to evaluating the prognosis of patients with glioma. Targeted therapy for related markers will become a major breakthrough in the treatment of glioma in the future.
Accordingly, several previous studies have focused on the identification of potential biomarkers of GBM. 7,8 Epidermal growth factor receptor and transforming and vascular endothelial growth factors have been identified as prognostic and diagnostic markers of GBM. 9 Wei et al screened out 5 glioblastoma transcription factors and their downstream DEGs through bioinformatics analysis, and speculated that they may be potential biomarkers for clinical treatment of glioblastoma. 7 Long et al predicted and analyzed multiple key genes and pathways of glioblastoma based on bioinformatics. 10 Although some key genes related to the progression of GBM have been identified, most are based on the analysis of microarray data downloaded from public databases. There is currently no clear understanding of the exact molecular mechanism underlying GBM progression. 11,12
This study used high-throughput transcriptomics and proteomics methods to determine the prognostic biomarkers associated with GBM. We performed transcriptome and proteome sequencing on GBM and healthy control human brain samples, identified DEGs at the transcriptome level and differentially expressed proteins (DEPs) at the proteome level. The differentially expressed genes/proteins were analyzed by correlation and the consistency of the transcriptome and proteome levels were observed. The expression of related genes was further verified through the TCGA database, and the survival prognosis analysis and experimental verification of the genes with the same differential expression were carried out. Through a comprehensive analysis of these transcriptome and proteome data, it is expected to reveal the pathogenesis of GBM and provide a basis for improving the prognosis of GBM.
Material and Methods
Samples and Sequencing
Three GBM (T1, T2, and T5) and 3 healthy control (T3, T4, and T6) human brain samples were collected from our hospital. Patient demographic information is summarized in Table 1. Gene sequencing of the samples was performed and the corresponding data were uploaded to the National Center for Biotechnology Information database (SRP108388). Quality control was completed using the FASTX-Toolkit version 0.0.13 and PRINSEQ-Lite version 0.20.4. 13 The length of the lower base call accuracy (Q20) and raw and clean reads were calculated to visually demonstrate the validity and reliability of sequencing results. After preprocessing, clean reads were mapped to human reference sequence hg19 using TopHat version 2.0.8, 14 allowing for a read mismatch of 2, a read gap length of 2, and a min-anchor-length of 8.
The Demographic Information on the Patients.

Abbreviation: GBM, glioblastoma.
All the procedures in our study were approved by the institutional ethics committee of The First Affiliated Hospital of Harbin Medical University and the methods were carried out in accordance with the approved guidelines. All the patients have been informed and signed informed consent before the experiments.
Analyses of DEGs
Based on the annotation of known genes and lncRNAs provided by GENCODE version 24 (mapped to GRCh37), 15 FPKM value and read count of genes were obtained using StringTie version 1.2.2. 16 The edgeR package 17 in R was used to obtain DEGs with |log2FC| >1 and an adjusted P value of < 0.05.
Functional Enrichment Analysis
Gene ontology (GO) and Kyoto Encyclopedia of Genes and Genomes (KEGG) pathway enrichment analyses for DEGs were performed using the clusterProfiler package 17 in R.
Prediction of lncRNA Target Genes
Weighted Gene Coexpression Network Analysis (WGCNA) was performed using the WGCNA package. 18 The association between every module and disease was obtained using ANNOVAR with a cutoff P value of <0.05. We assumed that the microRNA was the target gene of the lncRNA in the same network module.
PPI Network Analysis
PPI network analysis for DEGs was conducted using STRING, 19 and the PPI network was visualized using Cytoscape. 20 The MCODE plugin for Cytoscape was used to obtain a subnetwork module with a degree cutoff of 5, node score cutoff of 0.2, and a K-core value of 2.
Mass Spectrometry (MS) Data Processing
The AB SCIEX 5600 Plus mass spectrometer was used to analyze the 6 brain samples. The identification of peptides and proteins from MS/MS data was conducted using ProteinPilot version 4.5 software. An unused score of ≥1.3 (confidence level >95%) and proteins that contained at least one unique peptide were regarded as credible proteins; quantitative results with a confidence level <95% were filtered out. Control samples were marked with numbers 115, 116, and 121, whereas GBM samples were marked with numbers 117-119.
For the experimental design with biological and technical repetition, the mean values of pairwise comparison results were normalized and regarded as the fold-change of samples. Subsequently, the minimum P value of a Student’s t-test for pairwise comparison results was regarded as a significant difference between samples. Lastly, significantly differentially expressed proteins were screened according to fold-change and P values. Proteins with a fold-change of ≥1.5 (upregulated, ≥1.5 and downregulated, ≤0.67) and a P value of ≤0.05 were considered significantly differentially expressed.
Transcriptomic and Proteomic Association Analyses
Association analyses for DEGs and differentially expressed proteins were performed, and the consistency between transcriptome and proteome levels was observed. The GO biological process for coexpressed genes and proteins was analyzed using the Clue GO plugin 21 for Cytoscape with a P value of <0.05 and a maximum level of <3.
Validation Using TCGA Database
The GBM RNASeq version 2 data downloaded from TCGA database was used to screen the expression of genes associated with the transcriptome and proteome. The read count of every gene was downloaded and DEGs for GBMs between controls were identified using the edge R package. |log2FC| >1 and false discovery rate <0.05 were regarded as cutoff criteria and the difference in the expression of DEGs in the transcriptome and proteome was observed.
Survival and Prognostic Analyses
The effects of DEGs on patient prognosis were assessed according to GBM survival data provided by TCGA database. First, one-way analysis of variance (ANOVA) was conducted for each gene to obtain potential prognostic genes. Subsequently, multivariate ANOVA was conducted for all potential prognostic genes; Akaike information criteria were introduced to optimize included variables. Lastly, multivariate ANOVA was conducted for optimized variables to further select for prognostic genes. The optimized prognostic genes were classified into 2 groups based on their expression level in patients and a Kaplan-Meier curve was constructed to compare survival between the high and low expression groups.
Experimental Verification
Three GBM samples and 3 control (paracancerous) samples were used for detection. Based on our previous studies, we measured the expression of Fibronectin 1(FN1). The primers for FN1 were as follows: FN1-hF, 5′-CGGTGGCTGTCAGTCAAAG-3′; FN1-hR, 5′-AAACCTCGGCTTCCTCCATAA-3′; human-GAPDHF, 5′-AGAAGGCTGGGGCTCATTTG-3′; human-GAPDHR, 5′-AGGGGCCATCCACAGTCTTC-3′.
The total RNA was extracted from samples using RNAiso Plus (Trizol) (TaKaRa#9109) according to the instructions. The reverse transcription reaction mixture was prepared as follows: 4-µL 5x primeScript RT Master MIX (perfect Real Time, TAKARA#RR036A) and 0.5µg Total RNA were mixed, and RNase free water was added up to 20 μL. The reaction conditions were 37°C for 60 min and then 85°C for 5 s. Then, the qPCR reaction solution was prepared with the following components: 10 μL SYBR Premix EX Taq (2x, Thermo#4367659), 1 μL forward primer 10μM, 1 μL reverse primer 10 μM, and 8 μL cDNA. The qPCR reaction was performed using the following steps: 50°C for 3 min, 40 cycles of 95°C for 3 min, 95 for 10 s, and 60°C for 30 s. Finally, melt curve analysis was carried out in 60°C-95°C, using increments of 0.5°C per 10 s.
All results are presented as the mean ± SEM and presented in tables. SPSS version 22.0 software (IBM Corp., Armonk, NY, USA) was used for the statistical analyses, and GraphPad Prism 5 (GraphPad Software, San Diego, CA, USA) was used for mapping. P < 0.05 and P < 0.01 were considered significant and extremely significant differences, respectively.
Results
Analyses of DEGs
Compared with control samples, 1140 DEGs (332 upregulated and 808 downregulated) were identified in GBM samples, 102 of which were lncRNAs (17 upregulated and 85 downregulated). The heatmaps for DEGs and differentially expressed lncRNAs are shown in Figure 1.
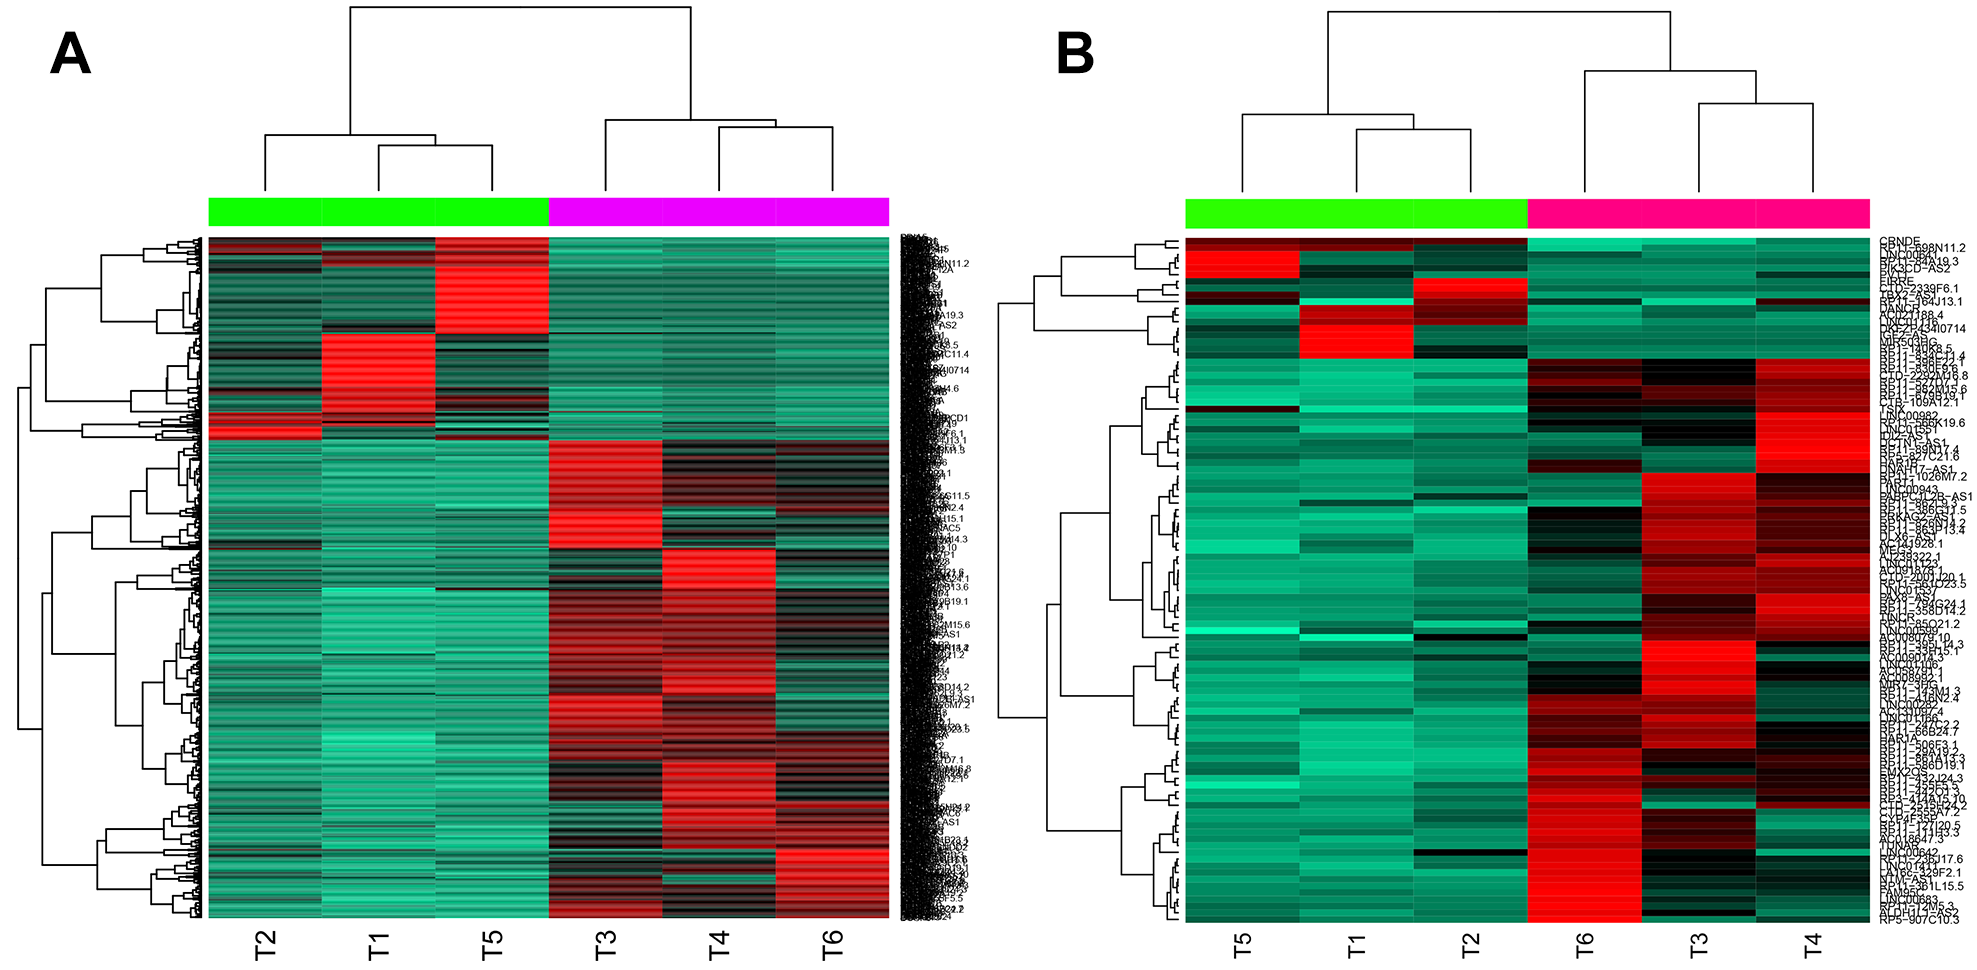
Heatmaps for differentially expressed genes (DEGs) (A) and differentially expressed long noncoding RNAs (lncRNAs) (B).
Functional Enrichment Analysis
As shown in Figure 2, upregulated DEGs (e.g., FN1) were mainly enriched in ECM–receptor interaction pathways, the cell cycle, and PI3K–Akt signaling. Downregulated DEGs were mainly enriched in glutamatergic synapses, calcium signaling, and neuroactive ligand–receptor interactions.

Functional enrichment analysis of upregulated (A) and downregulated (B) differentially expressed genes (DEGs).
PPI Network Analysis
In total, 4323 edges and 773 nodes (231 upregulated and 542 downregulated) were included in the PPI network. The top 10 degrees of nodes in the PPI network included tumor protein 53 (degree = 56), cyclin dependent kinase 1 (degree = 53), vascular endothelial growth factor A (degree = 49), cyclin B1 (degree = 46), kinesin family member 11 (degree = 44), baculoviral IAP repeat containing 5 (degree = 44), cell division cycle 20 (degree = 42), polo-like kinase 1 (degree = 41), MYC proto-oncogene (degree = 41), cyclin dependent kinase 2 (degree = 41), and aurora kinase A (degree = 41).
Network Module Analysis
In total, 14 network modules were obtained from the PPI network. The top 4 modules are displayed graphically in Figure 3A. KEGG pathway enrichment analyzes showed that Module 1 was significantly enriched in the cell cycle, oocyte meiosis, and neuroactive ligand–receptor interactions; Modules 2 and 3 were significantly enriched in neuroactive ligand–receptor interactions; and Module 4 was significantly enriched in protein digestion and absorption, ECM–receptor interaction pathways, and focal adhesion (Figure 3B).

Network module analysis results of the top 4 modules (A), and their Kyoto Encyclopedia of Genes and Genomes (KEGG) pathway enrichment analyzes (B).
WGCNA
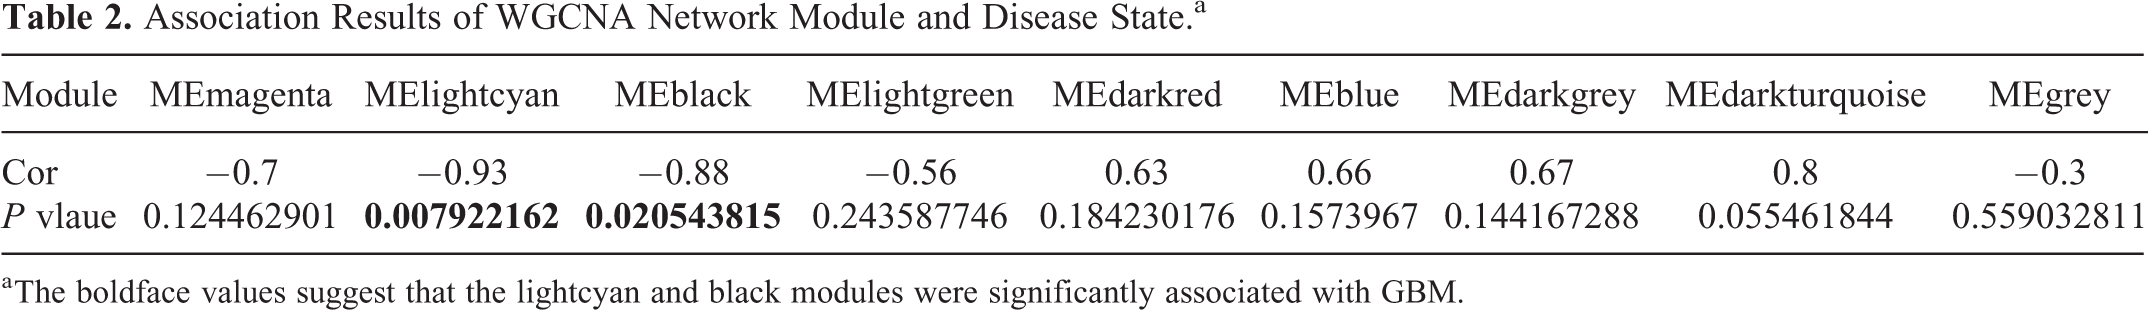
The DEGs were divided into WGCNA modules, and each module was set to contain at least 10 genes. All differentially expressed genes were divided into 11 modules, and the correlation between the modules and tumor was obtained by single factor ANOVA analysis. The results regarding the association between every module and disease suggested that the lightcyan and black modules were significantly associated with GBM (Table 2). There were 560 genes, including 49 lncRNAs, in the lightcyan module, and 162 genes, including 13 lncRNAs, in the black module. KEGG pathway enrichment analyzes for genes excluding lncRNAs indicated that the black module was significantly enriched in long-term potentiation, whereas the lightcyan module was significantly enriched in neuroactive ligand–receptor interactions and glutamatergic synapses (Table 3). The network for the top 50 genes in modules is presented in Figure 4.
Association Results of WGCNA Network Module and Disease State.a
a The boldface values suggest that the lightcyan and black modules were significantly associated with GBM.
Enrichment Results of KEGG Metabolic Pathways of the 2 Modules.

The network for the top 50 genes in modules. (A) Lightcyan; (B) black; deep color nodes: downregulated.
MS Proteomic Analysis
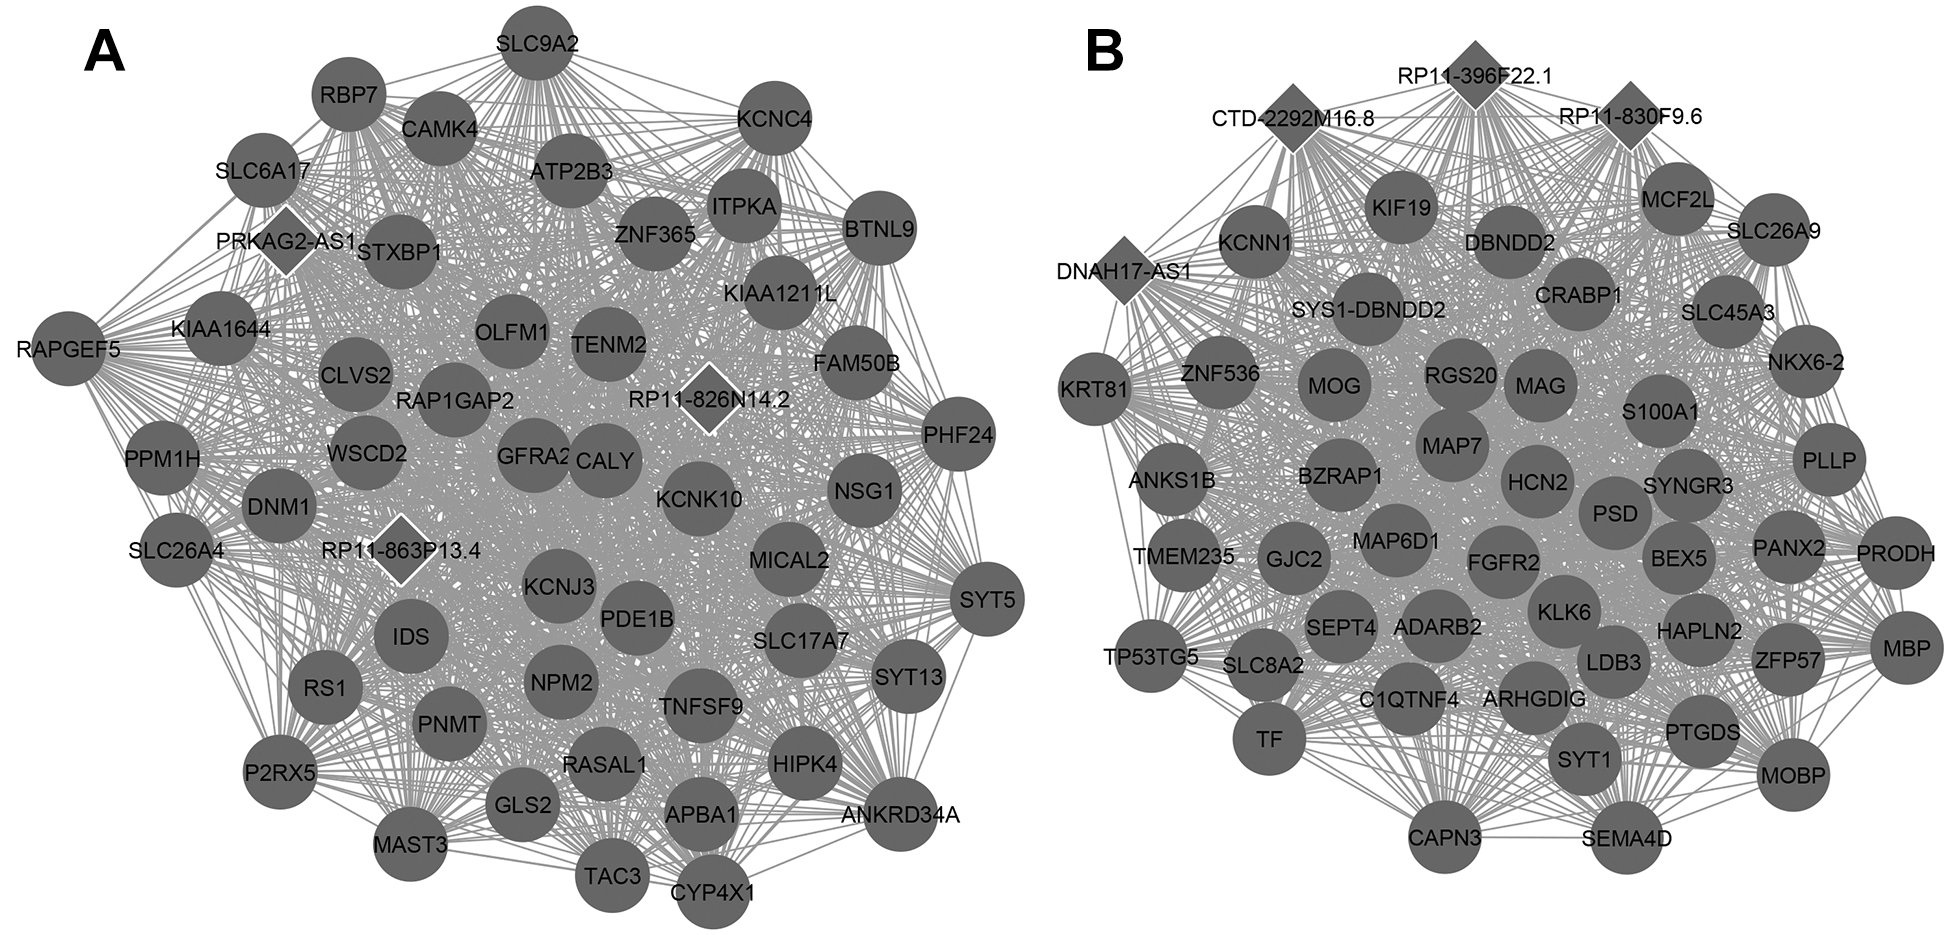
Compared with control samples, 503 DEPs (262 upregulated and 241 downregulated) were obtained from GBM samples. GO and KEGG pathway results for these proteins are presented in Figure 5.
The top 5 gene ontology (GO) (A) and Kyoto Encyclopedia of Genes and Genomes (KEGG) (B) pathways for differentially expressed proteins.
Transcriptomic and Proteomic Association Analyses
For the 503 differentially expressed proteins, the expression values of 495 genes (corresponding to 481 proteins) were detected at the transcriptome level. Of them, 89 genes were also differentially expressed at the proteome level. Furthermore, 25 genes were upregulated and 62 were downregulated at both the transcriptome and proteome levels (Figure 6A). In addition, 2 genes were downregulated at the transcriptome level and upregulated at the proteome level. The 62 coexpressed genes were mainly enriched in the regulation of synaptic vesicle exocytosis, neural nucleus development, and the regulation of neurotransmitter levels (Figure 6B).

Association analysis of proteome and transcriptome (A) and clueGO enrichment results of co-down-regulated genes/proteins (B).
Validation Using TCGA Database
The results showed that the TCGA database lacked expression information on immunoglobulin heavy chain constant γ and immunoglobulin κ constant, the difference observed for aldehyde dehydrogenase 1 family member A1 was not significant, and the other 84 genes matched with transcriptome sequencing results.
Survival and Prognostic Analysis
A univariate Cox regression analysis was conducted for GBM samples using the 84 genes that were validated by TCGA database, and the P value of prognostic risk for every gene was obtained. The following 8 prognostic risk factors were identified: heparin sulfate proteoglycan 2 (P = 0.007), protein disulfide isomerase family A member 4 (PDIA4) (P = 0.007), annexin A2 (P = 0.011), laminin subunit γ 1 (P = 0.012), FN1 (P = 0.014), reticulon-1 (P = 0.021), chitinase 3-like 1 (CHI3L1) (P = 0.040), and ANXA1 (P = 0.049). A multivariate Cox regression analysis was conducted for the 8 prognostic risk factors. After optimization, 3 genes (CHI3L1, FN1, and PDIA4) were included. Finally, FN1 was found to be a prognostic risk factor for GBM (Table 4). We grouped FN1 based on gene expression values to construct a KM survival curve between patients in high and low expression groups. The logrank test found that there was a significant difference in survival between the high and low expression groups (Figure 7).
Multivariate Cox Regression Analysis for CHI3L1, FN1, and PDIA4.a

a Likelihood ratio test = 14.9 on 3 df, P = 0.00187.

Kaplan-Meier curve analysis between high and low expression groups of FN1.
Experimental Verification
As shown in Figure 8, the expression of FN1 in GBM samples was significantly higher than that of the control samples (P < 0.01).
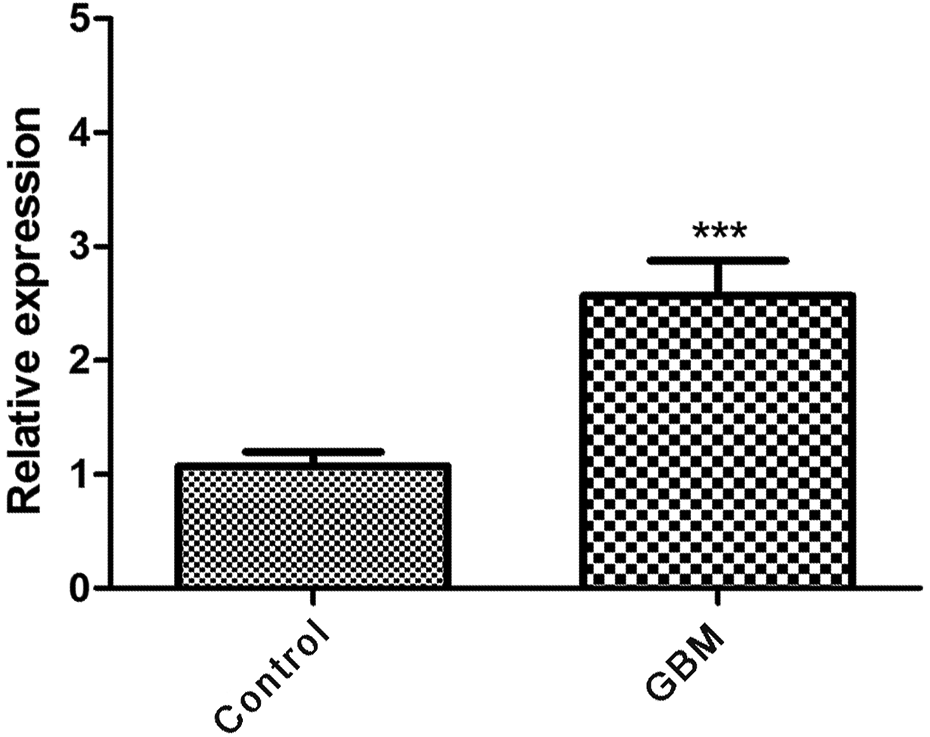
The expression of FN1 in glioblastoma multiforme (GBM) samples compared with control samples (“***” represents P < 0.01).
Discussion
In the present study, both DEGs and differentially expressed proteins in human GBM were identified. Upregulated DEGs were mainly enriched in ECM–receptor interaction and PI3K–Akt signaling pathways, whereas downregulated DEGs were mainly enriched in glutamatergic synapses, calcium signaling, and neuroactive ligand–receptor interactions. In total, 25 genes were upregulated and 62 were downregulated at both the transcriptome and proteome levels. The results of TCGA database searching showed that 84 of these 87 genes matched transcriptome sequencing results, and the Cox regression analysis suggested that FN1 was a prognostic risk factor for GBM. Furthermore, experimental verification showed a significantly higher expression of FN1 in GBM samples compared with control samples.
FN1, a high-molecular weight glycoprotein of the extracellular matrix, plays an important role in embryonic development and wound healing. 22 Altered expression, organization, and degradation of FN1 have been related to the pathologies of fibrosis and cancer. 23 FN1 is also involved in glioma cell motility, cohesion, and tumor angiogenesis. 24 Furthermore, this protein plays an important role in the maintenance of integrin b1 fibronectin receptors in glioma cells. 25 Volyanskyy et al have shown that FN1 is highly upregulated in GBM. 26 Han et al have shown that FN1 was associated with Tax-interacting protein 1-regulated angiogenesis in human GBM. 27 Considering these findings together with the results of the present study, it is very likely that FN1 plays a significant role in GBM development and is an important prognostic risk factor.
Furthermore, the present study showed that upregulated DEGs were mainly enriched in ECM–receptor interaction and PI3K–Akt signaling pathways. The ECM–receptor interaction pathway is involved in important features of malignant gliomas 28 and its downregulation has been related to temozolomide-resistant phenotypes. 29 Hu et al identified 6 KEGG pathways related to the progression of glioma, among which the ECM–receptor interaction pathway plays an important role in the occurrence and development of GBM. 30 Some studies have also reported the role of ECM pathway in the development of other cancers, such as kidney cancer and oral squamous cell carcinoma. 31,32 On the other hand, PI3K–Akt signaling has also been shown to be involved in malignant transformation, growth, proliferation, and metastasis of ovarian cancer. 33 Li et al have indicated that PI3K–Akt signaling plays an important role in glioma development, but therapeutic targeting of this pathway did not provide satisfactory results. 34 In contrast, other studies have shown that the PI3K–Akt signaling pathway is a therapeutic target for estrogen receptor-positive breast, ovarian, and non-small-cell lung cancers. 35,36 Therefore, both ECM–receptor interaction and PI3K–Akt signaling pathways are involved in GBM development. Furthermore, results from the current study showed that FN1 was mainly enriched in the ECM–receptor interaction and PI3K–Akt signaling pathways. Considering all the above, we infer that FN1 plays an important role in GBM development via the ECM–receptor interaction and PI3K–Akt signaling pathways.
The results of the present study suggest that FN1 is a significant prognostic risk factor for GBM and may play a role in GBM development and progression through the ECM–receptor interaction and PI3K–Akt signaling pathways. Furthermore, FN1 may be considered as a therapeutic target for GBM in future clinical trials. However, the sample size of this study was small; further studies with larger sample sizes are needed.
Footnotes
Abbreviations
Authors’ Note
Jiabin Wang and Hong Shen conceived, designed and performed the experiments. Shi Yan and Xiaoli Chen analyzed and interpreted the data. Aowen Wang, Zhibin Han and Binchao Liu contributed methods, materials, analysis tools or data. Jiabin Wang wrote the paper. All authors read and approved the final manuscript. All the procedures in our study were approved by the institutional ethics committee of The First Affiliated Hospital of Harbin Medical University and the methods were carried out in accordance with the approved guidelines. All the patients have been informed and signed informed consent before the experiments. Consent for publication was obtained from the participants. “Our study was approved by The First Affiliated Hospital of Harbin Medical University Ethics Committee (approval no. 2020IIT067). All patients provided written informed consent prior to enrollment in the study.”
Declaration of Conflicting Interests
The author(s) declared no potential conflicts of interest with respect to the research, authorship, and/or publication of this article.
Funding
The author(s) disclosed receipt of the following financial support for the research, authorship, and/or publication of this article: The effect and mechanism of interactions between connexin 43 and neuronic autophagy in epileptogenesis. (Project No. LH2019H082).