
Abstract
Intratumor heterogeneity is partly responsible for the poor prognosis of glioblastoma (GBM) patients. In this study, we aimed to assess the effect of different heterogeneous subregions of GBM on overall survival (OS) stratification. A total of 105 GBM patients were retrospectively enrolled and divided into long-term and short-term OS groups. Four MRI sequences, including contrast-enhanced T1-weighted imaging (T1C), T1, T2, and FLAIR, were collected for each patient. Then, 4 heterogeneous subregions, i.e. the region of entire abnormality (rEA), the regions of contrast-enhanced tumor (rCET), necrosis (rNec) and edema/non-contrast-enhanced tumor (rE/nCET), were manually drawn from the 4 MRI sequences. For each subregion, 50 radiomics features were extracted. The stratification performance of 4 heterogeneous subregions, as well as the performances of 4 MRI sequences, was evaluated both alone and in combination. Our results showed that rEA was superior in stratifying long-and short-term OS. For the 4 MRI sequences used in this study, the FLAIR sequence demonstrated the best performance of survival stratification based on the manual delineation of heterogeneous subregions. Our results suggest that heterogeneous subregions of GBMs contain different prognostic information, which should be considered when investigating survival stratification in patients with GBM.
Introduction
Glioblastoma multiforme (GBM) is the most damaging tumor of the brain, making characterized by an almost unavoidable propensity to relapse after rigorous treatment and carrying a fatal prognosis. 1,2 Despite advancement in surgical and medical therapies, the overall prognosis of GBM patients remains poor, with a median survival of 10-14 months. 3 The past years have seen remarkable advances in GBM research, but this progress has failed to yield significant improvements in prognosis. While the 1-year survival rate is 50.6%, 4 the 5-year survival rate is only 9.8%. 5 Recent studies have indicated that intratumor heterogeneity is partly responsible for the dismal outcome of GBM patients. 6 Assessing the effect of heterogeneity on survival stratification is therefore critical for appropriate GBM clinical management.
Currently, magnetic resonance imaging (MRI) has served as a noninvasive tool for the survival analysis of GBMs. 7,8 An increasing number of radiomics studies aim to predict disease prognosis, thereby providing beneficial information for personalized treatment from a variety of imaging features extracted from multiple MRI. 9 Two researches utilized MRI features and corresponding criteria of the VASARI (Visually Accessable REMBRANDT [Repository for Molecular Brain Neoplasia Data] Images) and showed that such features improve the prediction of survival in GBM patients over clinical features alone. 10,11 Another recent study also demonstrated that the incorporation of diffusion- and perfusion-weighted MRI into an MRI radiomics model to allow for better prognostication in newly diagnosed glioblastoma patients improved its performance over that achievable using clinical predictors alone. 12 We assessed GBM heterogeneity with MRI textures, which indicated that local heterogeneity might play an important role in the survival stratification, while global heterogeneity had little effect. 13 It further suggested that the tumor regions with high gray-levels or intensity in postcontrast T1-weighted imaging (T1WI) might contribute more to the prognosis of patients with GBM, and we could improve the prediction performance by dividing the active tumor into several subregions in space. 14 Intratumor heterogeneity occurs at the molecular level and can be macroscopically reflected by different phenotypes in MRI, 15 which are commonly identified as the region of contrast-enhancing tumor (rCET), necrosis (rNec) and edema/non contrast-enhancing tumor (rE/nCET). Moreover, with the help of multi-parametric MRI, the tumor region can specifically be identified as active tumor and necrosis using T1WI images and edema by fluid attenuation inversion recovery (FLAIR) sequences. 16 However, investigations into the effect of GBM heterogeneity on survival stratification have reported contradictory results regarding the influence of different heterogeneous subregions on the overall survival (OS) of GBM patients. One study observed that the texture in active tumor (vAT) phenotype may predict the OS of GBM patients. 17 Another study asserted that nonenhanced regions of GBM can be used to identify patients with poor survival trends. 18 Which subregion is the most effective and whether their combinations can improve the predictive performance, which modality or their combination could benefit the prediction, are still unknown. Therefore, it is necessary to establish a novel approach evaluating the influence of different subregions of GBM.
In this study, we aimed to employ high-throughput radiomics features, which were extracted from different GBM subregions of multimodal MRI, to discriminate long- and short-term OS groups and to evaluate the performance of each subregion or subregions combination for the OS stratification. With full utilization of the heterogenous information contained in different subregions of GBMs, the proposed approach could achieve a promising survival stratification performance.
Material and Methods
Patient Selection
In this study, all the GBM patients were collected from the Cancer Genome Atlas (TCGA, https://wiki.cancerimagingarchive.net/display/Public/TCGA-GBM), and the corresponding MRI data from the Cancer Imaging Archive (TCIA) were retrospectively included. 19 A database consisting of 262 patients were included in this study basing on the following criteria: (1) the patient previously underwent 4 MRI sequences including contrast-enhanced T1-weighted imaging (T1C), T1, T2, and FLAIR sequences, (2) the patient had entire follow-up information, and (3) MRI scans were performed before any treatments or interventions, and these patients were subsequently diagnosed as GBM based on the histological examination. Among them, 157 patients were excluded based on the following criteria: (1) patients who lacked certain MRI modalities (n = 107), (2) patients with poor image quality, making the segmentation of GBM regions difficult and texture analysis inaccurate (n = 17), and (3) patients who underwent MRI exams after surgery or biopsy (n = 33). Finally, 105 patients were eligible in this study and were divided into 2 groups based on their OS, i.e. long-term survival (OS ≥ 12 months, n = 57) and short-term survival (OS < 12 months, n = 48). In this study, OS was calculated from the initial pathologic diagnosis date to death or censored point if still alive. The summary of patient characteristics of long-term and short-term groups was listed in Table 1. Because all the patient data in TCGA were deidentified, an institutional review board approval was waived.
Summary of Patient Characteristics of Long-Term and Short-Term Groups.
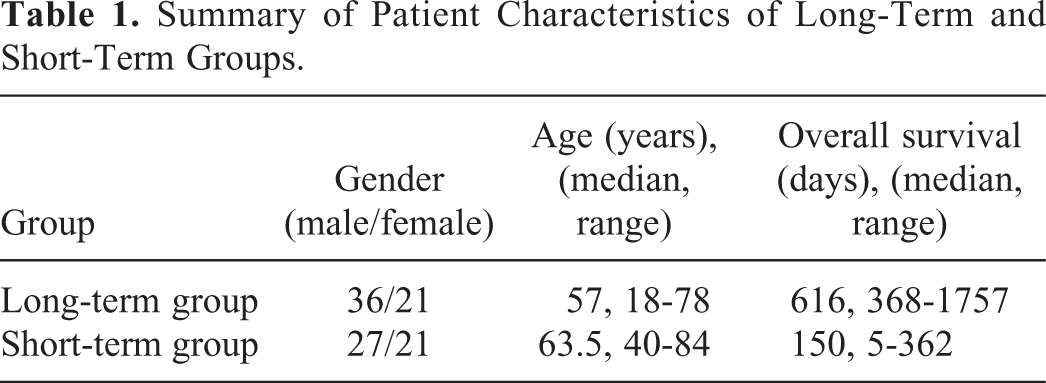
Image Data Acquisition and Preprocessing
Preoperative MRI data were collected from the archived database. The manufacturer of the scanner included GE, Siemens, and Philip with the magnetic field intensity ranged from 1.0 T, 1.5 T, and 3.0 T. The number of patients scanned by using MRI scanners from different manufacturers and magnetic field intensity has been summarized in Table 2.
Summary of the Number of Patients Scanned by Using MRI Scanners From Different Manufacturers and Magnetic Field Intensity.

Four MRI sequences were performed for each patient, including T1C, T1, T2, and FLAIR. The T1C sequence was acquired with the following parameters: repetition time (TR)/echo time (TE), 4.9-3285 msec/2.1-20 msec; slice thickness, 1-5 mm; spacing slice, 0.6-7.5 mm. The major parameters for T1 imaging sequence included TR/TE, 352-3379 msec/2.75-19 msec; slice thickness, 1-5 mm; spacing slice, 2-7.5 mm. The primary parameters for T2 imaging sequence included TR/TE, 700-6370 msec/15-120 msec; slice thickness, 1.5-5 mm; spacing slice, 1.5-7.5 mm. And the predominant imaging parameters for the FLAIR sequence involved TR/TE, 6000-11000 msec/34.6-155 msec; slice thickness, 2.5-5 mm; spacing slice, 2-7.5 mm. The matrix size of all the MRI sequences was either 256 × 256 or 512 × 512. In the process of image acquisition, diverse parameters of different MRI sequences were used, which may have a great influence on 3-dimensional (3D) analyses. Therefore, 2-dimensional (2D) preprocessing was performed in this study. 20
Heterogenous Subregions Delineation
Considering the diverse parameters of these MRI sequences, image registration was performed using the rigid transformation and mutual information. This process was conducted by using the function of “imregister” derived from Matlab 2015. Then, the axial slice of each imaging sequence was determined based on obtaining the largest area of the GBM lesion for each patient. After that, all the images were normalized using an in-house Collewet et al algorithm developed by Matlab 2015. 21 To extract high throughput features, both original MRI images and corresponding filtered images after wavelet transform were obtained. Then, 4 2D heterogenous subregions were manually drawn, including (1) the 2D region of entire abnormality (rEA) outlined on FLAIR image, (2) rCET and (3) rNec on T1C, and (4) rE/nCET acquired by subtracting the union of rCET and rNec from rEA, as shown in Figure 1. In this study, all manual contours were created by 2 neuroradiologists with 12 and 8 years of MRI interpretation experience. They were blinded to the clinical information about patients and worked together on outlined contours of each patient for consensus reading, especially on those with discrepancies.
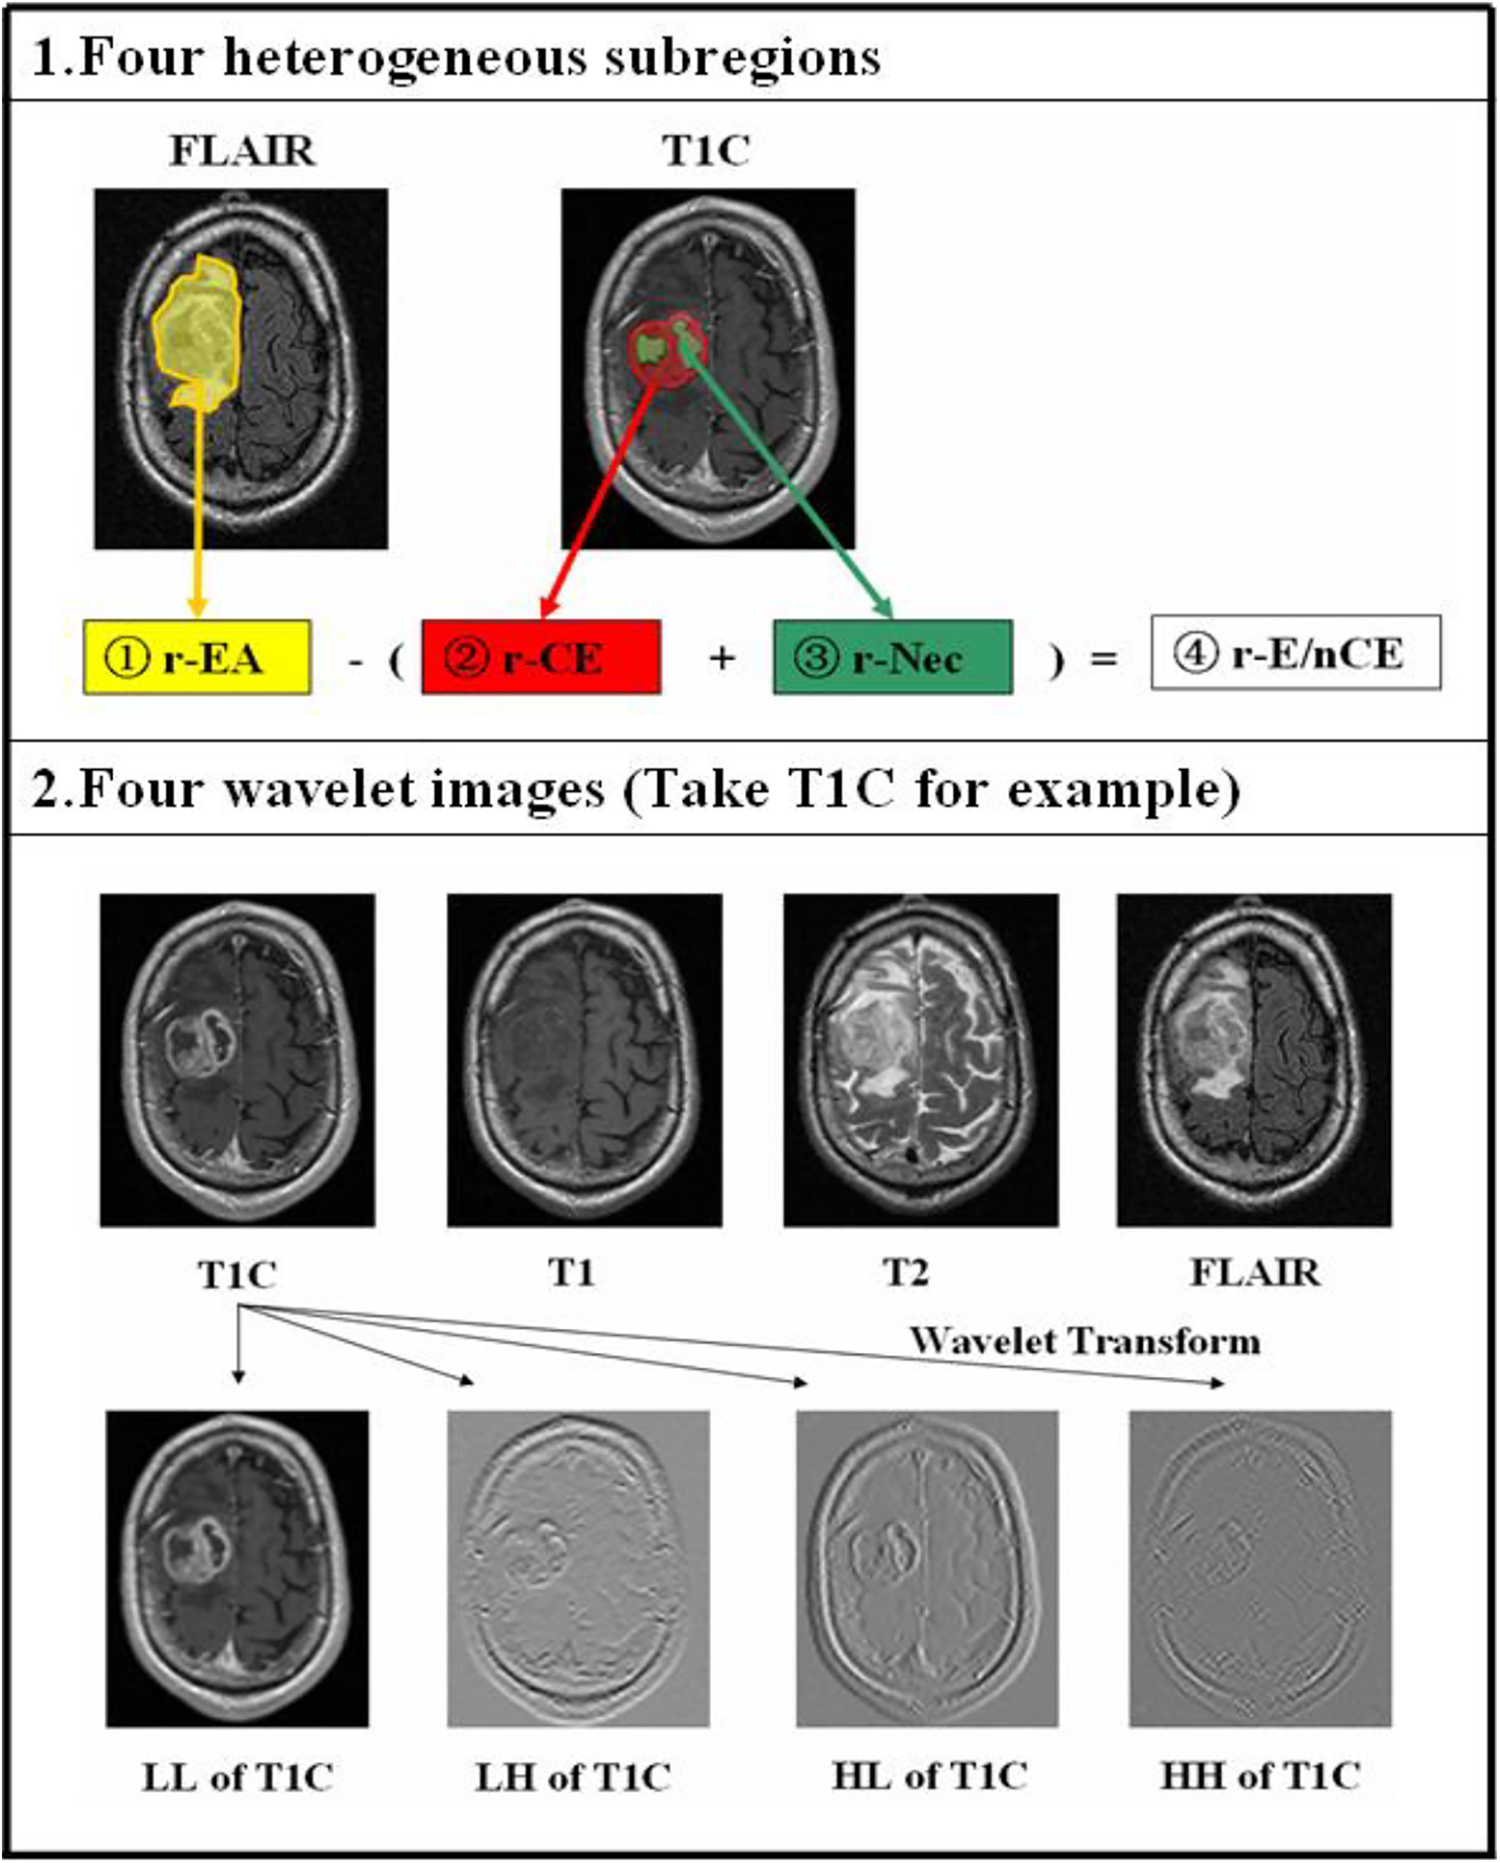
The generation of 4 heterogenous subregions of GBM patients and the wavelet transform process of each MRI modality. 1, Four heterogenous subregions were manually drawn. 2, The original T1C, T1, T2, and FLAIR images were decomposed into 4 new images in 4 decomposed directions (LL, LH, HL, HH) by wavelet transform, respectively. L and H represent low-pass and high-pass functions, respectively.
By changing the ratio of the high-frequency to low-frequency signals in the images, the wavelet transform increases the information from the low-frequency signal. L and H are a low-pass and high-pass function, respectively, I is the original image, and the wavelet decompositions of I in 2 directions (x, y) are labeled ILL, ILH, IHL, and IHH. Then, we can obtain 4 new filtered images. The size of each filtered image is equal to that of the original image and is shift-invariant. Therefore, 5 images were acquired from each MRI sequence.
Radiomics Feature Extraction
Textural features are visual characteristics that reflect the homogeneous appearance of images and the arrangement of the properties that change slowly or periodically on the body surface. Textural features used in this study mainly included histogram features and those derived from gray-level co-occurrence matrix (GLCM), gray-level run-length texture matrix (GLRLM), and gray-level size-zone matrix (GLSZM). 22,23 The detailed definition of these features has been published in our previous articles. 24,25 The extraction process was performed using a publicly shared package online available. 24,26 In this study, 13 GLCM features, 13 GLRLM features, and 13 GLSZM features were extracted from the corresponding matrices. Each feature was calculated with the average of the values generated from 4 directions (0°, 45°, 90°, and 135°) and the pixel distance set as 1. Prior to the above 3 categories of feature extraction, the grayscale of each ROI was normalized empirically to 16, to obtain more distinguishable features, according to the results of our previous studies. 27,28 A total of 11 histogram-based features were applied to describe the distribution of voxel intensities within the image, which have been listed in supplemental material. As a result, a total of 4000 candidate radiomics features were generated for each subject (50 radiomics features × 4 subregions × 5 images × 4 MRI sequences). The feature extraction package was implemented using MATLAB 2015b (MathWorks, Natick, MA, USA).
Feature Selection and Classification
To assess the performance of each subregion and MRI sequence when investigating the survival stratification of GBM, the nonlinear support vector machine-based recursive feature elimination (SVM-RFE) method was firstly performed on these 50 features set of single subregion or subregion combination to select and optimal feature subset. Please refer to previous study 27 for the detailed mechanism of SVM-RFE. On the basis of the analysis of each subregion, the optimal feature subsets of the 4 subregions were combined and further selected by the SVM-RFE method. Then, based on the optimal feature subset selected from different heterogenous subregion, we can build a model to predict the survival stratifications of the GBM patients. After each classification, the quantitative indices, namely the sensitivity, specificity, accuracy, and area under the curve (AUC) of the receiver operating characteristics (ROC), were calculated to evaluate the classification performance. Furthermore, we evaluated the performances of 4 MRI sequences when investigating the effect of GBM heterogeneity on survival stratification by heterogenous subregions delineation.
Statistical Analysis
Statistical analyses were performed using SPSS software v. 22.0.00 (IBM Corp., New York, NY). The Mann-Whitney U test and chi-square test were applied to clinical characteristics to verify whether significant intergroup differences existed. Two-sided P values < 0.05 were described as statistically significant.
Results
Classification Performance With Four Heterogenous Subregions
The performance of OS stratification using optimal radiomics features from a single subregion or combination of subregions in GBM patients with long- and short-term survival times is compared in Table 3. In addition to the months of OS (P < 0.01), there were no significant intragroup differences of clinical characteristics. By comparing the efficiency of single subregion, the role of rEA was more outstanding for stratifying long- and short-term OS, with AUC = 0.9254, which was shown in Figure 2. The next one was the rE/nCET, with AUC = 0.9083. By comparing the efficiency of subregion combination, the 4-region combination (rEA, rCET, rNec and rE/nCET) combination with AUC = 0.9591 and accuracy = 91.43%, outperformed the 3-subregion (rCET, rNec and rE/nCET) combination with AUC = 0.9342 and accuracy = 89.52%.

The efficiency of OS stratification using optimal radiomics features from single subregion or subregion combination. By comparing the efficiency of single subregion, the role of rEA was more outstanding for stratifying long- and short-term OS, with AUC = 0.9254. The next one was the rE/nCET, with AUC = 0.9083. By comparing the efficiency of subregion combination, the 4-subregion combination (AUC = 0.9591 and accuracy = 91.43%) outperformed the 3-subregion combination (AUC = 0.9342 and accuracy = 89.52%). The group of all means 4-subregion combination, which contains rEA, rCET, rNec and rE/nCET.
The Performance of Single Subregion or Subregion Combination With the SVM Classifier in Differentiating Long- and Short-Term Survival Time.

Abbreviations: rCET, regions of contrast-enhancing tumor; rNec, regions of necrosis; rE, regions of edema; nCET, non-contrast-enhancing tumor; rEA, the region of entire abnormality.
Classification Performance With Single MRI Modality
Furthermore, we assess the performance of each sequence (T1C, T1, T2, and FLAIR) when investigating the effect of GBM heterogeneity on survival stratification by heterogenous subregions delineation. In our previous study, we have found that the tumor regions with high gray-levels or intensity in postcontrast T1 might contribute more to the prognosis of patients with GBM. 14 But in this study, when 4 heterogenous subregions were manually drawn, the performance of FLAIR sequence was the best, with AUC = 0.9101 and accuracy = 86.67%, and followed by that of T2 sequence, AUC = 0.8637 with and accuracy = 82.86%, as showed in Figure 3. The performance of each MRI sequence was also compared in Table 4.

The efficiency of OS stratification using optimal radiomics features from single MRI modality. The best accuracy and AUC were got when using FLAIR images (AUC = 0.9101 and accuracy = 86.67%).
The Optimal Classification Performance of Different Sequence Using the SVM Classifier.

Discussion
GBMs are usually present with extensive areas of necrosis, pseudo-palisading, vasogenic edema and infiltrative microscopic disease. It is clear that, despite a lot of advancements made in the wide field of GBM molecular biology and the development of new therapies based on this knowledge, there is still a long way to go to fully understand this terrible disease. 29 MRI is the primary imaging modality for diagnosis and monitoring of GBM, and integration of advanced MRI features with conventional MRI, may provide valuable information for differentiating glioblastoma from solitary metastatic lesions. 30
More and more studies show that precise segmentation of active tumor region and perifocal edema extension from MRI is essential for planning stereotactic biopsy and GBM surgery. 31 The previous study had shown that 4 out of 7 of the examined imaging features were associated with survival. 32 These features were: tumor functional grade, necrosis grade, edema grade, and enhancement grade. 32 Some studies also provided more evidence for the usefulness of imaging features when predicting survival time. 33 -35 In our previous studies, the results indicated that further spatial segmentation of the active tumor into multiple subregions might improve survival stratification. 14
In this study, we proposed the preoperative MRI-based radiomics extracted from different subregions of GBM for survival stratification in patients. Results demonstrated that local and regional heterogeneity may play an important role in the survival stratification of patients with GBM. Meanwhile, different subregions in GBM multimodal MRI had different stratification efficiencies.
Considering the intratumor heterogeneity of GBMs, it is commonly critical to determine which regions/volumes to be extracted for further analysis. In most of previous GBM-related MRI studies, researchers usually focused on the rCET and investigated its potential to grading or survival prediction. Most GBM prognosis-related studies indicated the association between poor prognosis and radiomics features from contrast-enhanced region. 17, 36 However, in our experiments, the role of rEA was more outstanding for stratifying long- and short-term OS by comparing the efficiency of single subregion, and the next one was the rE/nCET. By comparing the efficiency of subregion combination, the group of all 4-subregion (rEA, rCET, rNec and rE/nCET) combination outperformed the 3-subregion (rCET, rNec and rE/nCET) combination.
Despite the superiority of rEA in OS stratification, each subregion contained specific microenvironment information that was fully represented by optimal radiomics features and could complement each other. Therefore, the OS stratification model of the 4-subregion combination achieved the best performance compared to any other subregion combination or single subregion. According to the performance of optimal features extracted from different MRI sequences, features from FLAIR images achieved more favorable predictive performance than those from the other sequences did for the OS stratification. These results further denote that important information in the non-contrast-enhanced subregions and MRI sequence can be used for improving the prognostic performance of GBM patients. 37
However, the results of this study should be carefully interpreted due to several limitations. First, the datasets enrolled in this retrospective study were relatively limited. In future, a larger sum of datasets is required to further validate the overall performance of the proposed strategy. Secondly, this study required annotation of 4 different tumor subregions in each slice of each case, which required an enormous amount of radiology work. considering the large section thickness and spacing of most data, we used 2D texture analysis instead of 3D analysis, which may have resulted in missing information. Thirdly, therapy information was missing among a proportion of these patients, thus was not fully considered in this study, which might be an important variation factor for OS estimation. Finally, the pixel distance was set as 1 in calculating the GLCM and GLRLM features. In future work, other pixel distance like 2 and 3 should be evaluated in feature calculation and performance estimation.
Conclusion
In this study, we used the integrated optimal features of heterogeneous subregions in multimodal MRI and machine learning models to evaluate the OS stratification efficiency of each subregion or subregion combination. Meanwhile, different subregions in GBM on multimodal MRI had different stratification efficiencies. rEA and the FLAIR sequence may play a more important role in the survival stratification of GBM patients by heterogeneous subregion delineation.
Supplemental Material
Supplemental Material, sj-pdf-1-tct-10.1177_15330338211033059 - The Effect of Heterogenous Subregions in Glioblastomas on Survival Stratification: A Radiomics Analysis Using the Multimodality MRI
Supplemental Material, sj-pdf-1-tct-10.1177_15330338211033059 for The Effect of Heterogenous Subregions in Glioblastomas on Survival Stratification: A Radiomics Analysis Using the Multimodality MRI by Lulu Yin, Yan Liu, Xi Zhang, Hongbing Lu and Yang Liu in Technology in Cancer Research & Treatment
Footnotes
Abbreviations
Authors’ Note
Lulu Yin and Yan Liu have contributed equally to this work, and they are co-first authors. Institutional Review Board approval was not required because all the data used in this study were selected from the Cancer Genome Atlas (TCIA). After ethical review by NIH, the TCIA is freely available for the scientific research. Followed by the instructions of TCIA, we have referred related articles about TCIA.
Declaration of Conflicting Interests
The author(s) declared no potential conflicts of interest with respect to the research, authorship, and/or publication of this article.
Funding
The author(s) received the financial support for the research, authorship, and/or publication of this article: The present study was financially supported by grants from the National Natural Science foundation of China [grant number 81871424, 81701658].
Supplemental Material
Supplemental material for this article is available online.
References
Supplementary Material
Please find the following supplemental material available below.
For Open Access articles published under a Creative Commons License, all supplemental material carries the same license as the article it is associated with.
For non-Open Access articles published, all supplemental material carries a non-exclusive license, and permission requests for re-use of supplemental material or any part of supplemental material shall be sent directly to the copyright owner as specified in the copyright notice associated with the article.