
Abstract
Purpose:
To analyze the influence of the bladder and rectum filling and the body contour changes on the prostate target dose.
Methods:
A total of 190 cone-beam CT (CBCT) image data sets from 16 patients with prostate cancer were used in this study. Dose reconstruction was performed on the virtual CT generated by the deformable planning CT. Then, the effects of the bladder filling, rectal filling, and the patient’s body contour changes of the PCTV1 (the prostate area, B1) and PCTV2 (the seminal vesicle area, B2) on the target dose were analyzed. Correlation analysis was performed for the ratio of bladder and rectal volume variation and the variation of the bladder and rectal dose.
Results:
The mean Dice coefficients of B1, B2, bladder, and rectum were 0.979, 0.975, 0.888 and 0.827, respectively, and the mean Hausdorff distances were 0.633, 1.505, 2.075, and 1.533, respectively. With the maximum volume variations of 142.04 ml for the bladder and 40.50 ml for the rectum, the changes of V100, V95, D2, and D98 were 1.739 ± 1.762 (%), 0.066 ± 0.169 (%), 0.562 ± 0.442 (%), and 0.496 ± 0.479 (%) in PCTV1 and 1.686 ± 1.051 (%), 0.240 ± 0.215 (%), 1.123 ± 0.925 (%), and 0.924 ± 0.662 (%) in PCTV2, respectively. With a 10% increase in the volume of the bladder and rectum, the V75, V70, and V65 of rectum increased at 0.73 (%), 0.71 (%), and 1.18 (%), and the V75, V70, and V65 of bladder changed at −0.21 (%), −0.32 (%), and −0.39 (%), respectively.
Conclusion:
Significant correlations were observed between the volume variation and the dose variation of the bladder and rectum. However, when a bladder and rectal filling protocol was adopted, the target dose coverage can be effectively ensured based on CBCT guidance to correct the prostate target position.
Introduction
Intensity-modulated radiation therapy (IMRT) or volumetric modulated arc therapy (VMAT) techniques allow for the delivery of high doses to the target with a steep dose gradient that falls off quickly beyond the prostate target. Considering that the prostate target position is susceptible to the filling of the bladder and rectum, 1 image-guided radiotherapy prior to treatment delivery has become a common practice to verify consistent and accurate anatomical positioning of the target and organs at risk (OARs). 2,3 However, Wong et al 4 reviewed 1870 CTs and found that 14% had prostate shifts of 3-5 mm, 29% had prostate shifts of 6-10 mm, and 13% had prostate shifts of >10 mm in anterior-posterior direction. Therefore, in the process of using IGRT to correct target position, the body surface contour may suffer severe change, which is a potential factor to induce the dose uncertainty of target in prostate cancer radiotherapy.
To ensure adequate dose coverage of the prostate target, many researchers use adaptive radiation therapy (ART) to further reduce the influence of peripheral anatomical changes on dose coverage. 5 However, when using ART, many problems need to be solved, such as time consumption; CBCT image quality; getting patients on and off the treatment table due to gas/bladder filling which leads to schedule discrepancies and delays on the machine; contouring accuracy; and extra workloads. Therefore, some reports tried to demonstrate that there was no significant deviation between the actual dose and the planned dose for the target when using IGRT to correct the target position, despite considerable variations in the target position and the bladder and rectum filling. 6,7 However, these studies mainly focused on the internal anatomical changes (e.g. bladder and rectal filling), while the external anatomical changes are also frequently observed in clinical scenarios for prostate cancer radiotherapy.
In the present study, we quantified the inter-fractional geometric indexes of bladder, rectum, and body surface contour and analyzed the dosimetric effects of the abovementioned anatomical changes on the target area and critical OARs, thereby providing some theoretical basis for the clinical application of image-guided prostate cancer radiotherapy. Inter-fractional delivered dose was reconstructed utilizing planning CT (pCT) to cone-beam computed tomography (CBCT) deformation. 8,9 To minimize the variation of dose reconstruction, the deformable vector field-based OARs were modified manually.
Materials and Methods
Patient Information
The study included 16 intermediate- to high-risk patients with prostate cancer who were treated by Edge accelerator (Varian Medical Systems, Palo Alto, CA, USA) in our hospital from October 2017 to March 2019. Because the status of the anatomical changes was similar for two consecutive fractions, the CBCT images were selected for every three fractions. As a result, 190 fractions with full-arc CBCT images were selected for analysis. Each patient signed an informed consent form before treatment. This study was approved by the Ethics Committee of West China School of Medicine, Sichuan University (No.20191128). All patients were immobilized with the thermoplastic mask from the upper chest to the upper limbs, and the VMAT plan was designed in the Eclipse planning system (Version 13.6, Varian Medical Systems Inc, Palo Alto, CA, USA). The prescription doses of the prostate area (PCTV1) and the seminal vesicle area (PCTV2) were 76 Gy/38 fractions and 60.8 Gy/38 fractions, respectively. The planned target volume (PTV) was uniformly expanded outside the clinical target volume (CTV) by 5 mm.
In the process of immobilization, CT simulation, and dose delivering, a bladder filling protocol was followed: after emptying the rectum and bladder, 500 ml water was drunk, and one hour later, the bladder volume was measured accurately by an ultrasound-based bladder volume measuring device (Padscan HD5, Caresono, Dandong, China). The planning CTs were obtained in Siemens SomATom Defination AS (Siemens Healthineers, Erlangen, Germany), and CBCTs were acquired in the Varian EDGE OBI system (Varian Medical Systems Inc, Palo Alto, CA, USA). The following parameters of CT and CBCT were used for imaging: CT: 120 kV, FOV of 500 mm, with a slice thickness of 3 mm; CBCT: 120 kV, FOV of 45 cm (diameter) ×16 cm (length), with a slice thickness of 2 mm.
Geometric Index Extraction
In IGRT processing, the CBCT image was automatically registered with planning CT first and then manual registration was performed to fine adjustment according to the CTV and rectum position. The relative position of the planning CT and CBCT was recorded in the Mosaiq system. Then, the CBCT images were transferred to the Eclipse planning system. The bladder, rectum, and body surface contour of the planning CT and CBCT were outlined manually, and their volume, Hausdorff distance, and Dice coefficient were calculated utilizing an open-source package in 3D slicer software (V4.10.2). The ratio of the bladder and rectal volume variation were defined as (Volumeactual - Volumeplanning) / Volumeplanning. The Hausdorff distance is defined as the maximum nearest neighbor Euclidean distance between the surfaces of the two contours in one slice, calculated from the auto-contour towards the user-adjusted contour, and averaged over all slices. The Dice coefficient is defined as two times the volume where the two contours overlap divided by the total volume of both contours combined. Considering that only part of the body surface contour variation would lead to the changes of the beam path, we outlined the surface contour of the PCTV1 (the prostate area, B1) and PCTV2 (the seminal vesicle area, B2), as shown in Figure 1. Additionally, the irradiation volumes were within the CBCT images for the selected patients
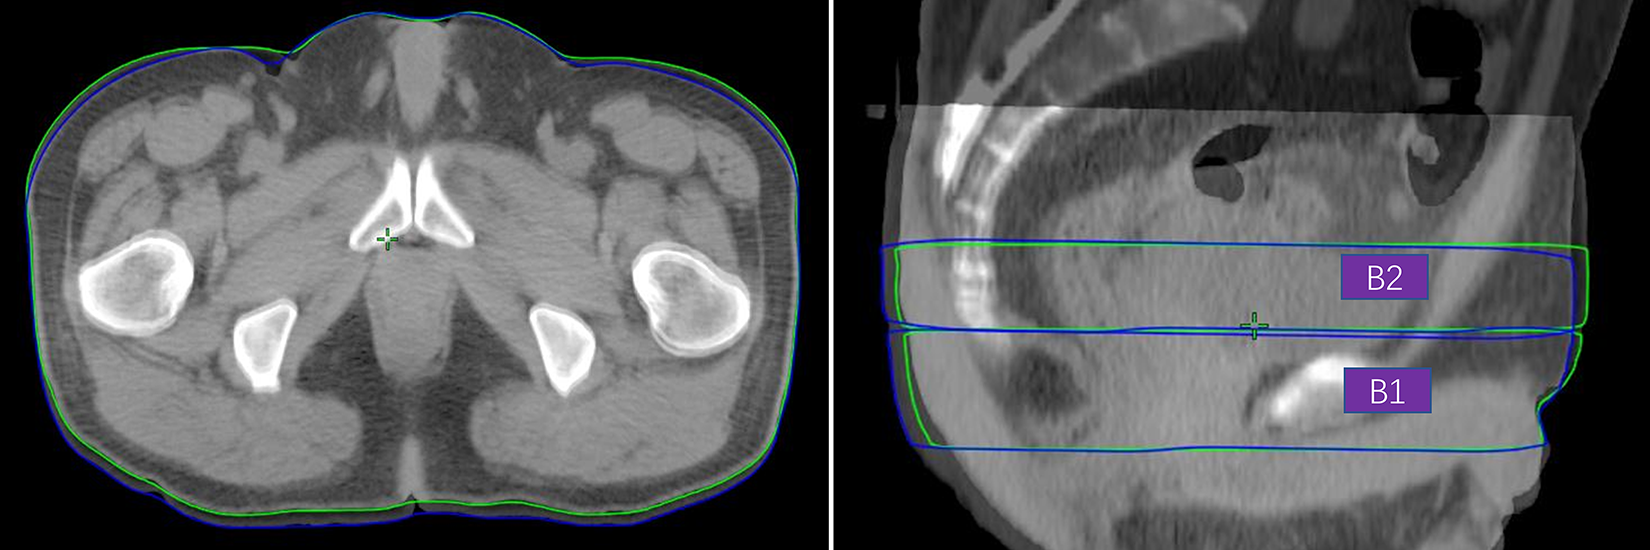
The example of the surface contour of PCTV1 (the prostate area) and PCTV2 (the seminal vesicle area). The green and blue line refer to the surface contour of planning CT and CBCT, respectively.
Dose Reconstruction
A reliable inter-fractional dose reconstruction process contains valid dose distribution and accurately delineated OARs. Direct CBCT-based dose calculation is inadequate due to incorrect HU values. Deformable image registration-based dose calculation has proven to be sufficient for inter-fractional dose reconstruction. 8,9 Therefore, virtual CT, generated from pCT-to-CBCT deformation in Velocity (v3.2.1, Varian Medical Systems, Palo Alto, CA), was used for dose calculation. The targets were rigidly mapped to the virtual CT, and the OARs were propagated based on deformable vector fields. To minimize the variation of dose reconstruction, the deformable vector field-based OARs were modified manually in Velocity, as shown in Figure 2. Then, the virtual CT and modified OARs were imported into the Eclipse planning system. Finally, the origin plan is applied to the virtual CT to calculate the delivered dose.

The example of the difference between the deformed OARs (red) and the manually modified one (cyan).
Data Analysis
The V100, V95, D2, and D98 of PCTV1 and PCTV2 were extracted to analyze the correlation with Dice coefficient and Hausdorff distance of B1, B2, bladder, and rectum. Correlation analysis between the volume variation and the variation of V75, V70, and V65 of the bladder and rectum were done. Statistical analysis was performed using SPSS (v20.0, IBM Corp, Chicago, IL), and P < 0.05 was regarded as statistically significant. Given the inter-fractional position errors can be corrected using CBCT image guidance, we use a 5-mm PTV margin to compensate the intra-fractional deformation and intra-fractional motion Therefore, to simulate the clinical situation, the PTVs were rigidly mapped to the virtual CT as our emphasis is the impact of peripheral anatomical changes on target dose.
Results
Changes of Patients’ Anatomy and The Resulting Changes of Dose Parameters
Figure 3 shows the boxplot of the Dice coefficient and Hausdorff distance for B1, B2, bladder, and rectum. The mean Dice coefficients of B1, B2, bladder, and rectum were 0.979, 0.975, 0.888, 0.827, respectively, and the mean Hausdorff distances were 0.633, 1.505, 2.075, and 1.533, respectively. The volume changes of bladder and rectum were 33.85±33.33 (ml) and 7.86±8.00 (ml) respectively. Moreover, the volume change factor of the bladder (bladder volume change value/ planning CT bladder volume) was 16% ± 17% and that of the rectum was 11% ± 8%.

The box plot of Dice coefficient and Hausdorff distance for B1 (the patient’s body contour changes of the prostate area), B2 (the patient’s body contour changes of the seminal vesicle area), bladder, and rectum.
Based on the data sets of the abovementioned inter-fraction anatomical variations, the changes of V100, V95, D2 and D98 in PCTV1 were 1.739±1.762 (%), 0.066±0.169 (%), 0.562±0.442 (%) and 0.496±0.479 (%), respectively, and those of PCTV2 were 1.686±1.051 (%), 0.240±0.215 (%), 1.123±0.925 (%) and 0.924±0.662 (%), respectively. Among them, V95, D2, and D98 of PCTV1 and PCTV2 were negligibly affected by the inter-fraction anatomical variations.
Analysis of the Correlation Between Anatomical Variations and the Variation of Target Dose Parameters
Table 1 shows the results of correlation analysis between the dose parameter variations of PCTV1 and the geometric factors of anatomical changes. Among them, PCTV1_D2 and PCTV1_D98, which are more often used for target dose evaluation, had a significant correlation with the bladder and rectal filling. Table 2 shows the results of correlation analysis between the dose parameter variations of PCTV2 and the geometric factors of anatomical change. There had a certain correlation with the bladder filling, but a weak correlation with the rectal filling. Conversely, no significant correlation between the external geometric factors and the target dose parameters was found.
The Pearson Correlation Between PCTV1 Dose Parameters and the Geometric Factors (P-Value).

Abbreviations: HD, hausdorff distance; Dice, dice coefficient; ΔV, volume change.
The Pearson Correlation Between PCTV2 Dose Parameters and the Geometric Factors (P-Value).

Abbreviations: HD, hausdorff distance; Dice, dice coefficient; ΔV, volume change.
Scatter Plot of the Changes of Bladder and Rectal Volume and the Variations of Target Dose Parameters
From Figure 4 and Figure 5, which show the scatter plots of the bladder and rectal volume variations with the dose parameters variations in target area respectively, only PCTV1_V100 and PCTV2_V100 exhibited significant changes, within the maximum variation range of bladder and rectum volume (142.04 ml and 40.50 ml, respectively). The variations of PCTV1_V95 and PCTV2_V95 were within 1%, and those of PCTV1_D2, PCTV2_D2, PCTV1_D98, and PCTV2_D98 were within 3%.

Scatter plot of the rectal volume variation and target dose parameter variation.
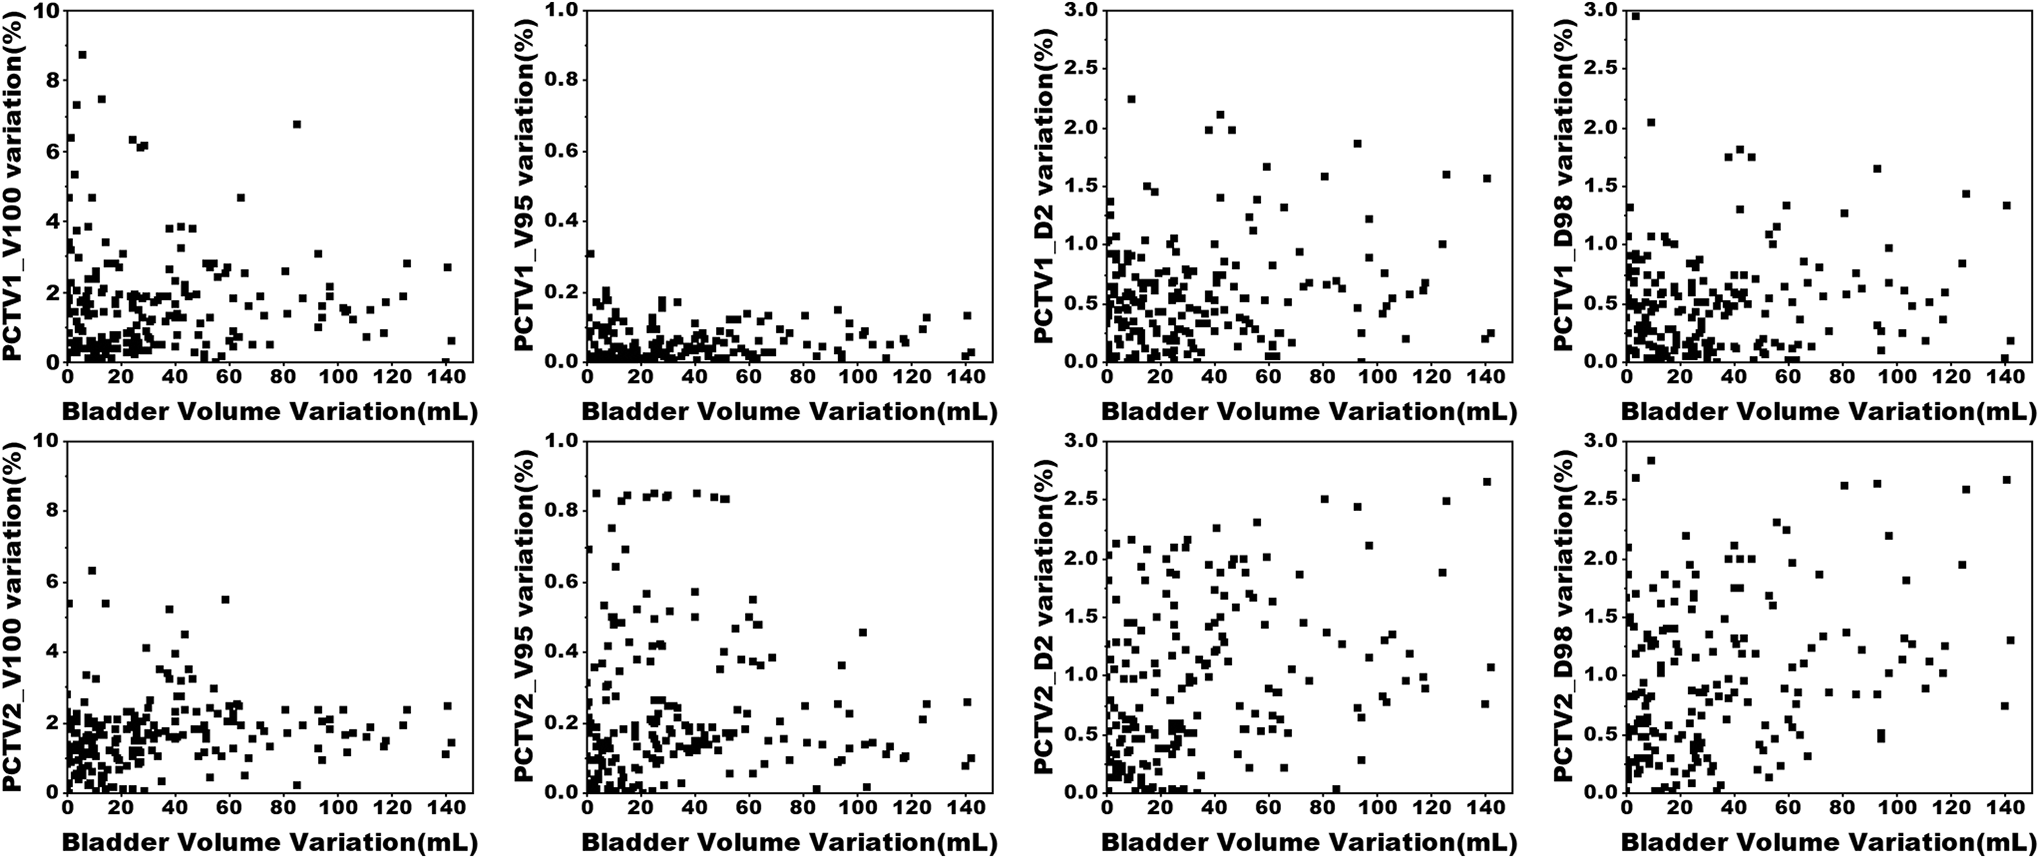
Scatter plot of the bladder volume variation and target dose parameter variation.
The Correlation Between the Dose Variation and the Volume Variation of the Bladder and Rectum
As shown in Figure 6, the received dose to the rectum increased with the relative rectal volume. With a 10% increase in volume, the V75, V70, and V65 of the rectum increased at 0.73%, 0.71%, and 1.18%, respectively. Conversely, a significant negative correlation was observed between the ratio of bladder volume variation and the variation of the bladder dose parameters. With a 10% increase in volume, the V75, V70, and V65 of the bladder changed at −0.21%, −0.32% and −0.39%, respectively. Notably, the increase or decrease of the bladder and rectal dose parameters with their relative volume was correlated with the planned dose parameters, and the planned doses to the rectum and bladder were 2.18±1.31/4.50±2.05 (%), 6.44±2.88/6.52±3.16 (%), and 10.63±4.53/9.40±4.09 (%) for V75, V70, and V65, respectively.
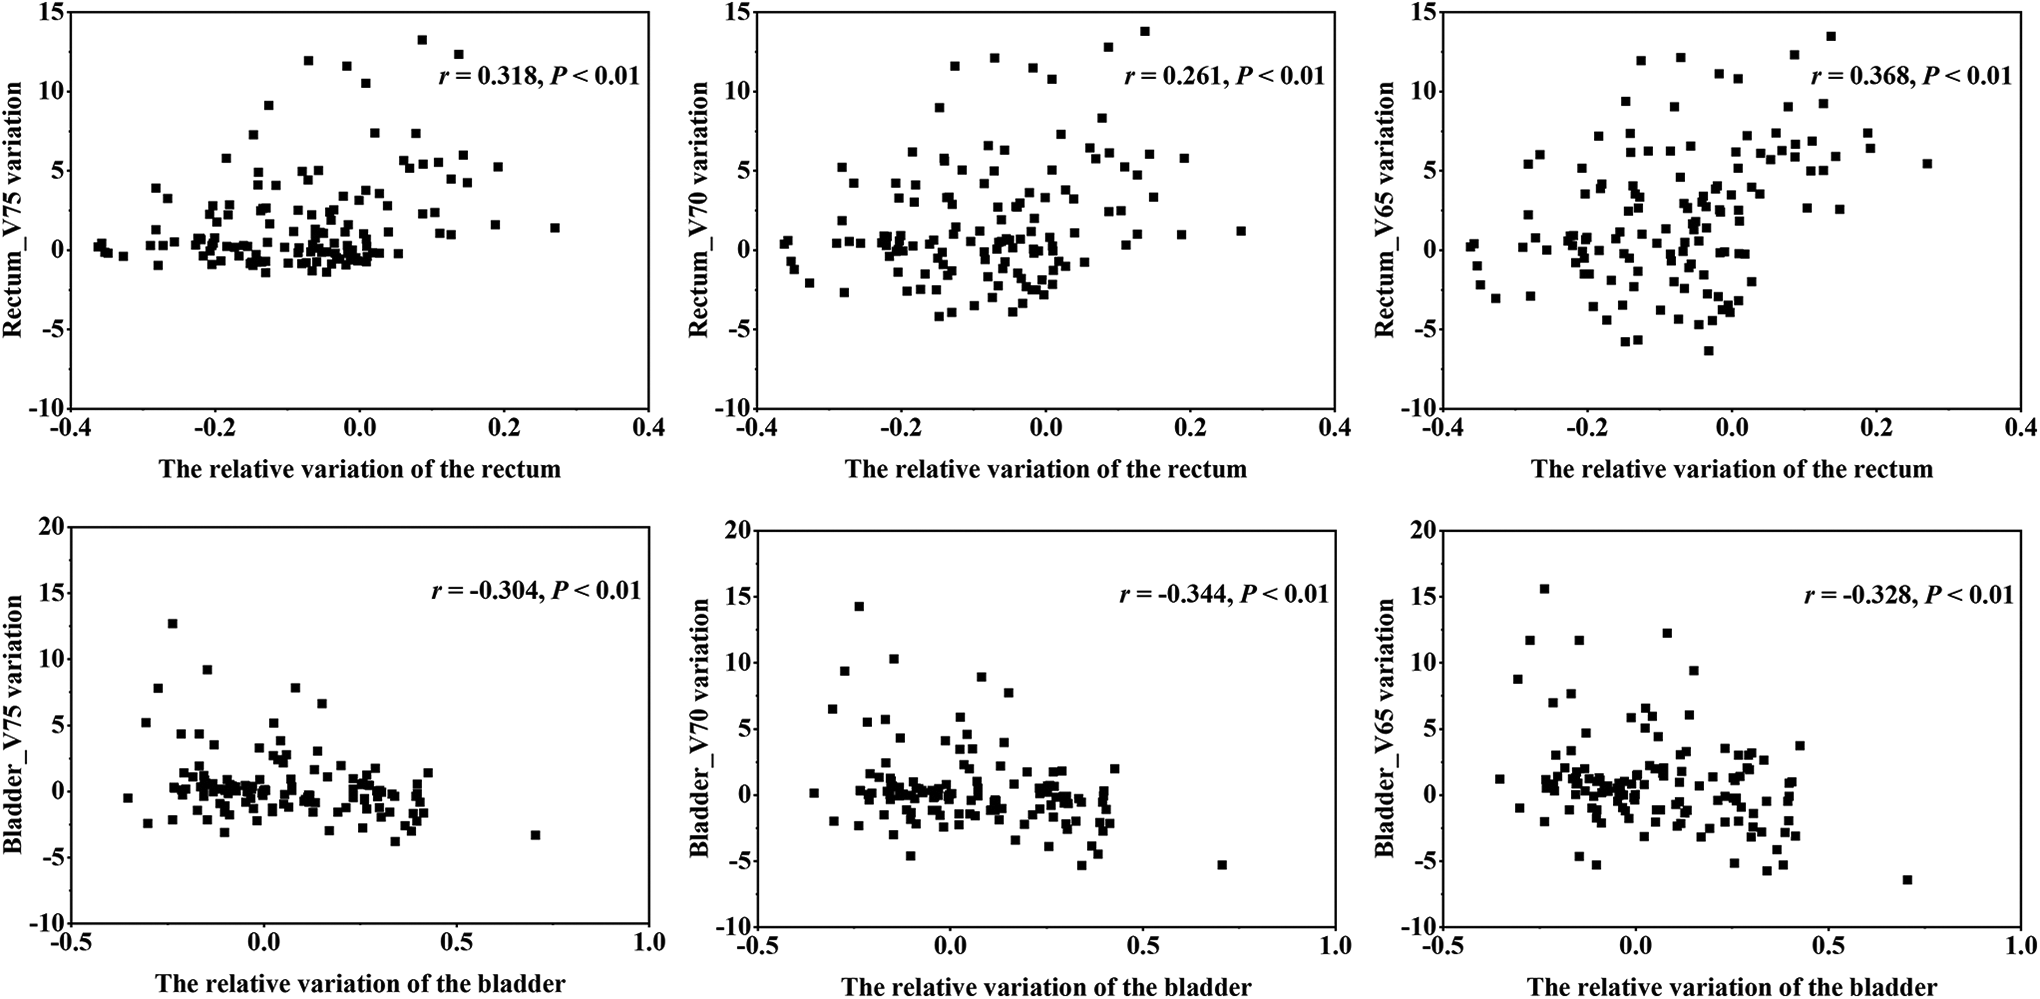
The scatter plot of rectal volume variations and target dose parameters.
Discussion
As recommended by the ESTRO guideline, 10 prostate registration, rather than bone registration is preferred for CBCT-based prostate cancer IGRT. Owing to the application of prostate registration, severe misalignment of the external contour is frequently observed in clinical scenarios. However, previous studies 11,12 mainly focused on the impact of the internal anatomical changes (e.g. bladder and rectal filling). Therefore, it is valuable to analyze the effect of the external anatomical change, bladder and rectal size changes to dosimetry for prostate cancer radiotherapy. Our analysis shows that both the external and internal anatomical changes have a minor impact on the PTV dosimetry.
Therefore, when using IGRT to correct the setup errors, the factors affecting prostate target dosimetry are inter-fractional deformation and intra-fractional motion of the CTV, which can be compensated by a certain PTV margin. Bostel et al 7 found that the average intra-fractional error of CTV was 0.3 ± 0.3 mm (medial-lateral, ML), 0.4 ± 0.7 mm (superior-inferior, SI), and -0.6 ± 0.7 mm (anterior-posterior, AP), and the average inter-fractional error was -0.6 to 0.9 mm (ML), −2.0 to 4.1 mm (SI), and −4.7 to 4.9 mm (AP). Bell et al 13 reviewed the matches of 806 CBCT images in 24 patients, and the mean errors ranged from 0.12 to 0.17 cm (AP), 0.14 to 0.14 cm (SI), and 0.04 to 0.04 cm left-right (ML). Maund et al 14 reported that by using daily online image guidance with CBCT, a reduction in CTV2 to PTV2 margins from 5 mm to 3 mm was achievable. Ingrosso et al 15 analyzed 120 CBCTs from 10 patients after the insertion of intra-prostatic fiducial markers. They reported that there is a statistically significant anti-correlation between prostate displacements and bladder volume variations (P < 0.001) in the y-axis, and rectal volume variations (P < 0.05) in the z-axis. Eventually, they calculated CTV to PTV margins obtaining the values of 2.5, 5.6, and 3.9 mm for the directions x, y, and z, respectively. Therefore, a 5-mm PTV margin is enough to account for inter-fractional deformation and intra-fractional motion of the CTV if image guidance is used to correct CTV position.
The results from Chen et al 6 showed that the dose of the central area changed by only 3.50 Gy, which was approximately 5.1%-4.2% of the prescription dose (64.8-79.2 Gy). Also, Bostel et al 7 showed that regardless of whether the anatomy was changed, there was no significant variation in CTV, CI, and HI of the bladder and rectum with daily diagnostic CT used for position correction. These two studies demonstrated that the dose coverage of CTV cannot deteriorate when IGRT was adopted despite the bladder and rectal filling. Among these selected dose parameters in this study, D2 and D98 are more commonly used for target dose evaluation. These crucial dose parameters were significantly correlated with the bladder and rectal filling, rather than the external geometric factors (Tables 1 and 2). This indicates the necessity of keeping consistent bladder and rectal filling states. However, the variations of PCTV1_D2, PCTV1_D98, PCTV2_D2, and PCTV2_D98 were almost below 3% (Figure 3 and 4). Therefore, we think neither the variation of bladder and rectum filling nor the body contour changes can significantly decrease the dose coverage of CTV when the rectal and bladder protocols and IGRT were used.
In this study, the maximum variation range of bladder and rectum volume was 142.04 ml and 40.50 ml, respectively. Maggio et al reported 16 that the mean bladder volume and rectum volume was 305.8 ± 187.7 cm3 and 62.4 ± 24.4 cm3, respectively. Moore et al 17 recommended that a threshold bladder volume of 150 mL may be appropriate for most patients undergoing definitive prostate image-guided IMRT. Hence, we believe that the dose of CTV can be ensured by adopting the rectal and bladder protocols to control the variation of bladder volume change below 142 ml and rectum volume change below 40 ml. We also agree that the bladder capacity should be controlled within the range of 150-282 ml, which is similar to the results of Eminowicz et al 18 (150-300 ml).
Despite the normalized volume of the bladder and the rectum was 0.13-0.58 and 0.12-0.50, respectively, an increase of 10% of bladder volume will cause a 5.6% reduction of mean dose. 6 Similar to the results from Pearson et al, 19 the volumetric dose received by the bladder decreases as the volume of the bladder increases, and the inverse was true for the rectum in our study. Hence, in our institution, the bladder filling and rectal emptying protocols were used, and the consistency of the bladder volume was further ensured using the bladder volume measuring device. The results showed that the mean Dice coefficients of body surface contour of PCTV1 and PTCV2, bladder and rectum were 0.979, 0.975, 0.888, and 0.827, respectively, and the mean Hausdorff Distance was 0.633, 1.505, 2.075, and 1.533, respectively. Because the average volume of the bladder exceeds 250 ml, the V75, V70, and V65 of the bladder was at a very low level. Although the V75, V70, and V65 of the bladder showed a reduction trend with increasing volume, this decline was very low and could be ignored. Furthermore, with a 10% increase in volume, the maximum increase in V75, V70, and V65 of the rectum was only 1.18%. Therefore, this proved that the variations of bladder and rectum were small, and it was not clinically meaningful when the bladder filling and rectal emptying protocols were used.
The radiation doses of the rectum and bladder are closely related to their toxic and side effects. Many studies have confirmed that the use of IGRT can reduce the PTV margin and reduce related toxic and side effects. 20 -23 Tondel et al 24 found that when using CBCT guidance (7 mm margins to PTV), compared with using 2D verification (15 mm margins to PTV), the V50, V60, and V70 of rectum and bladder in the CBCT group were significantly lower than those in 2D verification. But no significant difference was found in the genito-urinary (GU), gastro-intestinal (GI) toxicities, and quality of life. Crevoisier et al 2 used CBCT to compare the difference of daily versus weekly IGRT. They found that the daily guidance group had a lower incidence of acute rectal bleeding and late rectal toxicity, and better biochemical and clinical progression-free time with a 10-mm CTV-PTV margin (the posterior margin was 5 mm). In the research of Carl et al 25 the radiotherapy of prostate cancer patients was guided by Brainlab ExacTracTM system, with a 5-mm CTV-PTV margin. When the median observation time was 5.4 years, they found that the overall survival (OS), cancer-specific survival (CSS), and biochemical freedom from failure (BFFF) were 85%, 96%, and 80%, respectively, and that late toxicity GU and GI were 5% and 0% (RTOG scores ≥2), respectively. Hence, it is valid that partial dose changes of the rectum and bladder had little toxic and side effects on themselves when IGRT is used to ensure the accuracy of the target position. Moore et al 17 reported that bladder volume above 150 ml can meet the bladder dose-volume constraint in over 90% of the patients.
Besides, the basis of this study is that the virtual CT is sufficient for inter-fractional dose reconstruction. Moteabbed et al 8 reported that the gamma index between the planning CT and virtual CT is 100% for prostate cancer. Giacometti et al 9 reported the accuracy of the virtual CT-based dose calculation is within 0.2% on average. This means the virtual CT-based dose reconstruction is sufficient for prostate cancer radiotherapy. However, Thor et al 26 reported the average Dice coefficient for the deformed OARs was 0.80 (0.65-0.87) for prostate, 0.77 (0.63-0.87) for rectum and 0.73 (0.34-0.91) for bladder. Thus, manual modification of the deformed OARs is required to ensure the accuracy of volumetric dose reconstruction.
According to these results, we conclude that the target dose can be ensured without increasing the toxicity of OARs, when using IGRT to correct the target position. To further understanding whether the OARs dose is susceptible to the setup error, taking the result of CTV alignment as a baseline, a total of 27 different setup errors with 2 mm in each translational direction for ten fractions were simulated. We found there was considerable dose variation of bladder and rectum (See complementary file1). Hence, we think that using IGRT to correct the target position is crucial both for the dose of target and OARs, and the influence of surface contour changes is negligible for photon therapy.
Conclusion
Significant correlations were observed between the volume variation and the dose variation of the bladder and rectum. However, when a bladder and rectal filling protocol was adopted, the target dose coverage can be effectively ensured based on CBCT guidance to correct prostate target position, and the influence of the body contour changes and the variation of volume and position for bladder and rectum on the prostate target dose are negligible.
Supplemental Material
Supplemental Material, sj-tif-1-tct-10.1177_15330338211016370 - Analysis of the Influence of Peripheral Anatomical Changes for CBCT-Guided Prostate Cancer Radiotherapy
Supplemental Material, sj-tif-1-tct-10.1177_15330338211016370 for Analysis of the Influence of Peripheral Anatomical Changes for CBCT-Guided Prostate Cancer Radiotherapy by Yingjie Zhang, Xiangbin Zhang, Jing Li, Liang Zeng, Xuetao Wang, Xiaohong Wu, Yan Li, Xiaoyu Li and Renming Zhong in Technology in Cancer Research & Treatment
Footnotes
Authors’ Note
This study was approved by the Ethics Committee of West China School of Medicine, Sichuan University (No.20191128). All patients signed an informed consent form before radiotherapy.
Author Contributions
Yingjie Zhang collected data and drafted the manuscript. Xiangbin Zhang, Jing Li, Liang Zeng, Xuetao Wang, Xiaohong Wu, Yan Li, and Xiaoyu Li helped to collect the data. Renming Zhong designed the study, revised and final approved the manuscript. All authors read and confirmed the manuscript.
Declaration of Conflicting Interests
The author(s) declared no potential conflicts of interest with respect to the research, authorship, and/or publication of this article.
Funding
The author(s) disclosed receipt of the following financial support for the research, authorship, and/or publication of this article: This study was supported by 1·3·5 project for disciplines of excellence–Clinical Research Incubation Project (No: 2021HXFH029) and the Science and Technology Support Program of Sichuan province, China (No.2021JDKP0070).
References
Supplementary Material
Please find the following supplemental material available below.
For Open Access articles published under a Creative Commons License, all supplemental material carries the same license as the article it is associated with.
For non-Open Access articles published, all supplemental material carries a non-exclusive license, and permission requests for re-use of supplemental material or any part of supplemental material shall be sent directly to the copyright owner as specified in the copyright notice associated with the article.