
Abstract
Objective:
Stereotactic ablative radiotherapy is a very promising approach for the treatment of patients with prostate cancer. The aim of this study was to evaluate the clinical tolerance, effectiveness, patterns of failure, and attempt to define predictive factors based on our experience.
Methods:
The cohort consists of 264 low-risk and 236 intermediate-risk consecutive patients treated at one institution. Prostate-specific antigen (PSA), adverse effects, and androgen deprivation therapy (ADT) usage were noted.
Results:
Median follow-up was 31.3 months. Over 90% of the patients reported no gastrointestinal toxicity. There were 4 occurrences of G3+ sequelae. 75% patients had no genitourinary toxicity at first month, and up to 90% during the rest of follow-up, with only 1 case of G3 adverse event. The toxicity was more pronounced in patients with higher PSA concentrations. Prior to stereotactic ablative radiotherapy, the mean PSA was 7.59 and 277 patients used ADT. The PSA decreased for up to 20 months before reaching a plateau. The decline was slower, and PSA levels were higher in patients without ADT. A total of 15 treatment failures occured in a median time of 19.9 months. Higher PSA concentrations were connected with higher failure rates, even in the first month and prior to reaching Phoenix criterion.
Conclusion:
CyberKnife-based stereotactic ablative radiotherapy of low-risk and intermediate-risk prostate cancer patients is an effective and well-tolerated modality of treatment. PSA is the most important predictive factor. The evolution of PSA concentration in a particular subgroup of patients suggests that ADT in intermediate-risk cases could improve long-term results.
Introduction
The average lifespan of men in our country has increased by almost 19 years since our institution was established (1951). 1 The steadily increasing life expectancy conveys a need for both an efficient and effective modality of treatment but also well tolerated in terms of early and late toxicity since we can expect our patients to live up to 10 to 20 years on average, after radical treatment.
The concept of hypofractionation in prostate cancer patients (PCP) dates back to the late 20th century 2 ; although back then, the intent was most likely cost-efficiency. The main concern was the treatment toxicity, but due to an improvement in irradiation and imaging techniques allowing us to achieve excellent dose conformity (3-dimensional conformal radiation therapy, intensity-modulated radiation therapy, image-guided radiation therapy, and finally stereotactic ablative radiotherapy [SABR] along with CyberKnife [CK]), the toxicity of high fraction doses is becoming less and less of an issue.
That said, this modality could hardly be called a novelty, but the quantity of single-center experience studies and phase II trials is limited, while phase III research is still ongoing. 3 As described in the 2.2019 NCCN Guidelines for Prostate Cancer, 4 “longer follow-up (FU) and prospective multi-institutional data are required to evaluate long-term results.”
A treatment process should be regarded in 3 aspects: curability, adverse effects, and the convenience of the treatment itself. Radiobiologically, the α/β ratio of prostate cancer is very low compared to adjacent healthy tissues, 5,6 approximately 1.5 Gy according to Fowler. 7,8 It allows us to achieve a very high biological effective dose through escalation of fraction dose 9,10 compared to conventionally fractionated regimens, which could translate into a more effective local control of the tumor. Due to the very high dose conformity of CK SABR treatment, the dose delivered to organs at risk can be greatly reduced, and therefore, both the acute and the late toxicity can theoretically be maintained at mild and acceptable levels. 11 Moreover, compared to conventional fractionation schemes, SABR requires only 5 treatment sessions over 10 days, instead of 20 to 39 sessions over 4 to 8 weeks of treatment.
The main aim of this study was to evaluate the tolerance and effectiveness of SABR in PCP and assess whether CK SABR can be a standard procedure for a selected group of patients. The second purpose was to analyze treatment failures and an attempt to define predictive factors.
Materials and Methods
Material
The analysis included 500 consecutive low-risk (LR) and intermediate-risk (IR; excluding Gleason score (GS) 4 + 3 and including T2c) PCP treated with CK using fixed collimators, between 2011 and 2017 at a single institution. All patients were treated according to the protocol approved by the institutional board, and all signed an informed consent kept in the patient’s folder. Patient age varied from 45 to 87 years (mean: 69, median: 69). Two hundred sixty-four PCPs were from LR group and 236 from the IR group. All patients had good (Zubrod 0-1) performance status.
The inclusion criteria were:
– Previously untreated prostate cancer with GS of 3 + 4 or lower
– Maximum prostate-specific antigen (PSA) <20 ng/mL
– TNM T stage of T2c or lower
– TNM N and M stage 0
– <50 mm maximum dimension of prostate
– Feasibility of implanting fiducials.
The majority of patients (286) had T1c, 126—T2a, 51—T2b, and 37—T2c stage. The mean prostate dimensions were: x, 42.7 mm; y, 7.5 mm, z, 40.4 mm, and the mean volume was 34.2 cm3.
The most common GS was 6 (60%—300 patients). Eighty-eight patients had GS 5, 82 had GS 7, and 30 had GS <5. Low grades of GS (<5) were found mainly among the first cases treated. Due to the fact that some patients were diagnosed outside our institute, we tried to reevaluate all specimens. Unfortunately, in some cases (usually those diagnosed in small, remote clinics), we were not able to do so (hence, in these cases, we left the original GS).
The maximal PSA concentration before the start of SABR varied from 1.09 to 19.53 ng/mL (mean: 8.43 and median: 7.59), while the PSA concentration at the start of SABR varied from 0.008 to 20.00 (mean: 4.06, median: 2.8) and was heavily influenced by the usage of neoadjuvant androgen deprivation therapy (ADT). Two hundred seventy-seven patients were administered ADT before SABR [189, luteinizing hormone-releasing hormone (LHRH) agonist and flutamide; 45, LHRH agonist alone; 22, flutamide alone; 1, LHRH agonist and bicalutamide; 1, bicalutamide alone; and in 19 cases, we had no data regarding the kind of ADT]. The time of ADT uptake prior to SABR commencement varied from 1 to 48 months (mean: 5.7, median: 5.0). At first, we do not recommend neoadjuvant ADT for LR and IR PCP, but such treatment had been administered in certain urology clinics. In all cases, we discussed this matter with the patients and their attending urologists. In January 2018, we changed our policy on the basis of our own experiences—a slightly higher PSA concentration during FU in the IR subgroup without ADT, 12,13 and we started to advise a 6-month long antihormonal therapy based on LHRH agonists.
The patients’ clinical characteristics such as comorbidities and baseline urinary symptoms are summarized in Table 1.
Clinical Characteristics of Treated Patients.

Abbreviations: CK, CyberKnife; ADT, androgen deprivation therapy; PSA, prostate-specific antigen.
Treatment planning and irradiation
Prostate contours were completed based on a deformable registration of T2 multiplanar reconstruction and T1 volumetric interpolated breath-hold examination magnetic resonance imaging with the planning computed tomography (CT; fiducials served as reference points). In each case, 3 fiducials (Gold Anchors) were implanted in a triangle-like configuration. Urethral catheters were not used. The CT used for radiotherapy planning was performed on a positioning vacuum mattress, which was later used for treatment (further immobilization was not applied due to intrafractional fiducial tracking). Imaging and irradiation were performed on a moderately filled bladder. Patients were advised to empty their bladder and rectum (no laxatives were used) 2 hours before irradiation and then to drink 0.5 L of still water.
All patients received 36.25 Gy in 5 fractions (7.25 Gy per fraction) delivered every other day. The Clinical Target Volume (CTV) consisted of the whole prostate and the proximal 1 cm of the seminal vesicles. A 5 mm margin (except 3 mm posteriorly) was applied to the CTV to form the Planning Target Volume (PTV).
The multiplan treatment planning system (version 4.6.1.) with Prostate Template Path was used. The acceptable maximum dose in CTV was 43.5 Gy, and the organs at risk dose constrains are shown in Table 2.
Dose Constrains for Organ at Risk.

The number of beams varied from 180 to 250. The treatment time ranged from 40 to 65 minutes per treatment session.
All patients were treated according to routine clinical protocol approved by a clinical board and did not require an agreement of an ethical committee.
Follow-up
End of FU, if applicable, was marked by the date of treatment failure or the date of the last recorded visit in the remaining cases. Data were collected at 1, 4, and 8 months after SABR completion and twice a year thereafter. The recorded parameters were PSA concentration, morbidity, and intensity of acute (up to 4 months) and late adverse effects according to the EORTC/RTOG scoring system, ADT usage, and occurrence of local, nodal, and distant failures.
Statistical Analysis
A 2-way analysis of variance with interaction for repeated PSA concentrations for the whole FU and from the 19th month of observation was undertaken. The differences between PSA concentrations in the study groups, with months of observation, were estimated using Tukey post hoc test and expressed in the least squares means (LSM). 14
For the repeated measures of the analyzed gastrointestinal (GI) and genitourinary (GU) grades during the observation, the possible effects of the selected risk factors were examined using a mixed-effects ordinal logistic regression. 15
Due to repeated measures of PSA during the observation, the possible influence of the biomarker on the analyzed clinical events was studied using a mixed-effects Cox regression. 16 The possible risk factors for recurrence, metastasis, and all failures were examined using a Cox regression and were expressed using the classic hazard ratio (HR).
Additionally, the evolution of PSA concentrations over the course of the FU was analyzed as a predictor of failure risk using receiver operating characteristic (ROC) curves, and a comparison of PSA concentration between the whole group and the failed patients for the first 3 FU controls was performed.
Results
Follow-up varied from 1 to 76 months (mean: 32.7, median: 31.3). The number of patients who attended the scheduled FU visits was 327 at 1 month, 431 at 4 months, 420 at 8 months, 396 at 14 months, 319 at 20 months, and 250 at 26 months.
This quantity decreased gradually to 44 at 56 months after SABR. Later, the fraction of patients comprised in the FU was too small to undertake calculations.
The percentage of patients using ADT decreased from 65.4% during the treatment (SABR) to 0% at 56 months. The decrease in ADT use was due to the completion of prescribed ADT courses over time, as well as due to a discontinuation of ADT when deemed no longer necessary by the team, in consultation with the patients and their urologists.
Treatment Tolerance
Acute and late GI and GU adverse effects were slight. The percentage of patients without GI adverse effects remained above 90%. There were only a few G2 and G3 side effects. One severe GI G4 complication was noted—a rectourethral fistula 26 months after SABR. The patient underwent reconstructive surgery without success and after the next few months was prepared for the next operation. The distribution of GI adverse effects is shown in Figure 1.
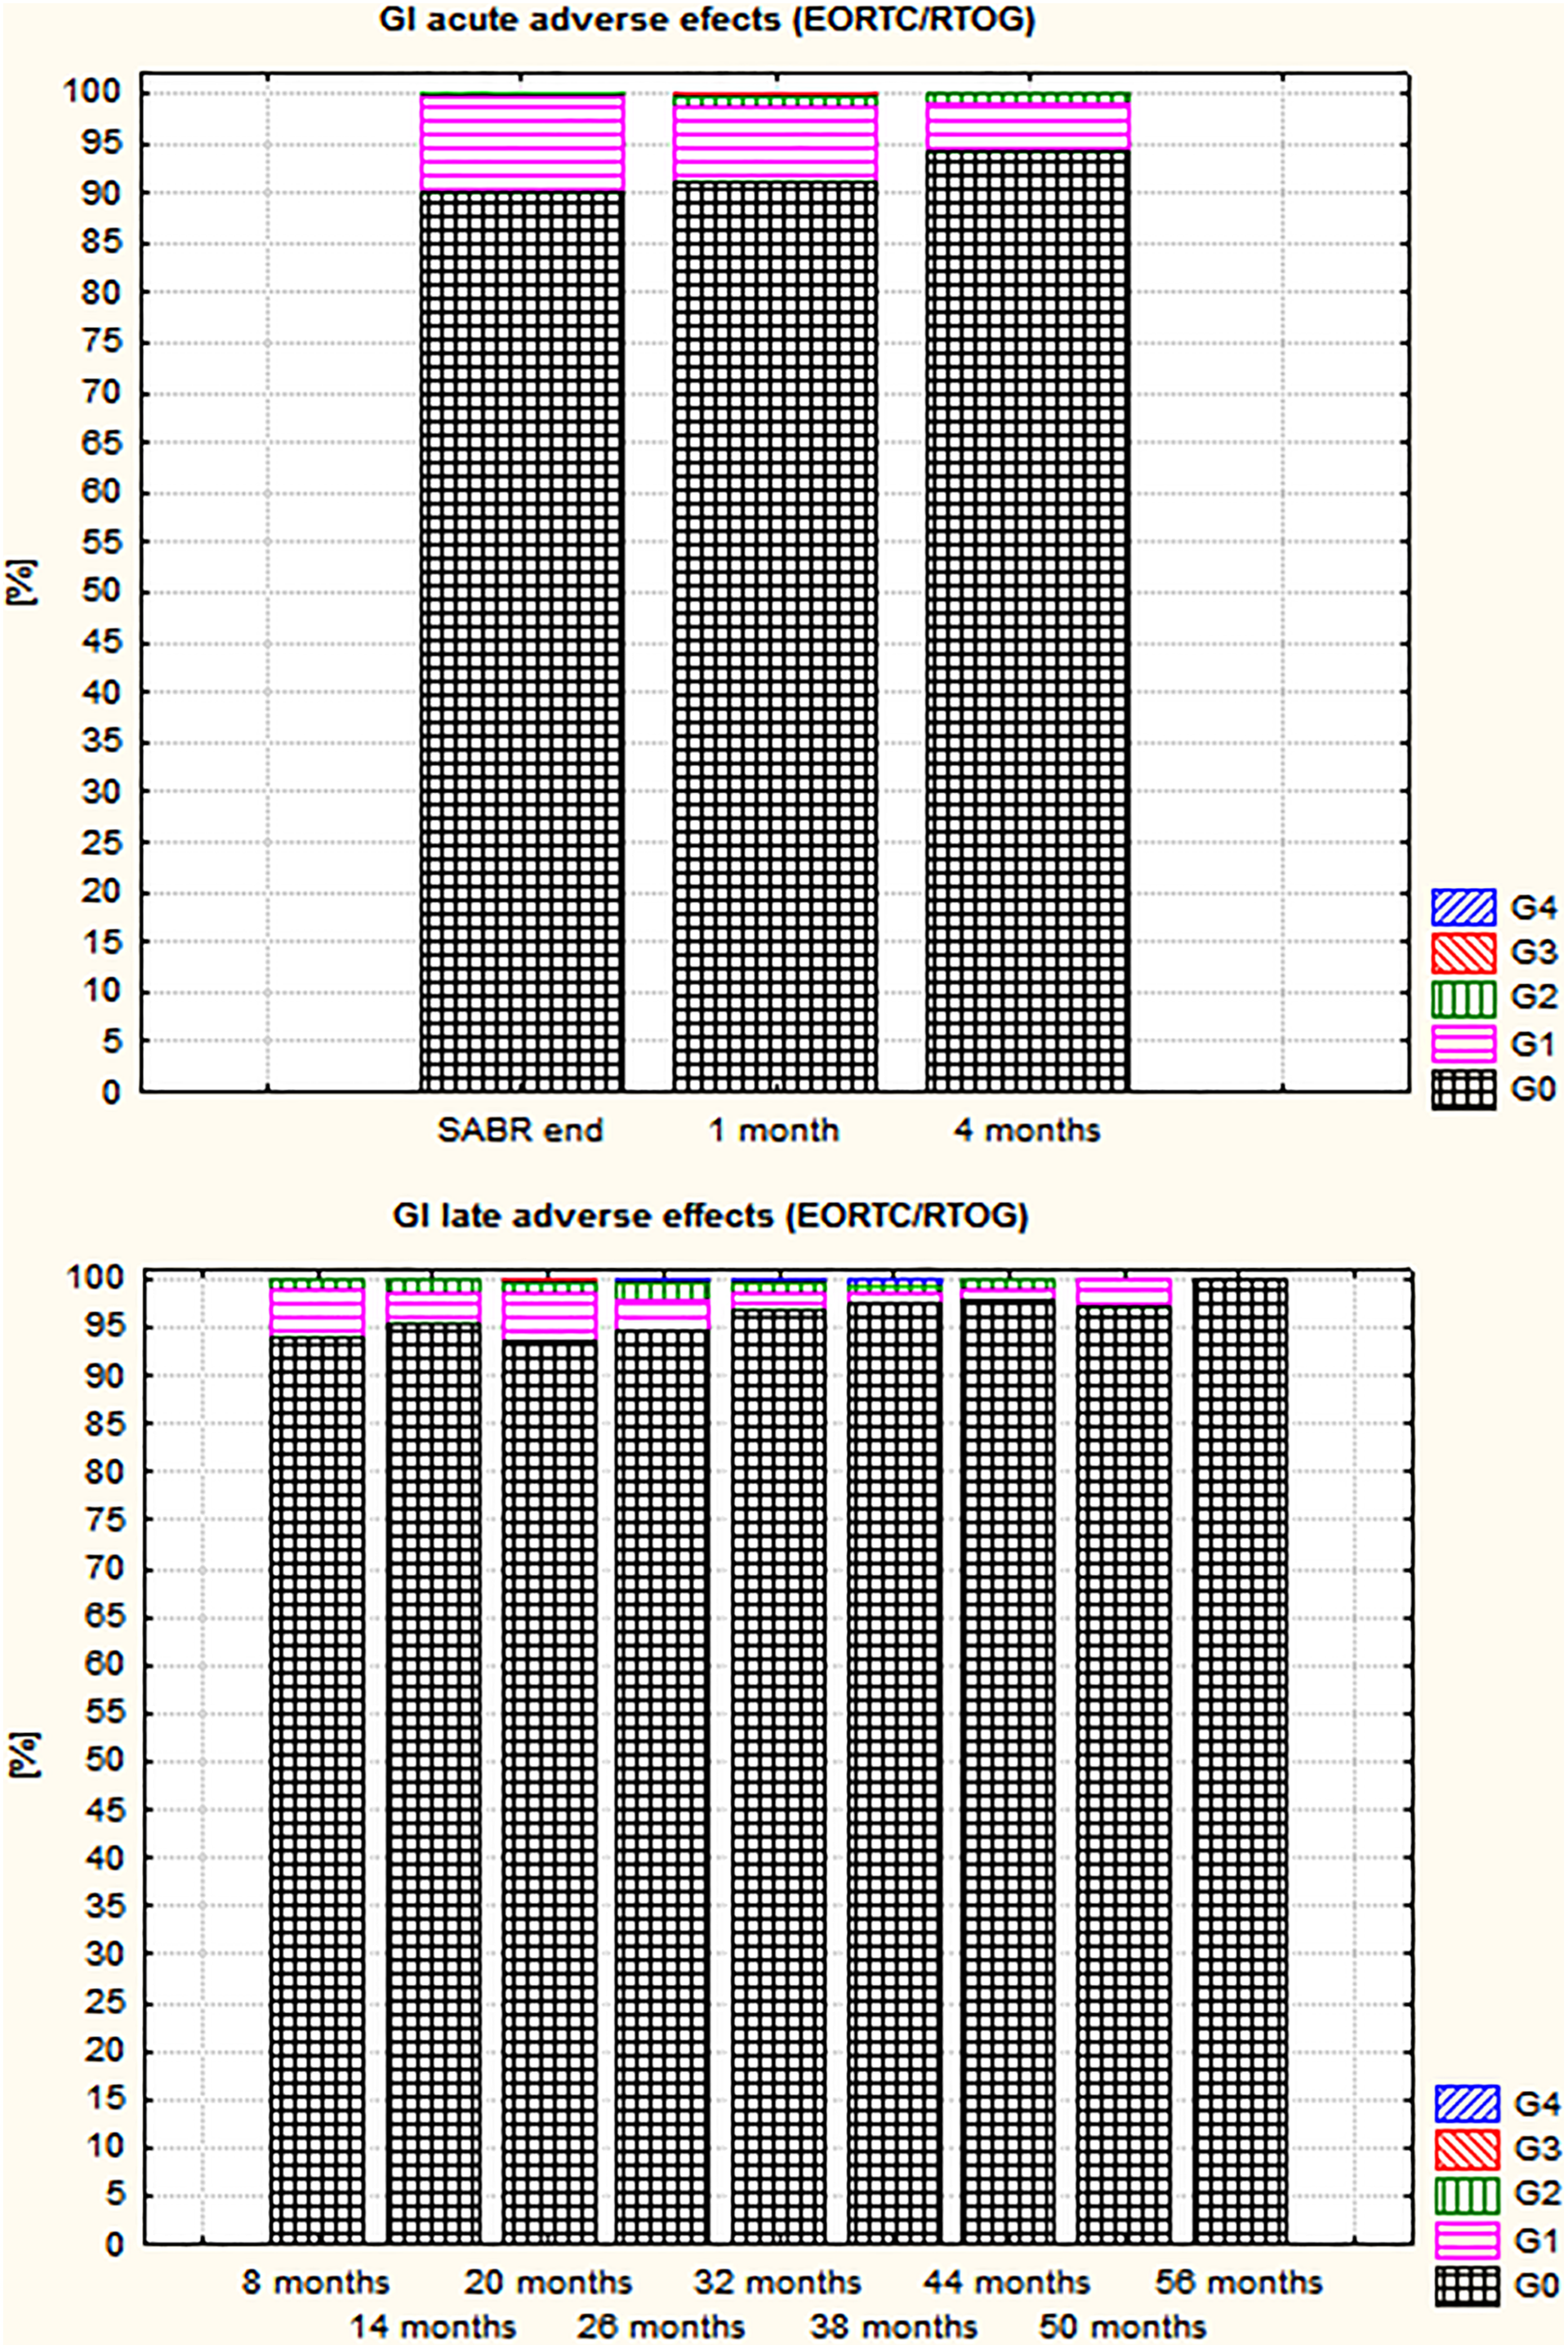
Distribution of acute and late gastrointestinal adverse effects.
The percentage of patients without acute GU adverse effects was lower than in the case of GI. At the time of SABR completion, and 1 month later, this number was around 75%; but 1 month after this, it increased to 90%. During the first 4 months, mainly G1 side effects appeared. Only 1 case of G3 toxicity was noted.
The percentage of patients without GU late adverse effects was above 90%. No G3 toxicity was noted. The distribution of GU adverse effects is presented in Figure 2.

Distribution of acute and late genitourinary adverse effects.
Risk estimates for GI and GU toxicity in patients were expressed by classical odds ratios and are reported in Table 3.
ORs of Risk for GI and GU (Mixed Effects Ordinal Logistic Regression).

Abbreviations: ADT, androgen deprivation therapy; CI, confidence interval; FU, follow-up; GI, gastrointestinal; GU, genitourinary; OR, odds ratio; PSA, prostate-specific antigen; SABR, stereotactic ablative radiotherapy.
Based on the results in Table 3, it can be concluded that time (during the FU period) has a significant impact on GI adverse effects in patients (severity of symptoms decreases with time); after 1 year from SABR, the chance of GI adverse effects was reduced to (1 − 0.9712) × 100% = 31%. The statistical interpretation of the remaining estimates in Table 1 is analogous. This means that the intensity of GI adverse effects is lower in the group of patients using ADT before SABR and decreased with the duration of ADT usage. On the other hand, the intensity of GI adverse effects increased with maximal PSA concentration before SABR and with PSA concentration growth during FU. The intensity of GU adverse effects decreases over time during FU and with the duration of ADT usage before SABR and increases with PSA concentration growth during FU.
Treatment Effectiveness
Prostate-specific antigen kinetics
The PSA levels significantly decreased over time starting with a steep decrease for the first 20 months followed by a plateau. When we analyzed the kinetics of the PSA mean in the subgroups with and without ADT (ie, that patients had started ADT before SABR), we have observed a slower decrease in patients without ADT, especially in the subgroup with both IR disease and no ADT (Figure 3).
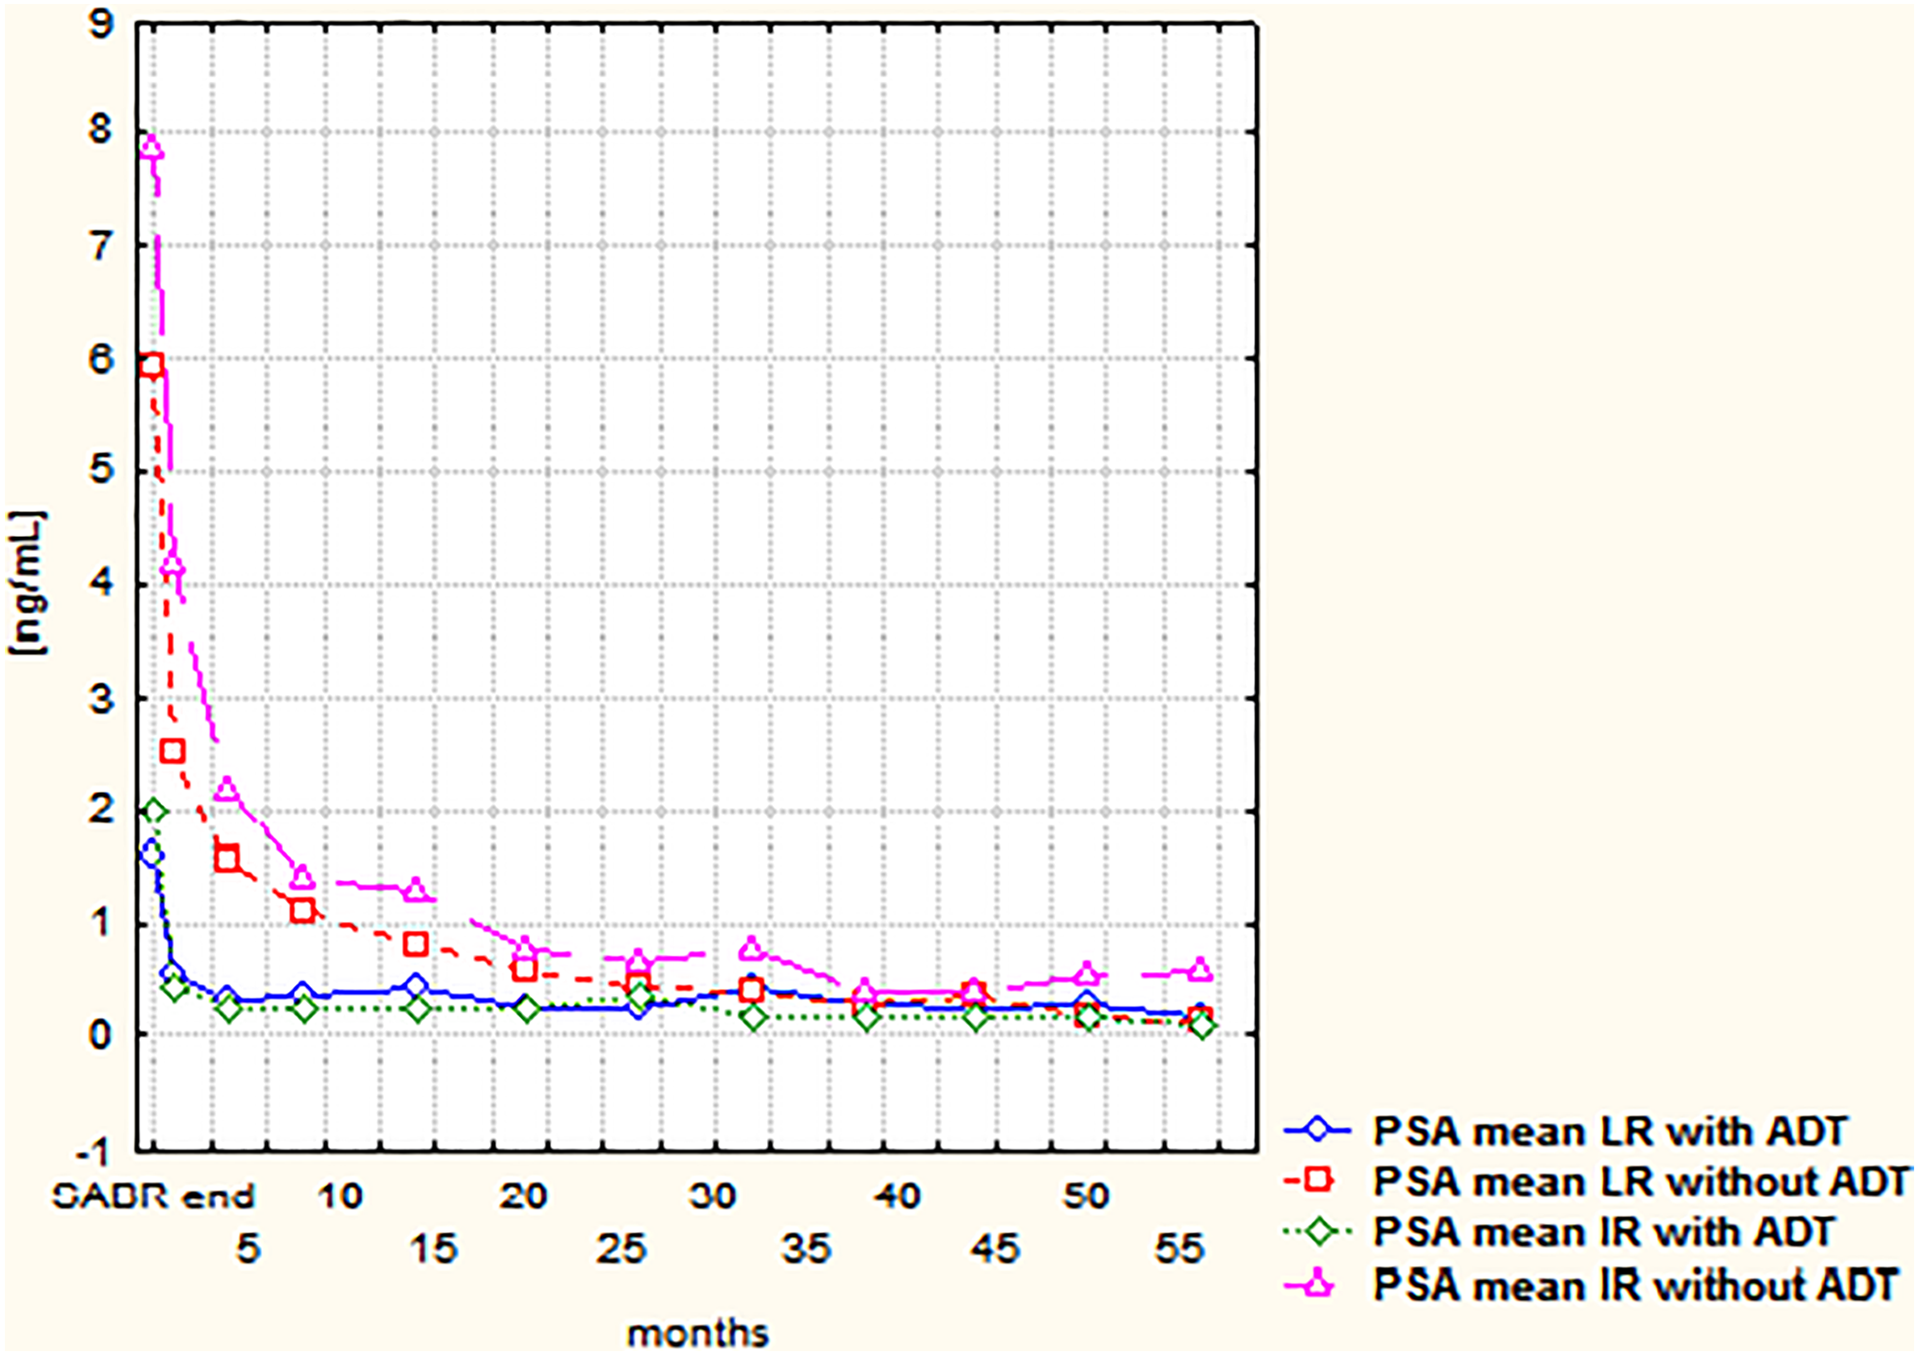
The course of prostate-specific antigen means in low-risk and intermediate-risk subgroups with and without androgen deprivation therapy.
Analyzing the differences between PSA concentrations between study groups over months of observation, and following the estimated 95% confidence intervals for the LSM, it can be established that between LR with ADT (LSM 0.25), IR with ADT (LSM 0.43), and LR without ADT (LSM 0.29), the statistical difference in the level of PSA is insignificant. Similarly, there is no significant difference between LR without ADT and IR without ADT (LSM 0.66). There is, however, a statistically significant difference in the PSA concentration between both LR with ADT and IR with ADT groups and IR without ADT.
The PSA mean changes were similar for the period starting from the 20th month of observation until the end of FU (Figure 3). As the initial FU could be influenced by ADT uptake (a substantial percentage of patients used ADT in this period), we decided to check the results for the second part—over 19 months (84.3% of patients without ADT uptake in the 20th month of FU and above 90% thereafter). We found a statistical difference (P < .0001) between the subgroups in relation to PSA concentrations (the highest concentrations in this period were in IR subgroup without ADT).
Failures
We found 15 (3%) (8 in LR and 7 in IR patients) treatment failures. Nine of them appeared in the subgroup without ADT. The time to failure varied from 8.1 to 54.8 months (mean 23.7, median 19.9).
Eight (53.3%) were local relapses and 7 (46.7%) distant failures. Four relapses appeared in LR and 3 in IR patients. Among the relapses, in 2 cases, we had pathological confirmation (biopsy) and 6 were considered as biochemical failures (BFs) according to the Phoenix criterion. In these situations, ADT was started without diagnostic examinations outside our institution. The time to relapse varied from 10.6 to 54.8 months (mean: 25.4, median: 22.1). For BF, these values were 10.6 to 33.1 months (mean: 21.4, median: 20.3), and for pathological relapses (2 patients), 19.9 and 54.8 months.
Metastases appeared earlier than relapses: 8.1 to 37.9 months (mean: 21.7, median: 17.5). In 4 cases, metastases were found in LR, and 4 in IR patients. In 2 cases, metastases were found in the bones (solitary metastasis to the iliac bone and multiple dissemination to the pelvis), and in 5, in regional, pelvic lymphatic nodes. The mean and median values of the appearance of nodal and bone metastases were 19.2 and 13.1, and 27.7 and 27.7 months, respectively.
Hazard ratios (mixed effects Cox regression) and P values for recurrence, metastasis, and all failures were: HR = 3.45, P = .0491, HR = 2.03, P < .0001 and HR = 2.48, P < .0001, respectively. Following these results, a statistically significant (P < .05) impact of PSA on recurrence, metastasis, and clinical failure events can be established.
The ROC analysis clearly showed that subsequent increasing PSA concentrations are sensitive indicators of risk of failure. Higher PSA concentration in the first months of FU, even if not fulfilling the Phoenix criterion, is a negative prognostic factor for the failure risk (as shown in Table 4).
Comparison of PSA Concentration at the Beginning of FU for Whole Analyzed Group and Failed Patients.

Abbreviations: FU, follow-up; PSA, prostate-specific antigen.
Discussion
Treatment Tolerance
The low prevalence and low intensity of adverse effects, as well as the more pronounced acute GU reactions compared to GI, are consistent with our previous reports. 12,13,17,18 Even lower toxicity was described by Meier et al 19 (309 patients treated 5 times with 8 Gy, median of FU: 61 months), there were no G3 GI adverse effects compared to 1 incidence of G4 and 3 of G3 (2 acute—0.3% 1 month and 0.2% 4 months after SABR, and 1 late—0.3% in the 20th month of FU). There were no differences in GU—4 patients experienced G3 toxicity, in comparison to 3 G3 acute incidents in our group. No G3 toxicity was also reported in an Italian study (52 patients—FU median: 34 months), 20 similarly Jackson et al does not report G3 toxicity (66 patients—FU median: 36 months). 21 During the 10 years of FU after SABR of 230 LR group patients, Katz does not report a higher than G2 GI toxicity and 10% G2-3 GU late adverse events. 22 In Nordic data (240 patients, median of FU—months), a 1.8% and 0.9% of intermediate-term G3 GU and GI toxicity is reported. 23 Similarly, Boyer et al 24 described a lack of G3 GU toxicity (60 patients were treated with 5 × 7.4 Gy; median of FU—28 months) and 1 G3 GI late event only. Two events (2.2%) of G3 GI late toxicity were also reported by Park and colleagues. 18
In summary, the acute and late toxicity of SABR for PCP is comparable to that presented in other publications. The only 1 significant difference is the presence of 1 G4 GI adverse effect—not described in other cited reports.
Regarding the grade 4 toxicity observed (rectourethral fistula), we went back and investigated the treatment plans of this patient. All constraints were properly adhered to and no overdosage was found, but the rectum was filled with stool and gas (maximal diameter: 49.9 mm). It is possible that a physiological change caused the topography to differ, resulting in a different actual dose distribution and a rectal overdosage followed by the formation of a fistula. This occurrence caused us to include a maximum rectal width of 40 mm on treatment planning CT as a requirement for SABR planning (if else—a repetition of treatment CT is necessary).
The impact of time on adverse events as shown in Table 3 is clear—their intensity decreases over time, as a result of healing processes. An adjuvant ADT decreases the intensity of GI adverse effects. The high values of maximum PSA concentration in the case of GI toxicity and actual (assessed during FU) in the case of GI and GU toxicity are correlated with their high intensity.
Those phenomena are clearly connected (the direct impact of ADT on PSA concentration), but an explanation for ADT and PSA impact on adverse events is rather difficult. It is possible that ADT decreases prostate volume, which can influence the treatment planning and risk of toxicity; on the other hand, a direct, impact of prostate volume on adverse effects was not found in this patient group.
Interestingly enough, even though possible elevated (late) adverse effects were one of the most commonly quoted arguments against SABR, it seems that the treatment toxicity with this technique is comparable or even lower than in our patients assigned to conventional radiation therapy (RT). However, the groups in the conventional RT studies were significantly smaller and included many patients who would not met the SABR qualification criteria. 25,26
Treatment Effectiveness
Prostate-specific antigen kinetics
We noticed the rapid decline in PSA concentration (mainly during the first year of observation) after SABR. Similar observation is also reported by Park et al. 27 In the period after the 20th month of observation, apart from the subgroup IR without ADT, we observed slow gradual decline in PSA concentration (also described by Park et al). The gradient of initial decline in the subgroup IR without ADT (Figure 3) was also larger than for LR without ADT, but it was mainly because of the higher initial PSA concentration. Rapid PSA decline after SABR (1.5 at 6 months and 0.6 ng/mL at 18 months of FU) is described by Dixit et al, 28 who mentioned that there is no difference when it comes to ADT versus no ADT. This result is in discordance with ours—such values in our materials refer more to the no-ADT subgroup (Figure 3). In patients without ADT, we observed fast PSA decline during the first half of the year after radioablation and slower up to the 20th month of FU. The PSA concentration of patients using ADT plateaued after third month of FU.
Considering the decrease in the number of followed up patients (only 30.6% in the 38th month), we can only assess early PSA kinetics; according to Kataria 29 and Kim, 30 the median time to nadir after SABR was 36 months, so probably we can expect some changes during a longer FU.
The pertinent finding seems to be the significant difference in PSA concentration after the 19th month of FU between IR without ADT and the rest of the analyzed group (Figure 3), indirectly suggesting the essential role ADT plays for IR patients. On the other hand, there is no confirmation of such a thesis when taking failures into consideration—7 (47%) of them (only 3 of them without ADT) appeared in the IR subgroup.
Failures
We recorded a failure rate of 3% (maximum FU: 76 months, median: 31.3), which is comparable to other published results for LR-IR patients. Park reports 94.7% a 5-year biochemical-free survival (BFS) rate (median of FU: 63.8 months) in the mixed group (LR, IR, and HR). 18 Meyer describes 97.1% (IR) and 97.1% (LR) 5-year disease-free survival. 19 Alongi (LR and IR) reports only 1 failure (5.2%) in a median FU of 34 months. 20 A very high BFS was noted in 230 LR patients during 10 years of observation. 22 In other data, 5-year BFS for LR and IR patients is shown as 98.5% and 95%, respectively. 29 The Kuopio group reports 100%, 96.6%, and 92.8% of BFS in LR, IR, and HR groups, respectively. 16 In the comparative trial of Ricco et al, 31 91.9% of 6-year BFS is reported in the SABR group. Late results (8-year BFS) of a large mixed group (515 patients) are shown in a study by Katz—93.6%, 84.3%, and 65.0% for LR, IR, and HR groups, respectively. 32
Analyzing the pattern of failures, we did not find any clear prognostic factor within our study group. The distribution of failures and the distribution of relapses and confirmed metastases were comparable between the risk groups. Sixty percent of the failures were present among patients without ADT uptake. Three of them were in the no-ADT IR subgroup and 6 in the no-ADT LR subgroup. However, it could be a misinterpretation to form a conclusion that LR patients could have benefited from ADT—it is proven that such a treatment does not improve the overall treatment result.
As mentioned previously, we found a statistically different course of PSA concentration after the 19th month of FU in the subgroup of IR patients not using ADT (Figure 3), which was not connected with an increased risk of failure—only 3 relapses in this subgroup. On the other hand, a statistically significant impact of PSA on risk of failure (including local/biochemical relapse as well as dissemination) was proven (probably such a result was impacted by high PSA concentrations before the failures were revealed in the LR group—the Cox regression took into account consecutive repeated values of PSA during FU). On the basis of these data, and data presented in the discussion, we can try to form a preliminary conclusion that in the larger group/longer observation, a positive impact of ADT administration in the IR group could be found.
Finally, PSA concentration seems to be the most important factor influencing the failure risk, which was also confirmed by the results of the ROC curves analysis and direct comparison of PSA values at the beginning of FU between the whole analyzed group and treatment failures.
Conclusion
CyberKnife-based SABR of LR and IR PCP is an effective and well-tolerated treatment modality. Prostate-specific antigen concentration before SABR and during FU (even in the first month of observation) is the most important prognostic factor for risk of failure and the intensity of adverse effects.
Analysis of PSA course in different ADT usage and risk groups suggests that ADT usage in the IR patients could improve long-term results. However, this hypothesis needs to be validated in a randomized trial setting and over a longer FU.
Footnotes
Authors’ Note
Treatment described in this manuscript is a routine modality performed on the base of treatment protocol accepted by radiotherapy board at our institute.
Declaration of Conflicting Interests
The author(s) declared the following potential conflicts of interest with respect to the research, authorship, and/or publication of this article: Corresponding author gave lectures for Accuray.
Funding
The author(s) received no financial support for the research, authorship, and/or publication of this article.