
Abstract
Fibroblast growth factor receptor 1 (FGFR1) is widely recognized as a key player in mammary carcinogenesis and associated with the prognosis and therapeutic response of breast cancers. With the aim of investigating the correlation between FGFR1 expression and estrogen receptor (ER) and exploring the effect of FGFR1 on endocrine therapy response and ER+ breast cancer prognosis, we examined the FGFR1 protein expression among 184 ER-positive breast cancers by the immunohistochemistry (IHC) method, analyzed the association between FGFR1 expression and disease characters using the Pearson’s chi-square test, and assessed the prognostic role of FGFR1 among breast cancers using Cox regression and Kaplan-Meier analyses. Moreover, in vitro assays were conducted to confirm the correlation between FGFR1 and ER expression and investigate the effect of FGFR1 on tamoxifen (TAM) sensitivity in ER+ breast cancer. The results showed that ER expression was negatively correlated with FGFR1 expression (P = 0.011, r = -0.221). Moreover, FGFR1 expression was one of the prognostic factors of ER-positive breast cancer (OR = 1.974, 95% CI = 1.043-3.633), and high FGFR1 expression was correlated with decreased breast cancer overall survival. In addition, knocking down FGFR1 inhibited cell proliferation and enhanced TAM sensitivity in TAM-resistant cells. In conclusion, we found that there was a significant negative correlation between FGFR1 and ER levels in ER+ breast cancers, high FGFR1 protein expression was associated with poor breast cancer prognosis, down-regulating FGFR1 could elevate ER expression and is associated with enhanced TAM sensitivity in ER+ breast cancers.
Introduction
Breast cancer is the most common malignancy in women worldwide, and its incidence has increased substantially in both developed and developing countries over the past decades. 1 Estrogen receptor (ER)-positive breast cancer represents the most common clinical subtype and constitutes almost 80% of all breast cancer cases. 2 The prognosis of this subtype is generally favorable, owing to the application of adjuvant endocrine therapies, which down-regulates estrogen signaling and results in tumor growth inhibition. 3 Nevertheless, about 20% of luminal breast cancers relapse during or after receiving anti-estrogen treatment 4 due to intrinsic or acquired resistance to endocrine therapies that has become a severe clinical concern. Therefore, understanding factors leading to such resistance is critical for improving the therapeutic outcome of ER-positive breast cancers.
Fibroblast growth factor receptors (FGFRs) belong to the receptor tyrosine kinase (RTK) superfamily and regulate multiple fundamental biological processes, such as development, wound repair, angiogenesis, and endocrine functionalities. 5 -7 However, deregulation of FGFR signaling could also promote tumor development by supporting angiogenesis and driving tumor cell proliferation and survival. 8,9 FGFR1 is an important member of FGFRs and has been recognized as a certain oncogene in diverse types of cancers, including breast cancer, ovarian cancer, bladder cancer, and rhabdomyosarcoma. 10 -13 Several studies have demonstrated that FGFR1 was amplified in up to 10% of all breast cancers, predominately among ER-positive cases, and could result in poor prognosis. 14 Moreover, it was reported that the copy number gain of FGFR1 was substantially associated with endocrine therapy resistance. 15 Despite frequent reports confirming these observations, the underlying mechanism awaits to be elucidated.
Loss of estrogen receptor expression has been recognized as an important mechanism of acquired endocrine resistance and occurs in about 15% to 20% of resistant breast cancers. 16 -19 In this study, we investigated the correlation between FGFR1 and breast cancer clinical-pathological features, especially ER expression, and further explored the effect of FGFR1 on endocrine therapy response and ER+ breast cancer prognosis.
Materials and Methods
Characteristics of Patients and Clinical Assessments
One hundred eighty-four ER-positive breast cancer cases were involved in this study. All participants were patients with sporadic breast cancer from the Department of Breast Surgery at the Affiliated Hospital of Jiangnan University from 2013 to 2019. The diagnoses were based on their surgical and pathological evaluation, and information about their disease was obtained from the medical files. ER statuses of the cases were evaluated by the immunohistochemistry (IHC) method. Patients involved in this study had no history of other tumors and were not given preoperative radiotherapy or chemotherapy. Furthermore, participants were interviewed respectively to collect information on demographic characteristics. This study was approved by the ethics committee of the hospital.
Immunohistochemistry
IHC was used to detect the FGFR1 protein expression of 184 breast cancer tissues. IHC staining was performed using a Benchmark XT auto-stainer (Ventana Medical Systems Inc., Tucson, USA), and the FGFR1 antibody (ab10646, Abcam, UK) was diluted to 1:2000. Protein expression of FGFR1 was quantified as a percentage (range 0-100%) of positive cells present among all tumor cells presented. A cut-off value of 10% was selected for FGFR1 protein expression, where above 10% was defined as “high expression” and below as “low expression”. 20 IHC staining for ER and PR was considered positive if ≥ 1% of tumor cell nuclei were stained. 21 In addition, the expression of ER was scored as 1+, 2+, and 3+ based on its staining intensity. 22 Expression of HER2 was evaluated with the HercepTest kit (Dako) and scored as 0, 1+, 2+, and 3+. Scores of 0 and 1+ were determined as negative, and 3+ were determined as positive. 23 Each of the sections was scored by 2 observers, who were blinded to patients’ medical information, and disagreement between the observers was solved by discussion.
Cell Lines
The human ER+ breast cancer cell line MCF-7 was purchased from the American Type Culture Collection (ATCC) and stored in liquid nitrogen. MCF-7 cells were maintained in RPMI 1640 medium (GIBCO, Thermo Scientific, USA) with 10% fetal bovine serum (GIBCO, Thermo Scientific, USA) and cultured in a 37% incubator supplied with 5% carbon dioxide. To establish the tamoxifen (TAM)-resistant cell line, parental MCF-7 cells were cultured in medium plus 1μM TAM over 6 months. 24
Small Interfering RNA (siRNA) and Transfection
Plasmids carrying siRNA were used to knock down FGFR1 expression in parental and TAM-resistant MCF-7 cell line. FGFR1 siRNA oligos (siRNA1 sense: 5’-ACAUUGACGGAGAAGUAGGUG-3’, anti-sense: 5’-CCUACUUCUCCGUCAAUGUUU-3’; siRNA2 sense: 5’-AACAUUGACGGAGAAGUAGGU-3’, anti-sense: 5’-CUACUUCUCCGUCAAUGUUUC-3’) were synthesized by Invitrogen. Moreover, a scrambled siRNA was used as a negative control (NC). Transfection was conducted using Lipofectamine 2000 (Invitrogen, Thermo Scientific, USA) reagent. The transfected cells were harvested at 48 h after processed for RNA and protein extraction.
Western Blotting
Standard western blotting was conducted using total protein extracted by radioimmunoprecipitation assay (RIPA) buffer supplied with 1x Phenylmethylsulfonyl Fluoride (PMSF). The primary antibodies used in this assay included FGFR1 (1:1000, Abcam, ab206382) and β-actin (1:1000, Abcam, ab115777), and the secondary antibody used was Goat Anti-Rabbit IgG H&L (1:4000, Abcam, ab150077). Reactive bands were visualized with ECL Plus reagents using LAS-4000 mini.
Quantitative Reverse Transcriptional PCR (qRT-PCR)
Total RNA of clinical specimens was extracted using the E.Z.N.A. Total RNA Kit I (Omega Bio-Tek, USA) according to the protocol. Complementary DNA (cDNA) was synthesized subsequently using the Prime Script RT Reagent Kit (Takara Bio, Japan). Real-time PCR was performed on the CFX96 Touch Real-Time PCR Detection System (Bio-rad, USA) to measure the expression levels of FGFR1 and ESR1 using the comparative Ct method. GAPDH was considered as a normalization control.
Colony Formation Assay
1000 cells/well were seeded in 6-well plates and maintained in standard medium for 2 weeks. Thereafter, colonies of cells were fixed with 4% formaldehyde and stained with 0.1% crystal violet. Colonies with a diameter greater than 1 mm were counted.
Cell Proliferation Assay
Cell counting kit-8 (CCK-8; Beyotime, China) was used to perform a cell proliferation assay. 2000 cells/well were seeded in 96-well plates, and cell proliferation was assessed for 24 h, 48 h, and 72 h. For quantitative analysis, 20µl WST-1 reagent was added to each well and incubated for one h afterward. The absorbance was measured at 490 nm using a microplate reader (BioTek, US).
Cytotoxicity Assay
The dose-response of cell lines to TAM was determined using the CCK-8 method. 2500 cells/well were seeded in 96-well plates and incubated in the presence of TAM for 48 h. The detection method was similar to the cell proliferation assay.
TCGA Data Processing
To validate FGFR1 expression and its effect on clinical outcomes in ER+ breast cancer, gene expression data of breast cancer samples were obtained from TCGA (URL: https://cancergenome.nih.gov/) and annotated by the manifest file. Subsequently, expression data of ER+ breast cancer samples were selected and were merged into an expression matrix. The differential expression analysis was conducted by R package limma (URL: https://www.bioconductor.org/packages/release/bioc/html/limma.html). Survival analysis was performed using R package survival (URL: https://mirrors.tuna.tsinghua.edu.cn/CRAN/src/contrib/survival_3.2-7.tar.gz) and visualized by R package ggplot2 (URL: https://mirrors.tuna.tsinghua.edu.cn/CRAN/src/contrib/ggplot2_3.3.3.tar.gz). For survival analysis, ER+ breast cancer samples were derived into FGFR1 high- and low-expression groups using the median transcript/million (TPM) value as a cut-off.
Statistical Analysis
The associations between FGFR1 protein expression and clinicopathological features were analyzed with a Pearson chi-square test, and Pearson correlation analysis was employed to test the linear correlations between variables. Kaplan-Meier analysis was used to analyze the overall survival (OS), and the Cox regression analysis was performed to estimate prognostic factors of ER-positive breast cancer by measuring risk ratios and 95% confidence intervals (CIs). Paired-sample T-test and one-way ANOVA were used to compare different groups. The value of P < 0.05 was considered to be statistically significant. All statistical analysis was computed by SPSS 17.0 (SPSS Inc., USA).
Results
Associations Between FGFR1 Protein Expression and Clinicopathological Features of ER-Positive Breast Cancer
In the present study, 184 ER-positive breast cancer cases were involved. The disease characteristics of the study population were shown in Table 1, and the representative sections of FGFR1 protein expression detected by IHC were displayed in Figure 1.
Disease Characteristics of the Study Population.a

a Data presented as the mean ± standard deviation or number (% of total number).

Representative sections of FGFR1 protein expression in ER-positive breast cancers.
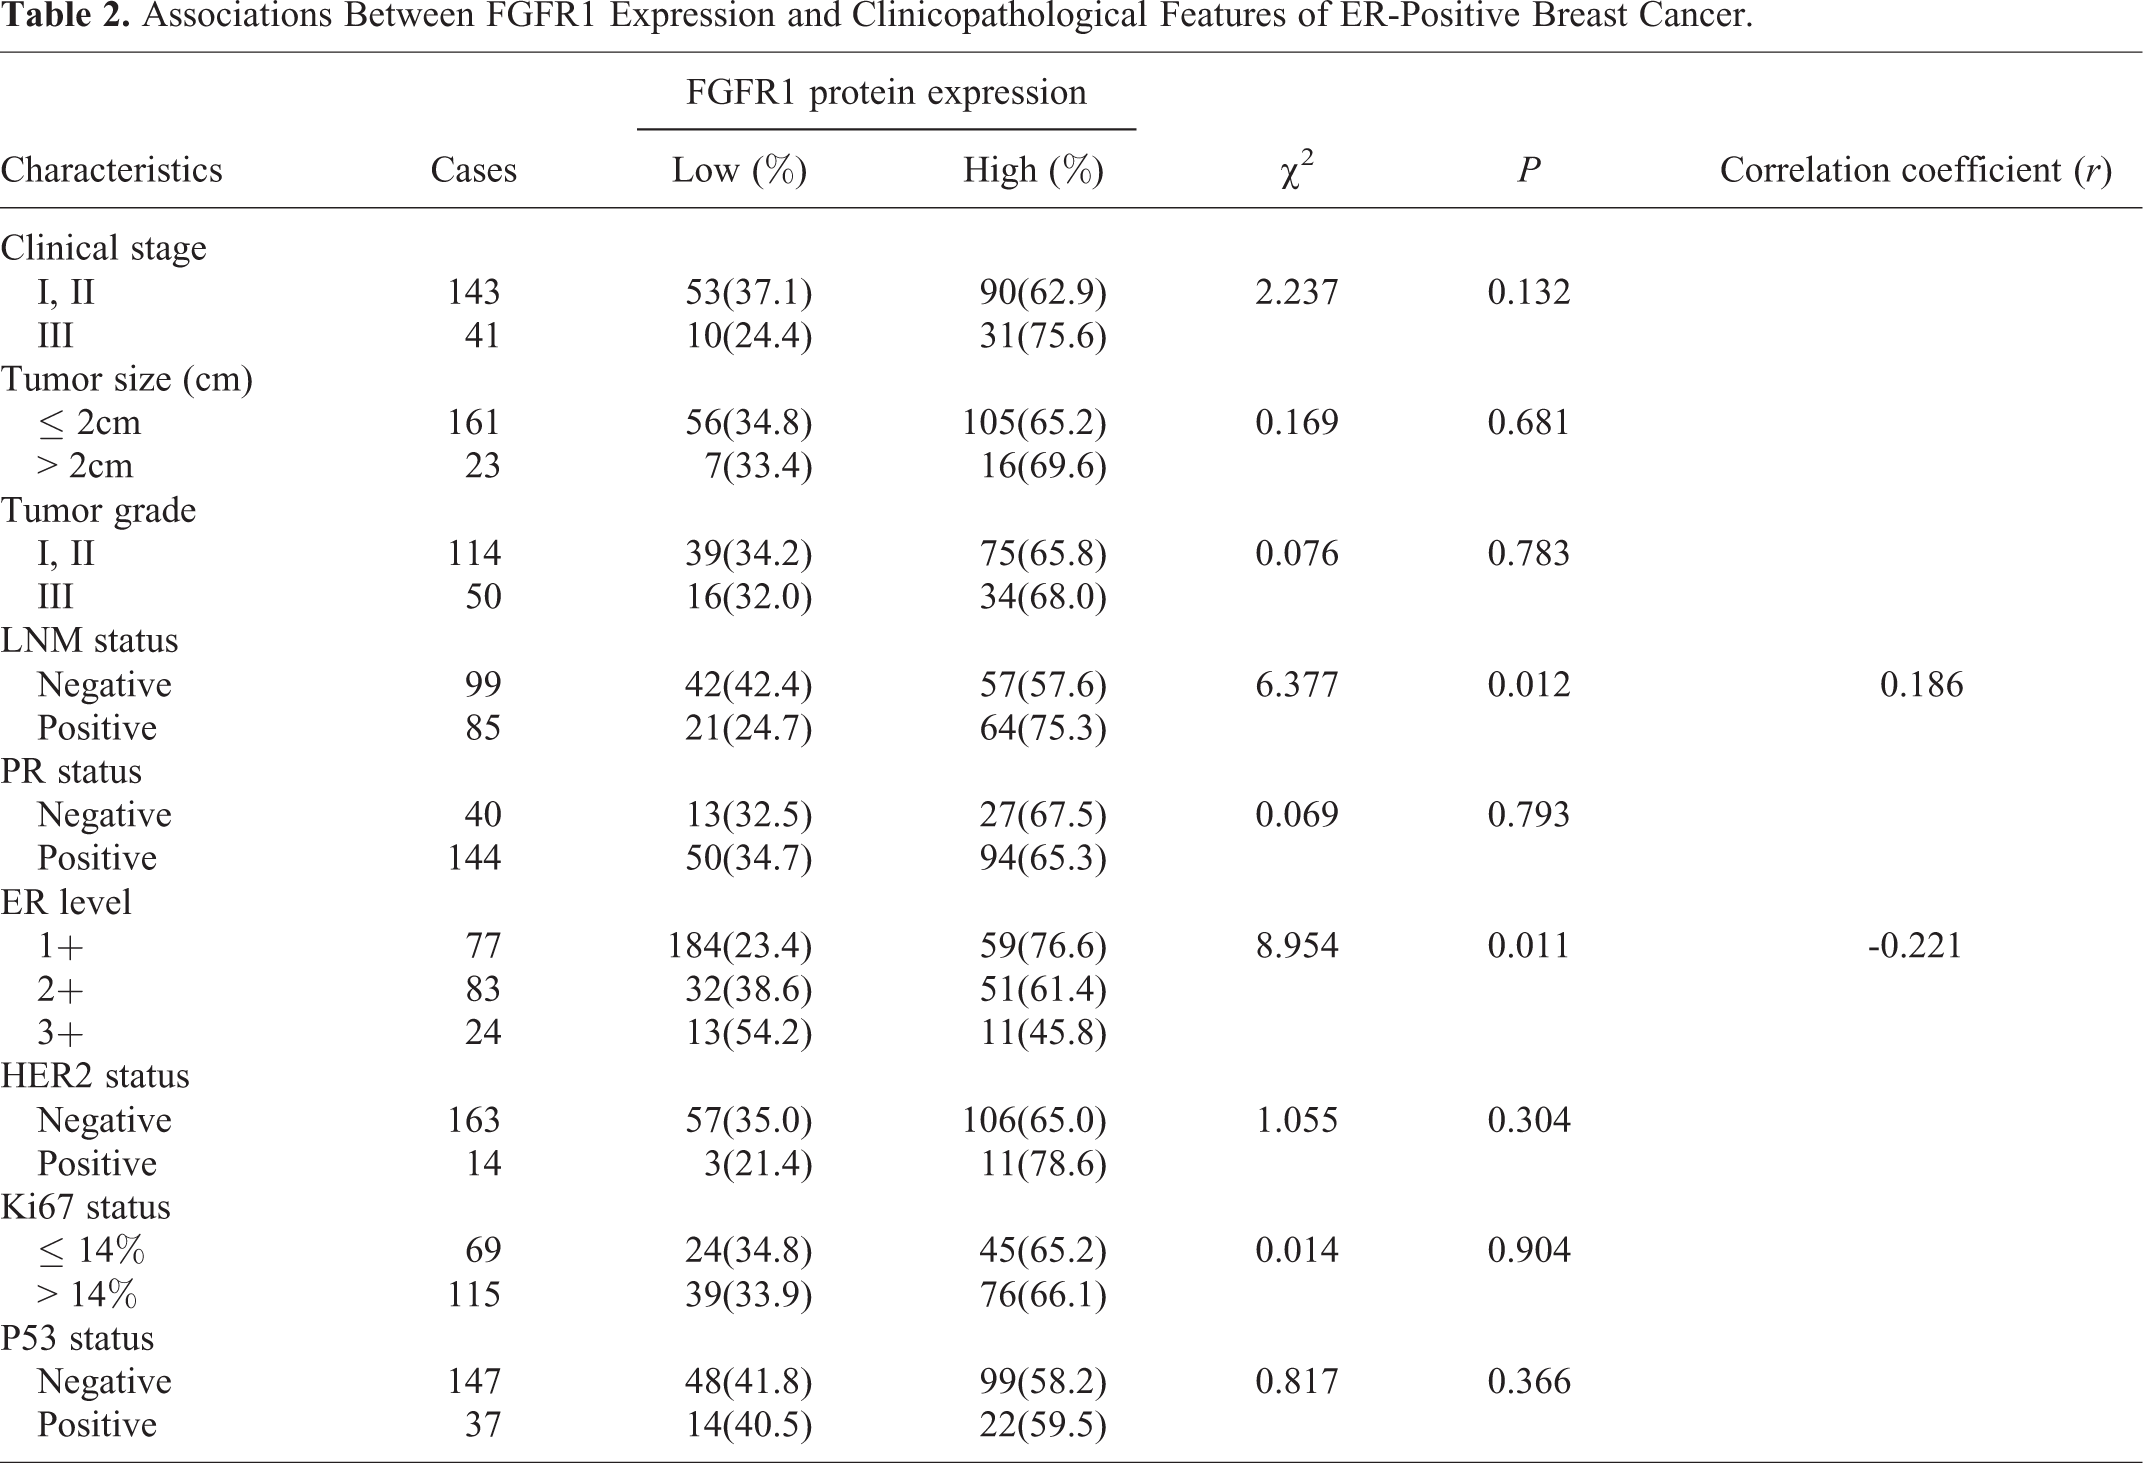
The associations between FGFR1 levels and clinicopathological features among 184 ER-positive breast cancer cases were shown in Table 2. Patients with higher FGFR1 expression were more prone to have lymph node metastasis (P = 0.012), and this positive correlation was confirmed by Pearson correlation analysis (r = 0.186). Moreover, we observed a negative correlation between FGFR1 protein expression and ER levels (P = 0.011, r = -0.221). There was no significant difference between FGFR1 protein expression and other disease characteristics.
Associations Between FGFR1 Expression and Clinicopathological Features of ER-Positive Breast Cancer.
Association of FGFR1 Protein Expression With Prognosis of ER-Positive Breast Cancer
Cox regression analysis was employed to analyze the impact of specific factors on ER-positive breast cancer prognosis, including clinic stage, tumor size, tumorgrade, lymph node metastasis, ER level, and the status of PR, HER2, Ki67, P53 and FGFR1 protein expression (Table 3). The results showed that TNM stage, lymph node metastasis, Ki67 status and FGFR1 expression were significantly correlated with breast cancer outcome under univariate analysis, with risk ratios being 2.172 (95% CI = 1.210-3.898, P = 0.009), 2.078 (95% CI = 1.211-3.565, P = 0.008), 2.509 (95% CI = 1.120-3.785, P = 0.020) and 1.974 (95% CI = 1.043-3.633, P = 0.036), respectively. Moreover, multivariate COX regression analysis showed that lymph node metastasis and Ki67 status were independent prognostic factors of ER-positive breast cancer (OR = 1.744, 95%CI = 1.002-3.034, P = 0.049; OR = 1.882, 95%CI = 1.015-3.491, P = 0.045, respectively).
Prognostic Factors of ER-Positive Breast Cancer in Cox Regression Analysis.

a Under univariate analysis.
b Under multivariate analysis.
According to the Kaplan-Meier analysis of FGFR1 high and low expression groups, patients with high FGFR1 protein expression had a shorter OS (P = 0.036; Figure 2A). This result was confirmed using the TCGA public data (P < 0.001; Figure 2B).

The overall survival rate of FGFR1 high and low expression ER+ breast cancer patients. (A) Kaplan-Meier survival analysis of 184 ER+ breast cancer cases. (B) Kaplan-Meier survival analysis of TCGA public data.
Down-Regulation of FGFR1 Inhibits ER+ Breast Cancer Cell Proliferation
To investigate the effect of FGFR1 expression on ER+ breast cancer, we firstly performed an expression analysis of FGFR1 using TCGA data. According to the results, FGFR1 expression was significantly higher in ER+ breast cancer as compared with that in the normal tissue (Figure 3A).

Down-regulated FGFR1 inhibits ER+ cell proliferation. (A) FGFR1 expression in normal breast tissue and ER+ breast cancer from TCGA. (B) Validation of FGFR1 knock-down in MCF-7 cell line by qRT-PCR. (C) Validation of FGFR1 knock-down in MCF-7 cell line by western blotting. Cell proliferation of MCF-7 is inhibited by FGFR1 knock-down according to the (D) colony formation assay, and (E) CCK-8 assay. (* P < 0.05, ** P < 0.01, *** P < 0.001).
By knocking down FGFR1 expression in ER+ breast cancer cell line MCF-7 (Figure 3B, Figure 3C), we observed the reduced clonogenic ability of MCF-7 cells in the colony formation assay (Figure 3D). Moreover, down-regulating FGFR1 suppressed cell proliferation in ER+ breast cancer as assessed by the CCK-8 method (Figure 3E).
Knocking Down FGFR1 Upregulates ESR1 and Leads to Enhanced TAM Sensitivity
The expression of ESR1 was negatively correlated with that of FGFR1 (P = 0.0012, r = -0.109) in ER+ breast cancer (Figure 4A) according to Pearson correlation analysis, and ESR1 was upregulated when FGFR1 was silenced in MCF-7 cells (Figure 4B).
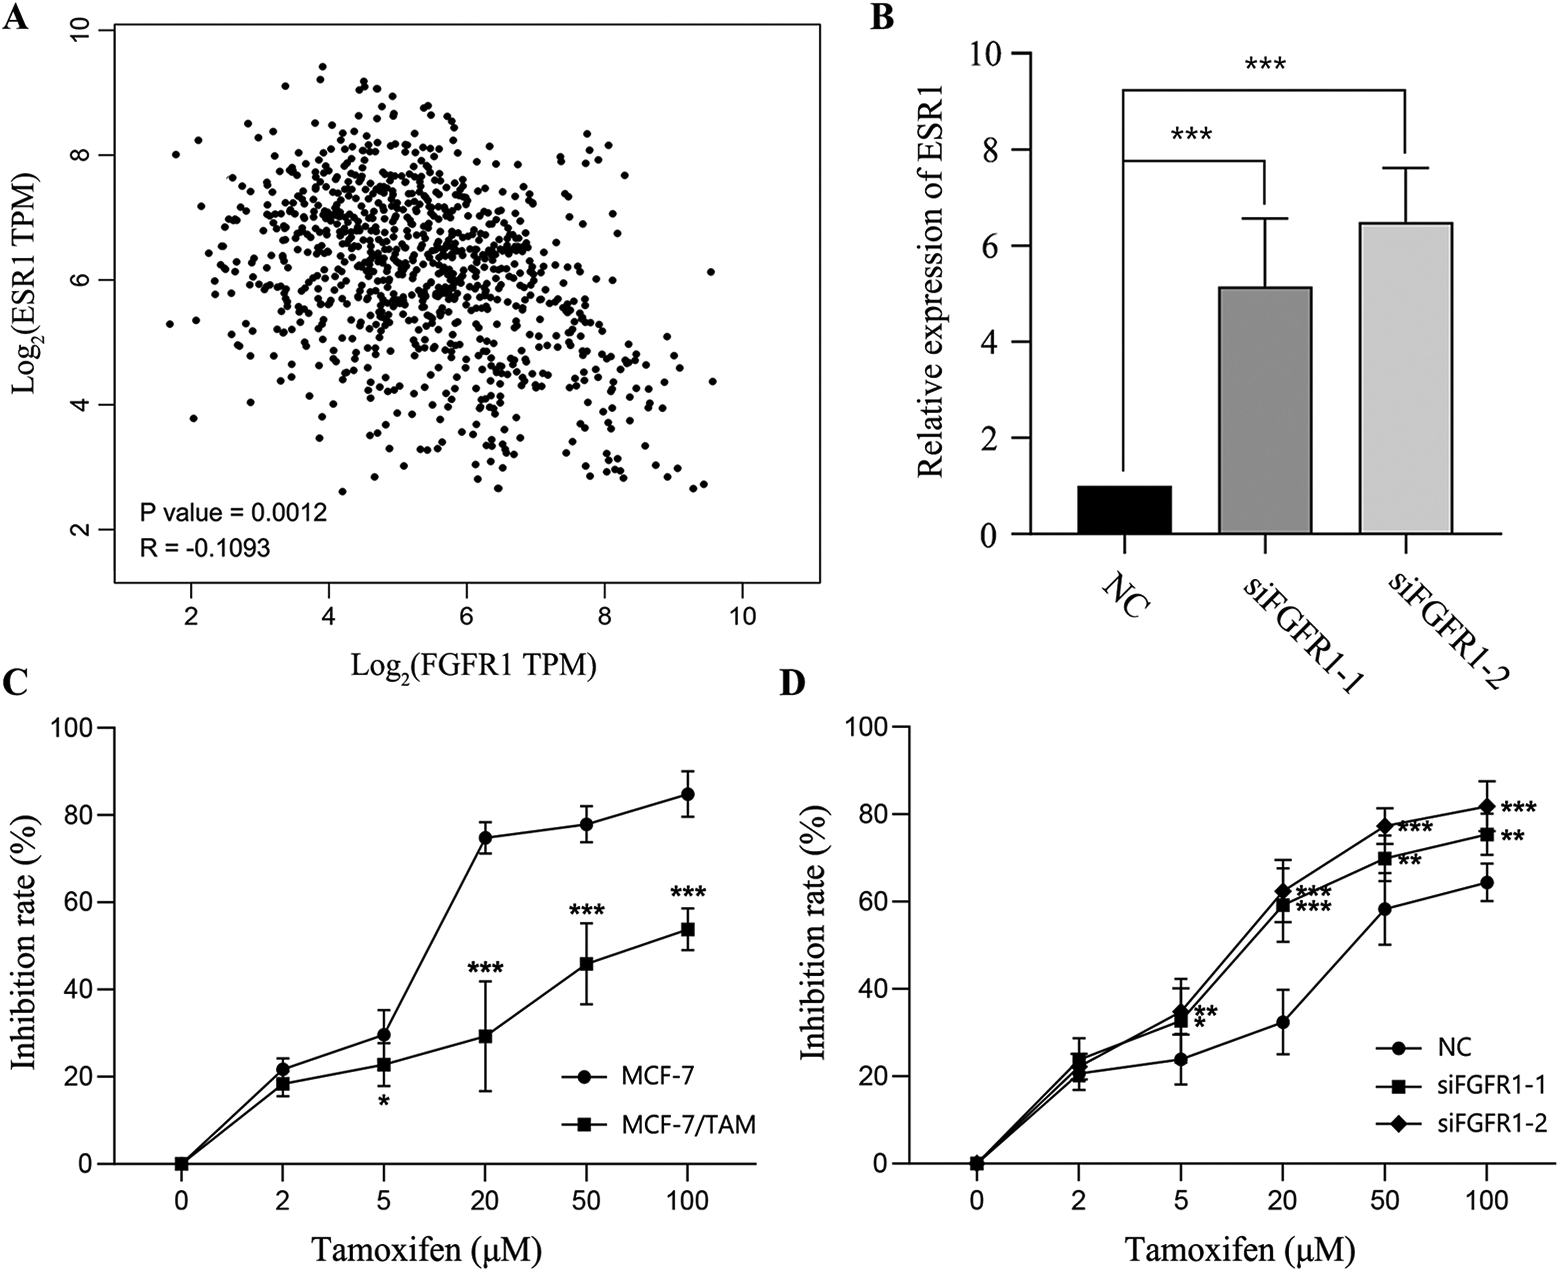
FGFR1 expression is negatively correlated to ESR1 and associated with TAM sensitivity in ER+ breast cancer. (A) The correlation between FGFR1 and ESR1 expression in TCGA samples. (B) FGFR1 knock-down upregulates ESR1 expression. (C) Drug sensitivity test for parental MCF-7 and TAM-resistant MCF-7/TAM cell lines. (D) FGFR1 knock-down enhances TAM sensitivity of MCF-7/TAM cell line. (* P < 0.05, ** P < 0.01, *** P < 0.001).
We established a TAM-resistant MCF-7 (MCF-7/TAM) cell line by culturing MCF-7 cells in the presence of 1μM TAM over 6 months. Cytotoxicity assay confirmed that MCF-7/TAM could tolerate a much higher concentration of TAM as compared with the parental MCF-7 cells (Figure 4C). Furthermore, the TAM sensitivity was enhanced on silencing FGFR1 in MCF-7/TAM cells (Figure 4D). These results indicated the role of FGFR1 in triggering endocrine resistance by down-regulating the expression of estrogen receptors.
Discussion
To investigate the effect of FGFR1 protein expression on ER-positive breast cancer, we examined the expression of FGFR1 among 184 breast cancer cases and statistically analyzed the associations of FGFR1 expression on disease characteristics and prognosis. It was found that patients over-expressing FGFR1 were more likely to have lymph node metastasis, and FGFR1 expression was negatively correlated with ER level. Moreover, FGFR1 was one prognostic factor of ER-positive breast cancer, and high FGFR1 expression was significantly associated with reduced patients’ overall survival. The in vitro assays indicated that FGFR1 down-expression suppressed cell proliferation in ER+ breast cancer cells and was negatively correlated with ESR1 expression.
FGFR1 is located at 8p12, the chromosomal region of which is amplified in various malignancies. FGFR1 amplification is associated with FGFR1 overexpression, which was found in up to 10% of breast cancers. 25 -27 During normal mammary gland development, FGFR1 signaling plays a key role in the maintenance of the stem cell population and promotes the proliferation of mammary epithelium. 28 However, aberrant FGFR1 expression might result in excessive activation of PI3K-AKT and (or) MAPK signalings, which were widely considered to be associated with oncogenesis. 29,30 Currently, accumulating evidence has confirmed the strong effect of FGFR1 amplification on breast cancer prognosis. Turner et al 15 analyzed Guy’s series of 87 ER-positive tumors, all treated with tamoxifen as sole adjuvant therapy, and suggested that FGFR1 amplification and overexpression contributed to poor prognosis in luminal breast cancers and drove anchorage-independent proliferation. Elsheikh et al 14 suggested FGFR1 amplification as an independent prognostic factor of breast cancers. In this study, we confirmed the association between high FGFR1 expression and poor ER-positive breast cancer outcomes.
There has been increasing evidence on the correlation between FGFR1 amplification and endocrine therapy resistance of breast cancers. It was reported that the 2 lesions from a patient carrying bilateral ER+ breast tumors responded differently to anti-estrogen therapy, and FGFR1 amplification was detected in the treatment-refractory tumor, 31 implicating the effect of FGFR1 amplification on endocrine resistance. Moreover, combining brivanib, an FGFR-1/VEGFR-2 kinase inhibitor, with tamoxifen, could potentially maximize the therapeutic efficacy and rescue cells’ sensitivity to endocrine therapy. 32 Yet, the mechanisms of FGFR1 triggered endocrine therapy resistance still remains unclear. Several studies have suggested that FGFR1 signaling could suppress progesterone receptor (PR) expression, 15 and directly compensate for the loss of estrogen signaling through estrogen-dependent or estrogen-independent PI3K-AKT and MAPK activation. 14,15,33 However, relatively little has been focussing on the relationship between FGFR1 expression and ER level. Here, we observed a negative correlation between ER and FGFR1 expression and validated it experimentally in vitro. Moreover, we observed that down-regulating FGFR1 expression could enhance TAM sensitivity of ER+ breast cancer cells, implicative of the contributing role of FGFR1 to endocrine therapy resistance through down-regulating ER expression.
On the other hand, our study has several limitations. Firstly, MCF-7 is the only ER+ cell line we used for in vitro assays since the tamoxifen-resistant cell line MCF-7/TAM was the only one we established successfully. Therefore, further validation in other cell lines is still required. Secondly, according to the results, the correlation between FGFR1 and ESR1 expression is weak in TCGA samples, and the significance of FGFR1 in the multivariate COX regression analysis was marginal. Since these results were validated by the cellular functional assays, we hold the opinion that these findings are credible. Further study should be carried out, involving samples from multicenter, and the sample size should be larger.
Conclusion
The present study confirmed that FGFR1 expression was negatively correlated with that of ER, and high FGFR1 protein expression was associated with poor ER-positive breast cancer outcome via inducing TAM resistance. These findings provide novel insights on FGFR1 triggered endocrine therapy resistance and support the use of FGFR1 inhibitors in the treatment of endocrine-resistant breast cancers.
Footnotes
Abbreviations
Authors’ Note
All procedures performed in studies involving human participants were in accordance with the 1964 Helsinki Declaration and its later amendments or comparable ethical standards. Each patient enrolled in this study has signed informed consent, and this study was approved by the Ethical Committee of the Affiliated Hospital of Jiangnan University (approval No. LS2019046). Qing Lv and Shiming Guan contribute equally to this work.
Declaration of Conflicting Interests
The author(s) declared no potential conflicts of interest with respect to the research, authorship, and/or publication of this article.
Funding
The author(s) received no financial support for the research, authorship, and/or publication of this article.