
Abstract
Purpose:
This study aimed to investigate the parameters with a significant impact on delivery quality assurance (DQA) failure and analyze the planning parameters as possible predictors of DQA failure for helical tomotherapy.
Methods:
In total, 212 patients who passed or failed DQA measurements were retrospectively included in this study. Brain (n = 43), head and neck (n = 37), spinal (n = 12), prostate (n = 36), rectal (n = 36), pelvis (n = 13), cranial spinal irradiation and a treatment field including lymph nodes (n = 24), and other types of cancer (n = 11) were selected. The correlation between DQA results and treatment planning parameters were analyzed using logistic regression analysis. Receiver operating characteristic (ROC) curves, areas under the curves (AUCs), and the Classification and Regression Tree (CART) algorithm were used to analyze treatment planning parameters as possible predictors for DQA failure.
Results:
The AUC for leaf open time (LOT) was 0.70, and its cut-off point was approximately 30%. The ROC curve for the predicted probability calculated when the multivariate variable model was applied showed an AUC of 0.815. We confirmed that total monitor units, total dose, and LOT were significant predictors for DQA failure using the CART.
Conclusions:
The probability of DQA failure was higher when the percentage of LOT below 100 ms was higher than 30%. The percentage of LOT below 100 ms should be considered in the treatment planning process. The findings from this study may assist in the prediction of DQA failure in the future.
Introduction
Pretreatment patient-specific delivery quality assurance (DQA) is essential for the verification of accurate dose delivery in advanced radiation therapy techniques, such as intensity-modulated radiation therapy (IMRT), volumetric modulated arc therapy, stereotactic body radiation therapy, and helical tomotherapy (HT). 1 -4
An HT system is an IMRT delivery system that delivers the radiation beam with a high degree of conformity; it is an image-guided system using megavoltage computed tomography (CT). 5 The radiation beam is delivered using a 6-MV linear accelerator continually while the couch is moving into the gantry, and intensity modulation is achieved with a binary multileaf collimator (MLC). 6 DQA and planning quality for HT are influenced by various planning parameters such as pitch, field width (FW), the modulation factor (MF), and the leaf open time (LOT). 7 Pitch is defined as the couch travel distance for a complete gantry rotation (GR) relative to the axial beam width at the axis of rotation in helical CT. 8 FW is defined as the longitudinal width of the beam at the central axis. Finally, MF is defined as the ratio of the maximal LOT to the mean (non-zero) LOT. 9
Several studies have presented the optimal planning parameters between pitch, FW, and MF to maintain the optimal plan quality and treatment time for clinical cases using HT, and they have studied the correlation between planning parameters and DQA results. 9 -18 However, to the best of our knowledge, there is no published report using comprehensive statistical analyses such as logistic regression, receiver operating characteristic (ROC) curves, and the Classification and Regression Tree (CART) algorithm for the impact of the various planning parameters on DQA failure, to date.
This study aimed to investigate the parameters with a significant impact on DQA failure and to analyze the planning parameters as possible predictors of DQA failure for HT.
Methods
Patient Selection and Characteristics
In total, 212 patients who had passing or failing DQA measurements were randomly selected for inclusion in this retrospective study (Table 1). All selected patients were treated with Tomotherapy (TomoHDA, Accuray; Sunnyvale, CA, USA) in our institution.
Average Values for the Treatment Planning Parameters Used in This Study.

Abbreviations: MF, modulation factor; SD, standard deviation; LOT, the percentage of leaf open time below 100 ms. Large field, cranial spinal irradiation field or treatment fields with lymph nodes.
Patient-Specific DQA in HT
Treatment planning for all patients was performed using the HT planning station (Accuray). The convolution/superposition algorithm was used for dose calculation, and a fine dose-calculation grid size (0.195 × 0.195 cm2) was employed in all the DQA plans. To generate the DQA plan, a cheese phantom was selected for all treatment plans. The center of the Exradin A1SL ionization chamber (Standard Imaging, Middleton, WI) positioned in the cylindrical Solid WaterTM phantom (“Cheese phantom,” Accuray) was moved to the low-dose gradient region or target point. A red laser was placed at the center of the ionization chamber, and the doses were calculated. We used a cheese phantom with an ionization chamber and Gafchromic EBT3 film (International Specialty Products, Wayne, NJ) to measure the absolute dose and gamma values for all HT plans. 19 The differences between the calculated and measured point doses and dose distributions were computed using tomotherapy DQA software (Accuracy). 19 The point dose difference (DD) and global gamma passing rate (GPR) for all patients were analyzed. The threshold for analysis was set at 10% of the global maximum. The tolerance range of DD was within ±5% and that of GPR was > 90% based on the criteria of 3%/3 mm. If one criterion failed, then DQA was considered to have failed. 19
Analysis of Planning Parameters
In this study, various treatment planning parameters were analyzed in 8 clinical cases. Additionally, the mean and standard deviation (SD) of individual parameters were evaluated based on DQA failure. Finally, the proportion of LOT below 100 ms was assessed.
Logistic Regression Analysis
The correlation between DQA results and the treatment planning parameters were analyzed using an Akaike information criterion stepwise logistic regression. Logistic regression analysis was used to conduct univariate and multivariate analyses to determine the correlation between DQA failure and treatment planning parameters. ROC analysis and areas under the curves (AUCs) were used to identify the sensitivity and specificity of treatment planning parameters cut-off points for the prediction of DQA failure. The optimal cut-off points were defined as the value that maximizes the sum of sensitivity and specificity using the Youden index (J = sensitivity + specificity−1). 20
ROC curves were used to evaluate treatment planning parameters as possible predictors for DQA failure. The higher the AUC, the better the model was considered to be in distinguishing between DQA failure and treatment planning parameters. An AUC of 0.5 meant no discrimination above chance and an AUC of 1.0 indicated perfect discrimination. Generally, AUCs of 0.9-1.0, 0.8-0.9, 0.7-0.8, and 0.6-0.7 indicated excellent, very good, good, and poor discrimination, respectively. 21 All statistical analyses were performed using the R software package (v.3.4.3, R Foundation; Vienna, Austria). A p-value of <0.05 was considered statistically significant.
Classification and Regression Tree
CART was used to derive decision rules to predict DQA failure from various treatment planning parameters. Fifteen treatment planning parameters were considered as predictor variables and DQA failure was considered as the predictive variable. Since the number of cases of DQA failure was small (21 cases), the number of failures was increased by 3 times using the bootstrapping method. The importance of a variable was determined using CART for a comprehensive understanding of the influence of different variables (treatment planning parameters) on DQA failure. The variable importance scores were calculated within the CART method using the improvement measure attributable to each variable in its role as a surrogate to the primary split. The values of these improvements are summed over each node and the nodes were then summed together. Then, they were scaled relative to the best performing variable. The variable with the highest sum of improvement was scored 100, and all other variables had decreasingly lower scores. All statistical analyses were performed using Minitab (v18, Minitab; State College, PA).
Results
Analysis of Treatment Planning Parameters and DQA Results
Treatment planning parameters for the 212 patients included are summarized in Table 1. These included patients with brain (n = 43), head and neck (H&N) (n = 37), spinal (n = 12), prostate (n = 36), rectal (n = 36), pelvis (n = 13), cranial spinal irradiation and treatment field including lymph nodes (n = 24), and other (n = 11) cancers. Table 1 shows the patient characteristics for various cases and characteristics of planning parameters such as prescription dose, FW, pitch, MF, LOT, and treatment time. There were 191 (90.1%) and 21 (9.9%) patients who had passing and failing DQA measurements, respectively (Table 2). The average DD and GPR in the passing and failing groups were 1.24% and 94.9%, and 1.4% and 84.5%, respectively (Table 2).
Summary of the Treatment Planning Parameters in the Passing and Failing Delivery Quality Assurance Groups.

Abbreviation: FW, field width; MF, modulation factor; GR, gantry rotations; GP, gantry periods; MUs, monitor units; LOT, the percentage of leaf open time below 100 ms; DD, dose difference; GPR, gamma passing rate; SD, standard deviation.
Correlation Between DQA Failure and Treatment Planning Parameters
In the univariate analysis, we found that the total number of fractions, total dose, FW, GR, treatment time, couch travel, total monitor units (MUs), and LOT were significantly related to DQA failure (Table 3). Significant correlations were seen for the total dose (p < 0.003), total MUs (p < 0.040), and LOT (p < 0.001) when multivariate analysis was performed including significant parameters from the univariate analysis (Table 3). As shown in Table 4, the AUCs ranged from 0.52-0.74 for all parameters. The cut-off point was determined as the corresponding value (>0.7) of the AUC value of each parameter. An AUC greater than 0.7 means acceptable discrimination. The AUCs for couch travel, total dose, and LOT were 0.74, 0.71, and 0.70, respectively. The cut-off points for couch travel, total dose, and LOT were 20.15 cm, 4170 cGy, and 29.67%, respectively. When these cut-off values were exceeded, the probability of DQA failure increased. Figure 1 shows the ROC curve for the predicted probability calculated when the multivariate variable model was applied, and the AUC value was 0.82. We confirmed that total dose, couch travel, and LOT were significant predictors of DQA failure. The significant scores were plotted against the variables for treatment planning in Figure 2; the 3 most significant variables were total MUs, total dose, and LOT.
Univariate and Multivariate Logistic Regression Analysis of the Factors Associated With Delivery Quality Assurance Results.

Abbreviation: SD, standard deviation; OR, odds ratio; LB, lower bound; UB, upper bound; FW, field width; MF, modulation factor; GR, gantry rotations; GP, gantry periods; MUs, monitor units; LOT, the percentage of leaf open time below 100 ms. *Indicates a statistically significant difference.
Areas Under the Curve (AUCs) and Cut-Off Point for Each Treatment Parameter.

Abbreviation: AUC, area under the curve; MF, modulation factor; GR, gantry rotations; GP, gantry periods; MUs, monitor units; LOT, the percentage of leaf open time below 100 ms. *AUC greater than 0.7 means acceptable discrimination.

Receiver operating characteristic (ROC) curve and area under the curve (AUC) for multivariate analysis.

Variable importance of parameters influencing delivery quality assurance (DQA) failure. CART (Classification and Regression Tree) was used to identify variable importance. Fifteen parameters were considered as predictor variables and DQA failure as the predictive variable. The total monitor units was determined to be the most important variable (100%), followed by total dose (73.6%) and leaf open time (72.8%).
Summary of the Significant Variables for DQA Failure in Clinical Cases
The total dose, total MUs, and the percentage of LOT less than 100 ms were significantly associated with DQA failure in both multivariate (Table 3) and CART analysis (Figure 2). The total dose, couch travel, and LOT were significant parameters of DQA failure as shown in Table 4. Therefore, the results of each clinical case are described with a focus on the parameters mentioned above in Table 5.
Summary of the Important Variables for Delivery Quality Assurance Failure in Clinical Cases.
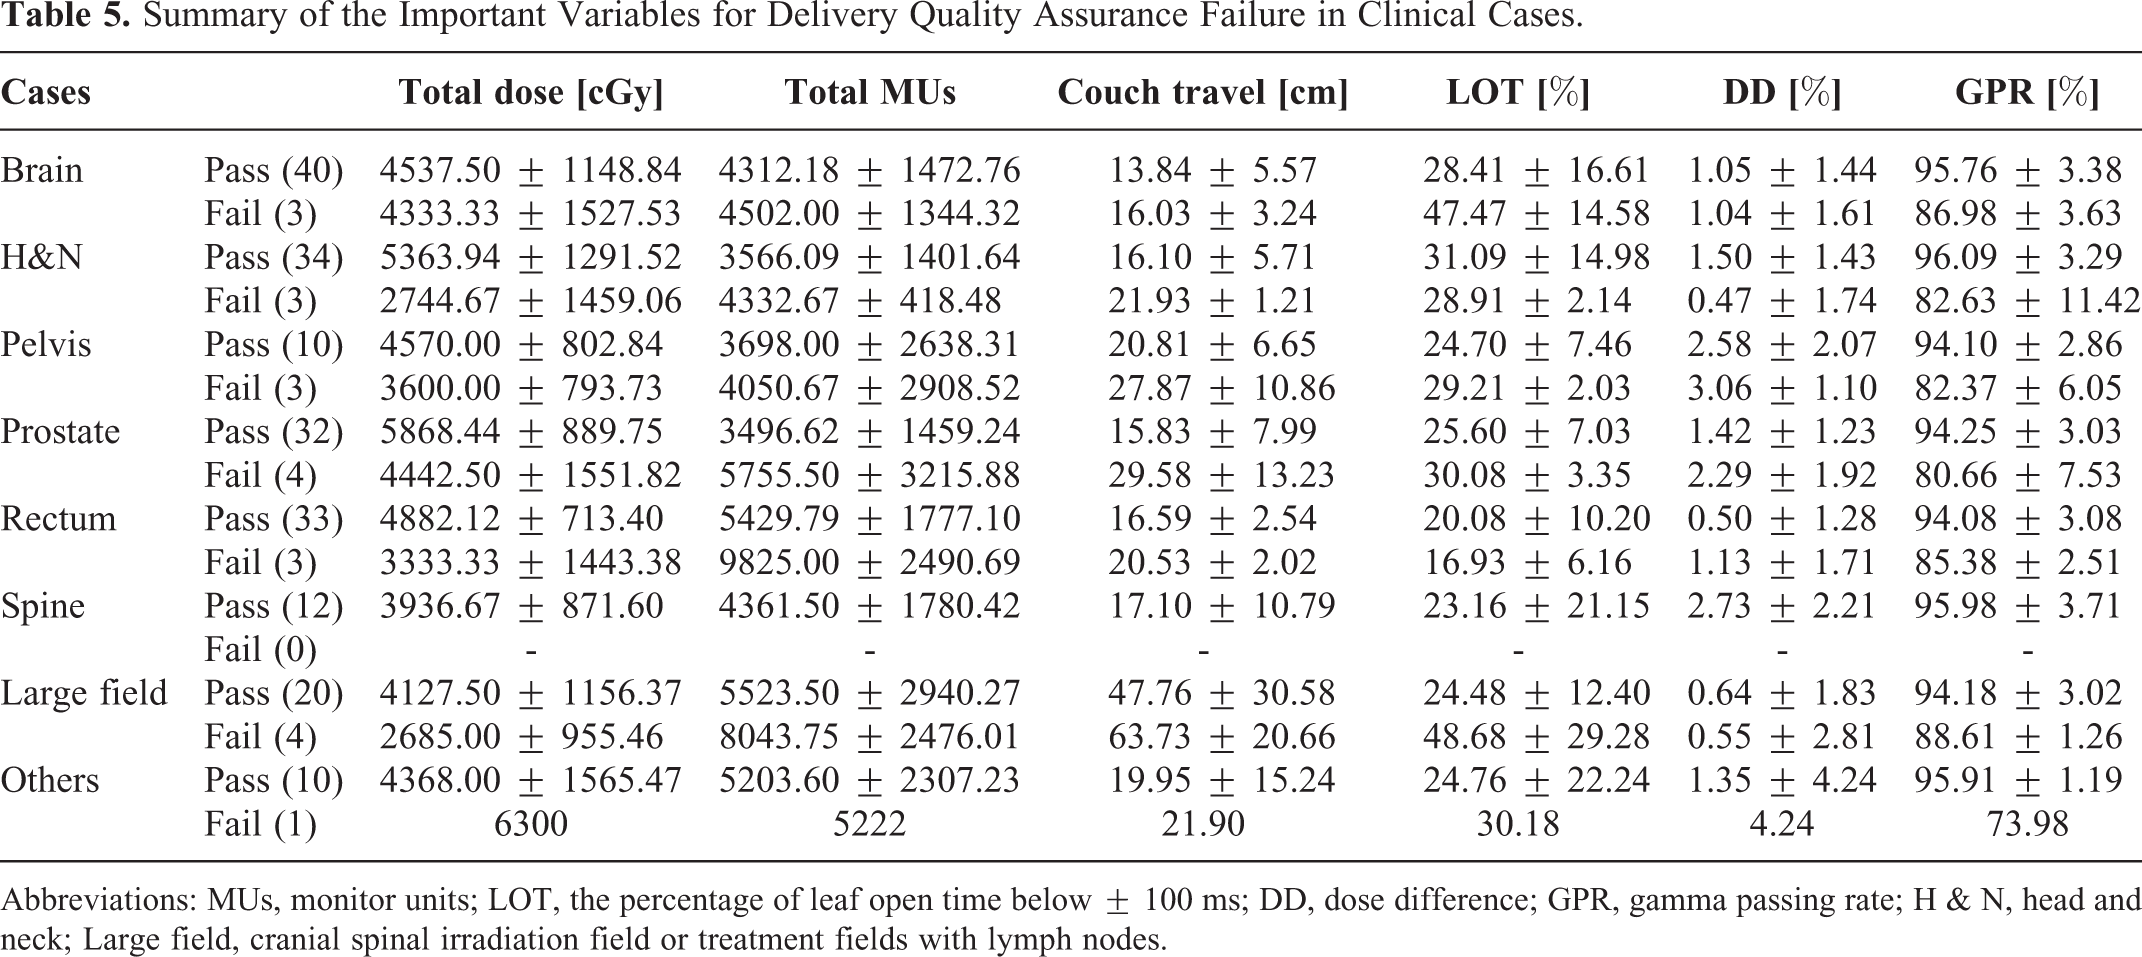
Abbreviations: MUs, monitor units; LOT, the percentage of leaf open time below ± 100 ms; DD, dose difference; GPR, gamma passing rate; H & N, head and neck; Large field, cranial spinal irradiation field or treatment fields with lymph nodes.
Table 5 shows the results of the 4 significant variables (total dose, total MUs, couch travel, and LOT) for DQA failure in various clinical cases. Total dose was lower in cases involving DQA failure than in cases that passed DQA. However, the total MUs and dose were higher in cases involving DQA failure than in cases that passed DQA. DQA failure occurred in cases with a relatively large couch travel value (i.e., in those with a large or long target size). Among all cases, the proportion of cases with LOT below 100 ms in the failure group was higher than that in the passing group, with the exception of H&N and rectal cancer cases. In these groups, the proportion was greater than 30%.
Discussion
In this study, we analyzed the correlation between treatment planning parameters and the DQA measures based on HT DQA results. We determined that the probability of DQA failure was higher when the proportion of LOT less than 100 ms was higher than approximately 30%. Additionally, in the ROC analysis, we presented the sensitivity values of the optimized plan parameters at each treatment site. Therefore, we presented the results for each planning parameter to reduce the rate of DQA failure. With reference to these results, the values are given so that the planning parameters can be considered prior to treatment to reduce DQA failure. Since there are various treatment planning parameters in Tomotherapy, it is time-consuming and labor-intensive to use routine clinical practice to determine new treatment plans and DQA measurements to change these planning parameters. Although it is difficult to use statistical analysis in routine clinical practice, the planners or dosimetrists can predict the DQA results according to the treatment planning parameters in advance.
Binny et al. investigated the DD and GPR value in cases of brain, H&N, and pelvic cancer. 18 They found that the DD and GPR values in the brain, H&N, and pelvic cases were 0.01 ± 1.04% and 95.94 ± 2.70%, 1.21 ± 1.43% and 96.30 ± 3.06%, and 0.44 ± 0.88% and 95.35 ± 2.99%, respectively. As shown in Table 5, the DD results for the passing group ranged from 0.3% (H&N) to 2.0% (pelvis) from a previously reported study, whereas the GPRs in passing groups were consistent with the results. However, in the previous paper, there was no data for failure cases. Therefore, we did not compare and evaluate the DQA failure cases with this study. 18
In this study, the proportion of cases with LOT below 100 ms was assessed in the passing and failing groups. The average LOT in the passing and failing groups were 25.85 ± 14.19% and 33.94 ± 16.77%, respectively (Table 2). As mentioned above, Accuray recommends that the percentage of LOT below 100 ms is maintained at less than 30% due to the risk of increased MLC errors. 16 We showed that the AUC of LOT was approximately 0.7; this represented acceptable discrimination between the AUC and DQA failure, and its cut-off point was approximately 30% as shown in Table 4. When the proportion was higher than this value, it was confirmed that DQA failure increased. This study is the first to investigate the correlation between DQA failure and treatment planning parameters using ROC curves and AUC values.
Westerly et al. showed that plans with small mean open times increased the rates of DQA failure among 6 patients. When the mean LOT was increased from 29.8% to 83.1% relative to the initial plans, DDs were reduced by approximately 2-4.4% for re-planned plans. They explained that the impact of small LOTs should be considered since LOTs less than 100 ms are not accounted for in radiation treatment planning. 13 Conversely, Binny et al. reported that the proportion of LOT below 100 ms was more than 30% for all cases. For brain cases, the LOT value (53.89 ± 9.25%) was the highest; it was approximately 20% higher than that among the H & N and pelvis cases. Binny et al. also found that there was no correlation between LOT and DD or gamma value. They described that the LOT was determined at the maximum MF, and the brain cases involved a complicated treatment site; a pitch of 0.287 was thus used to reduce the thread effect. However, they also described that it is necessary to reduce the percentage of LOT to <100 ms to improve the efficiency of treatment delivery. 18 We showed that the proportion of LOT below 100 ms in the passing group was higher than that in the failing group for H&N and rectal cases, as shown in Table 5. This result opposed the findings acquired using statistical analysis in this study. It has been explained that DQA failure could be determined using other treatment planning parameters such as target volume, couch travel, MU, or treatment time. 14 In the future, it is necessary to investigate the contributing weights of each treatment planning parameter in DQA failure. Additionally, an analysis including more DQA failure cases should be conducted to improve the accuracy of prediction for DQA failure.
Westerly et al. recommended the proper pitch value be selected so that GP is at least 15 s to reduce the impact of inaccuracies of MLC. This could improve the efficiency of the treatment delivery as well as reduce the delivery time. 13 It was confirmed that the average GP values in various clinical cases were greater than 15 s. 18 In the current study, we also found that the GP values were above 15 s regardless of the passing or failing DQA cases. We found that GP values were not a significant factor that affected DQA failure, since the average GP values in the passing and failing groups were >15 s.
The FW, GR, and treatment time were correlated with DQA failure in the univariate analysis, but they were not correlated in the multivariate analysis. In this study, we found that DQA failure was correlated with LOT, couch travel, total dose, and total MUs in the univariate and multivariate analyses as shown in Tables 3 and 4. Couch travel is related to irradiation length. The MLC inaccuracies, such as tongue and groove/penumbra effect and MLC leaf latencies, 13 can be greater with increasing number of individual leaf behavior to open and close the leaf to modulate the beam in the treatment field. 22 In addition, the thread effect due to the helical field junction is increased. An increased number of MUs results in increased leakage radiation. 23 These various uncertainties can lower the GPR within the measurement area. 9 We confirmed that the total dose was relatively smaller in the failure cases than in the passing cases. And it was confirmed that DQA failure decreased as the total dose increased as shown in the odds ratio value (0.999) of univariate and multivariate analysis (Table 3). Also, we confirmed that the total dose was small, the fractional dose was high, and the couch travel was long for failure cases. As a result, as treatment time increases, the MU also increases, and it is assumed that DQA failure eventually occurs. Therefore, it cannot be determined whether a single parameter has an effect on DQA failure, and we assumed that various factors work in combination and affect DQA failure. We are currently collecting patient data to analyze this issue. In addition, Binny et al. showed that factors contributing to gantry speed are MF, pitch, and FW. MF, pitch, and FW can be set by the planner; however, the actual MF, projections, and LOT are largely determined by the optimization technique. Therefore, it is important to collect and analyze treatment parameter outcomes based on DQA for each treatment site to make informed decisions for user-controlled parameters specific to each treatment region. 18 Figure 1 shows the ROC curve for the predicted probability calculated when the multivariate variable model was applied, and the AUC value was 0.82. We confirmed that total dose, couch travel, and LOT were significant predictors of DQA failure. The significant scores were plotted against the variables for treatment planning as shown in Figure 2. The relative importance score suggests that total MUs has the most significant impact on DQA failure. In addition, total dose, LOT, and treatment time among 15 treatment planning parameters were important factors. Thus, when we comprehensively analyze the results of Figures 1 and 2, we believe that LOT and total dose were the most important factors for DQA failure. The LOT and total dose factors were consistent with the results in work by previous reports. 14,18 Since total dose and couch travel are parameters that were determined by the physicians before the treatment planning process, both parameters are factors that the planner cannot change in the treatment planning process. Conversely, among the 3 parameters influencing DQA failure, LOT is the only parameter that could be changed in the treatment planning process, although planners require re-optimization to change the LOT value. Therefore, to reduce the probability of DQA failure, it is necessary to maintain the percentage of LOT below 100 ms to be less than 30%. No other studies have used logistic regression, ROC, AUC, or CART analyses for the investigation of DQA failure for HT. Therefore, although it is difficult to directly compare these results with previous studies, it was found that, as was similar to the findings from previous studies, the parameter affecting DQA failure is LOT. 13,14,18
HT plans are quite complicated because there are various planning parameters and each parameter affects other parameters. Therefore, planners or dosimetrists need to understand the impact and relevance of various parameters when creating a plan. Although it is difficult to routinely apply these methods to all cases in clinical practice due to the small number of DQA failures, we suggest that our planning guideline acquired through statistical analysis could assist in devising treatment plans by referring to Tables 4 and 5.
This study has some limitations inherent in retrospective studies. First, in this study, all DQA measurements were taken using EBT3 film and the effect of the scanner light may have introduced sources of various uncertainties, including warming of the scanner lamp, film homogeneity, scan-to-scan stability, long-term stability of the scanner, light scattering, film calibration, phantom setup, measurement position, and human errors. These uncertainties may contribute to decreases in the accuracy of DQA. 24,25 Second, the number of failing cases (n = 21) was only approximately 1/10 of the number of passing cases. Since there were only a few DQA failure cases, determining the parameters affecting DQA failure was difficult, and the statistical accuracy of the predictors may be decreased. To overcome this problem, the numbers of DQA failure cases was increased by using randomly selected bootstrapped samples for CART analysis. In this analysis, it was confirmed that the variables affecting DQA failure were similar to those variables (total dose, total MUs, and LOT) acquired using the logistic regression (multivariate analysis), AUC, ROC, and CART analysis methods (Figure 2, Tables 3 and 4). However, to predict the risk of DQA failure in treatment planning procedures or without re-measurement of DQA, the prediction accuracy should be improved by increasing the number of included cases. Finally, the correlation between treatment planning parameters and the DQA failure pattern was not verified with the acquired statistical model. This requires further validation in a study with a larger number of enrolled patients. Moreover, the use of artificial intelligence or a machine-learning model might improve the accuracy of DQA by accurately and quickly analyzing large numbers of HT plans and a more considerable amount of DQA data. This requires further investigation in a future study.
Conclusion
We confirmed that the probability of DQA failure was higher when the proportion of LOT below 100 ms was greater than 30%. Based on the findings from this study, it is evident that planners should consider the proportion of LOT below 100 ms when they create treatment plans. Although it is difficult to use statistical analysis in routine clinical practice, our findings may contribute to the prediction of DQA failure in advance.
Footnotes
Acknowledgments
We thank the anonymous reviewers whose insightful comments and suggestions helped improve and clarify this manuscript.
Ethical Statement
Our study did not require an ethical board approval because it did not contain human or animal trials.
Declaration of Conflicting Interests
The author(s) declared no potential conflicts of interest with respect to the research, authorship, and/or publication of this article.
Funding
The author(s) disclosed receipt of the following financial support for the research, authorship, and/or publication of this article: This work was supported by the National Research Foundation of Korea (NRF) grant funded by the Korea government (MSIT and ICT) and ICT (No. NRF-2017M2A2A6A01071189 and MSIT No. NRF-2020R1C1C1005713).