
Abstract
To explore the role and mechanism of CERS1 in hypophysoma and investigate whether CERS1 overexpression can change the autophagy process of hypophysoma, and then to explore whether CERS1’s effect was regulated by the PI3K/AKT signaling pathway. Western blot and RT-PCR were used to analyze the expression or mRNA level of CERS1 at different tissues or cell lines. Afterwards, the occurrence and development of hypophysoma in vivo and in vitro, respectively, was observed by using CERS1 overexpression by lentivirus. Finally, MK-2206 and LY294002 were applied to discuss whether the role of CERS1 was regulated by the PI3K/AKT signaling pathway. Results show that the CERS1 expression and mRNA level in tumor or AtT-20 cells were decreased. CERS1 over-expressed by lentivirus could inhibit hypophysoma development in vivo and in vitro by reducing tumor volume and weight, weakening tumor proliferation and invasion, and enhancing apoptosis. In addition, shCERS1 could reverse the process. The above results indicate that CERS1 is possibly able to enhance autophagy in hypophysoma through the PI3K/AKT signaling pathway.
Introduction
Originating from pituitary gland cells, better known as hypophysoma, is a common intracranial tumor, the incidence of which accounts for 10% of all nervous system tumors, second only to glioma and meningioma. Hypophysoma can be classified into the following types: Growth hormone (GH), adrenocorticotropic hormone (ACTH), thyroid stimulating hormone (TSH), gonadal hormone (GnH) and prolactin hormone (PRL). 1 Due to the limited intracranial volume and capacity, pathological signs of hypophysoma include local compression and disorders in pituitary function, resulting in clinical symptoms such as visual field deficit, vision change, hypothalamus dysfunction, intracranial hypertension, and systemic metabolic disorders. 2
Although resection surgery is one of the most effective ways to treat hypophysoma and the cure rate is 80% when combination with a of multiple treatments in need. 3 Despite its more ideal clinical effect, radiotherapy will also inevitably leads to radiation-induced brain edema, causing hypopituitarism, intracranial nerve damage, and radiation encephalopathy. 4 With the deepening development and research of molecular biotechnology, cell biology, genetics, endocrinology, immunology, and oncology, more scholars tend to focus on the pathogenesis of hypophysoma and the treatment of target genes, which has gradually become a research interest of clinical workers. AtT-20 cells were used to the cell line of hypophysoma, which can process some preproteins, such as proopiomelanocortin or proinsulin, and release of the mature hormone is controlled in these cells by secretagogues. 5
In the family of Ceramide Synthases (CERSs), 6 isoforms (CERS1-6) have been found, where CERS1 is mainly located in the endoplasmic reticulum (ER) membranes. As one of the biological enzymes necessary for the synthesis of ceramide, CERS1 mainly regulates C18-ceramide and C20-ceramide and is involved in a variety of physiological functions including skin barrier formation, myelin maintenance, immunity, vascular stabilization, bacterial identification, insulin resistance, sperm production, and hearing. 6 -8 Ceramides of a particular structure can trigger apoptosis and cell death, while other ceramides can inhibit apoptosis. Ceramides of different structures, thus, can perform different biological functions in different environments, which explains the various biological effects of CERSs. The gene mutation of CERS1 will lead to the loss of CerS1 activity in mice, thus triggering cerebellar ataxia and lipofuscin accumulation. 9 Recent studies suggest that CERS1 overexpression can lead to growth inhibition of tumor cells. 10 -12 Faced with severe stress or irreparable situations, ER stress and unfolded protein response (UPR) can lead to cell death and autophagy, which is an important mechanism for inhibiting tumor development. 13 In hypophysoma, the relationship between CERS1 and tumor autophagy has not been thoroughly studied yet. PI3K/AKT signaling pathway is an important signaling pathway for tumor occurrence and development, with a significant biological effect. Scientists have found that the PI3K/AKT signaling pathway is central in the development of cancers and is related to CERS1. 14,15 Thus, we hypothesized that CERS1 might have tumor-regulation effects through the PI3K/AKT signaling pathway.
In this study, we focused on the role of CERS1 in hypophysoma and used CERS1 over-expression by lentivirus to boost or block autophagy progress and tumor development. Furthermore, we also used LY294002 and MK-2206 2HCL to reduce CERS1 expression and inhibit the progress of autophagy in vivo and in vitro. Our findings indicate that CERS1 is possibly able to enhance autophagy in hypophysoma through the PI3K/AKT signaling pathway. These results may provide a new strategy to hypophysoma development by autophagy.
Materials and Methods
Human Hypophysoma Specimens
This original study selected 42 patients pathologically diagnosed as hypophysoma by neurosurgery in our hospital from March 2018 to March 2019 and took tissue around the tumor as para-tumor tissue in 17 of the 42 cases mentioned before (Table 1 lists details of the basic information of patients). All human tissues used in this study were cared for in strict accordance with the World Medical Association (Declaration of Helsinki) ethical principles for medical research involving human subjects (JAMA Publication No. 20, revised 2013). All experimental procedures were approved by the Human Ethics Committee of Affiliated Hospital of Hebei University of Engineering (approval number: KS-03-2017-231), and informed consent was obtained from each subject.
Basic Information of Patients.

Animals
200 2d or 4-week-old healthy male Balb/c mice, which were supplied by Charles River, were housed in a temperature- and light-controlled environment under pathogen free condition and provided unlimited access to food and water: 12/12 hours light/dark with humidity 60 ± 5% and temperature 22 ± 3 °C. 11 All animals used in this experiment were cared for in strict accordance with the Declaration of Helsinki. Measures were taken to minimize animal suffering. All experimental procedures were approved by Animal Ethics Committee of Affiliated Hospital of Hebei University of Engineering.
Reagents and Antibodies
The reagents and antibodies used in this study were: LY294002 (S1105, Selleck, Texas, USA); MK-2206 2HCL (S1105, Selleck, Texas, USA); TUNEL reaction solution (ab66108, abcam, Cambridge, UK); MDC kits (G0170, Solarbio, Beijing, China); RPMI-1640(A4192301, ThermoFisher Scientific, MA, USA); PI3 K antibody (CST, #4257S, Danvers, USA); p-PI3 K antibody (CST, #17366S, Danvers, USA); AKT antibody (CST, #2920S, Danvers, USA); p-AKT antibody (abcam, ab8805, Cambridge, USA); CERS1 antibody (abcam, ab98062, Cambridge, USA); Beclin-1 antibody (abcam, ab207612, Cambridge, USA); LC3 antibody (abcam, ab48394, Cambridge, USA); β-actin antibody (Boster, BA2305, Wuhan, China).
AtT-20 Cells and Astrocyte Medium
AtT-20 cells were purchased from BlueBIOTM (BFN250020, Shanghai, China). After the supernatant was discarded, the cells were cultured in RPMI-1640 medium with 10% FBS and then digested by Trypsin. 16 When the cells became round and exfoliated, as seen under the microscope, we neutralized Trypsin with complete medium, collected cytoplasm, discarded the supernatant after 5 minutes of centrifugation at 1000 rpm, and seeded cells after resuspension. 16
First, we took the Balb/c male mice at the age of 2d. Then, we removed the brain after decapitation on the sterilized bench and cut the brain tissue into pieces with scissors, followed by trypsinization. 10 With 5 min of centrifugation at 1000 rpm, we cultured cells with DMEM / F-12, 15% FBS, 2 mmol/L glutamine, and after resuspension in medium with secondary antibody, filtered them out; we then incubated the cells for 2 hours and seeded them in a new culture dish for cell passage and purification. 10
Lentiviral Transfection/Transduction and Inhibitor Intervention of AtT-20 Cells
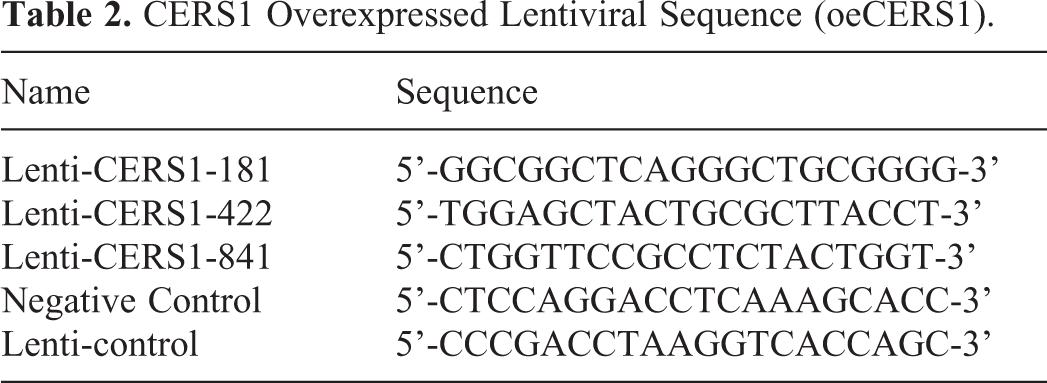
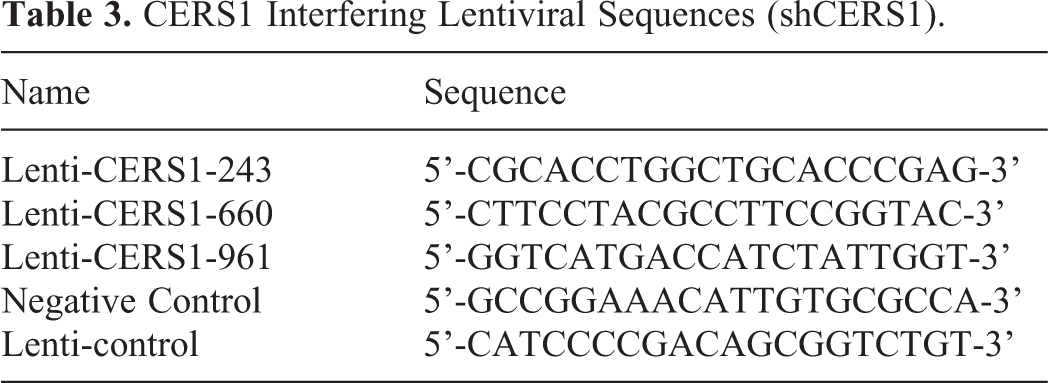
Overexpressed and interfering lentivirus were purchased from Genephama, Shanghai, China. The AtT-20 cells were seeded in 6-well plates at 2 × 10⁵ cells / well. After the density was higher than 70%, the serum-free medium was replaced. 10 μl of the over-expressed or interfering lentivirus was diluted in the medium, incubated for 6 hours, and moved to a complete culture for further culturing. Proteins or RNA were collected after 72 hours. AtT-20 cells that were transduced by overexpressed or interfering lentivirus were passaged, and the passaged cells were used to establish a mouse model of hypophysoma. Tables 2 and 3 list the lentiviral sequences.
CERS1 Overexpressed Lentiviral Sequence (oeCERS1).
CERS1 Interfering Lentiviral Sequences (shCERS1).
3mg/kg LY294002 or 120mg/kg 3 time/week MK-2206 2HCL in vivo and 50μM LY294002 or 10μmol/L MK-2206 2HCL in vitro were used to inhibit PI3 K and AKT.
Quantitative RT-PCR
Total RNA was extracted from frozen tissue using Reagent Kit (TaKaRa Biotechnology, Dalian, China). A total of 40µL RNA was reverse transcribed into cDNA. Quantitative PCR was performed as described. 17 Primer sequences for the amplification of CERS1 and β-actin were used. CERS1 mRNA level was calculated by its ratio to β-actin. See Table 4 for primer sequences.
PCR Primer Sequence.

Establishment of a Mouse Model of Hypophysoma
Balb/ c male nude mice of 4 weeks old were reared under a specific pathogen free (SPF) environment. Five days after subcutaneously injecting the mice with AtT-20 cells, we observed the vital signs and inoculation sites of the mice. As soon as the tumors were formed, the size, morphology, growth rate, and activity of the tumors were observed and measured after 42 days. In vivo experiments were divided into 6 groups, namely: Con group, oe-CERS1 group, control-CERS1 group, sh-CERS1 group, and control-shCERS1 group. 42 days after the AtT-20 cells were modeled, tumor tissue was taken, with the tumor volume = 0.5 × length × width 2 (mm3).
Western Blot
In the in vitro experiments, we rinsed the pre-cooled cells a second time and added the ristocetin-induced platelet aggregation (RIPA) lysate containing the protease inhibitor to lyse the cells. Our study then collected the supernatant after centrifugation. The tumor tissue was excised after cardiac perfusion in the in vivo experiments. 17 We measured the total protein concentration with bicinchoninic acid (BCA), prepared 10% separation gel and 5% concentrated gel, and installed the gel electrophoresis chamber. 17 After pulling out the combs, we added target protein and marker orderly, ran the gel at 80 V, and then separated the sample to the bottom of the gel at 120 V. 17 The target protein and marker were then put into the electrotransfer procedure with polyvinylidene fluoride (PVDF) membrane at 250 mA for 1 hour and blocked with 5% skim milk for 1 hour, followed by overnight primary Ab incubation. 17 Then, we rinsed the membrane with tris buffered saline tween (TBST) for 3 times and incubated the protein with secondary Ab for 1 hour. We again rinsed it with TBST for 3 times and developed it. 17 All data were detected with the ChemiDocTM Touch Imaging System and analyzed via the Image Lab 3.0 software (Bio-Rad, California, USA).
Immunofluorescence Staining (IF)
Expression of Beclin-1 was detected by IF staining. Paraffin-embedded tissue fraction (5 mm thickness) and xylene dewaxed, then dehydrated using graded concentrations of alcohol, and incubated with 3% H2O2 inhibited endogenous peroxidase. 17 Afterwards, it was blocked in 10% goat serum for 10 min at room temperature, incubated with the primary antibody in blocking solution overnight at 4°C. The primary antibodies for Beclin-1 (1:200, WL02508, WanleiBio) were used. Afterwards, the slides were washed in phosphate buffer saline (PBS), applied with horseradish peroxidase (HRP)-labeled anti-rabbit IgG (1:100; Beyotime, China) for 30 min at 37°C, then washed with PBS again. Then, images were acquired with a Nikon EclipseNi inverted microscope (TE2000, Nikon, Tokyo, Japan).
Macrophage-Derived Chemokine (MDC) Staining
We placed small coverslips in 24-well plates and digested the cells, seeded the passaged cells on slides after purification, and spread the cells into a single layer after 2 days. 17 After rinsing the cells with PBS, we used 50 μM MDC staining solution, incubated the cells at 37 °C, and with 5% CO2 for 15 minutes; then we rinsed the cells with PBS again and placed it on the top of a slide pretreated with glycerol and observed the cells under a fluorescent microscope.
TUNEL Staining
Tissue fraction was determined by TUNEL assay. The TUNEL assay was performed according to the instruction manual (Vazyme Biotech, China). Images were photographed by fluorescent microscopy at 400× magnification.
Flow Cytometry
The cell culture medium was placed in a centrifuge tube and rinsed with PBS. After trypsinization, dispersed cells were blown off. The medium was collected in a 15 ml centrifuge tube to be centrifugated at 1000 rpm for 6 min, and the supernatant was discarded. With 1 ml of pre-cooled PBS added, the cells were resuspended. 17 Then, we counted; centrifuged 50,000-100,000 resuspended cells, and discarded the supernatant; then we added 195µl Annexin V- Fluorescein isothiocyanate isomer (FITC) binding buffer, resuspended the cells, and mixed up with another 5µl Annexin V-FITC binding buffer; added 10µl propidium iodide (PI) staining solution and mixed them up by pipetting 17 ; after being protected from light for 20 min, the cells were measured with flow cytometry.
3-(4,5-Dimethyl-2-Thiazolyl)-2,5-Diphenyl-2-H-Tetrazolium Bromide, Thiazolyl Blue Tetrazolium Bromide (MTT) Assay
After stirring the solution for 30 minutes with an electromagnetic stirrer, we sterilized it with a microporous filter (0.22 µm diameter); Stored it at 4° C in the dark after splitting; Seeded cells in logarithmic growth phase onto 96-well plates in groups. Each well was seeded with 200µl cells with a concentration of 4 × 10⁴ / ml and each group of cells was allocated with 6 duplicate wells. 18 After 24 hours of incubation with 5% CO2 and at 37°C, we transfected the cells and added the above-mentioned MTT solution (20µl per well) to each group in the order of transfection time. We also incubated the cells for another 6 hours as MTT was reduced to formazan. After pipetting medium from every well, we added 150 μl dimethyl sulfoxide (DMSO) and shook it for 10 minutes to dissolve the formazan crystals. Result determination: we set a blank control well (without cells and only add the culture medium) to make the final color comparison with the blank control well aligned to zero and measured the optical density (OD) value of each well via enzyme linked immunosorbent assay (ELISA) (under the condition of 490 nm wavelength).
Transwell Invasion Assay
The Transwell chamber was pretreated with Matrigel (Corning, NY, United States) and dried at 37°C for 1 hour. Other procedures were the same as for the Transwell migration assay. 18 The results of the Transwell invasion assay were also calculated according to the number of transferred cells.
Cell Cycle Analysis
AtT-20 cells were plated in 6-well plates at a density of 2 × 10⁵ cells per well. 19 After 12 hours, various concentrations (0, 25, 50, 100 mM) of eriodyctiol were added to each well, and cells were incubated for an additional 48 hours. Detailed procedures were performed as described in reference. 19
Statistical Analysis
Data were displayed as mean ± labeled difference and analyzed via GraphPad Prism 6.0; survival analysis adopted SPSS 19.0. One-way ANOVA was applied as the statistical method to analyze the overall difference, and Sidak test was used to make comparison between groups. P value <0.05 was considered statistically significant.
Result
The Different Level of CERS1 Expression at Different Tissues or Cell Lines
The different level of CERS1 expression at different tissues or cell lines were examined by Western blot (Figure 1). The CERS1 expression and mRNA level in invasive growth hormone adenoma, non-invasive growth hormone adenoma, invasive nonfunctional adenoma and non-invasive nonfunctional adenoma were decreased (P < 0.05) in comparision with para-carcinoma tissue (Figure 1A-C). In addition, in vitro, the CERS1 expression and mRNA level in AtT-20 cells were also decreased (P < 0.05), compared with Astrocytes (Figure 1D-F).

(Figure 1A) Western blot assay of CERS1 expression in tumor and para-tumor tissue of invasive growth hormone adenoma, non-invasive growth hormone adenoma, invasive nonfunctional adenoma and non-invasive nonfunctional adenoma. (Figure 1B) Quantification of CERS1 in different tissues. (Figure 1C) Quantitative RT-PCR assay for mRNA level of CERS1. (Figure 1D) Western blot assay of CERS1 expression in Astrocytes and AtT-20 cells. (Figure 1E) Quantification of CERS1 in different cells. (Figure 1F) Quantitative RT-PCR assay for mRNA level of CERS1. Protein and mRNA levels were normalized to β-actin. (Tumor or AtT-20 cells vs. Para-tumor or Astrocytes, *, #, &, ^ P < 0.05, n = 6 per group, all data was represented as Mean ± Standard error).
Over-Express or Knockdown CERS1 Could Regulate Hypophysoma Development In Vivo
As CERS1 expression in tumor was decreased, which prompted CERS1 as correlated with tumor progression, we attempted a method for increasing the CERS1 level, that is, CERS1 over-expressed lentivirus (Figure 2). In vivo, we tested the body weight, tumor volume and tumor weight of Con, oe-CERS1, and control-CERS1 mice. The weight of mice in the whole time period had no statistical difference (Figure 2A). The tumor volume in 34, 38, 42 days in oe-CERS1 mice were significantly lower than the other 2 groups, respectively. (Figure 2B, P < 0.05). The tumor weight in oe-CERS1 mice was also reduced (Figure 2C, P < 0.05). To investigate the function of apoptosis by CERS1, we applied TUNEL staining to observe the changes (Figure 2D) and results show that the apoptotic level in oe-CERS1 mice was increased (Figure 2E, P < 0.05). Furthermore, the survival rate in oe-CERS1 mice was significantly increased (Figure 2F, P < 0.05). In addition, we also detected the survival rate of the added 2 groups, that is sh-CERS1 and control-shCERS1, were intervene with shCERS1 lentivirus and its control sequence. Interestingly, the survival rate in sh-CERS1 group was decreased (Figure 2G, P < 0.05) and the mice could not survive for up to 42 days.

(Figure 2A) Mouse weight and (Figure 2B) tumor volume in the 42-day period and (Figure 2C) tumor weight at 42 days of Con, oe-CERS1 and control-CERS1 mice. (Figure 2D) Immunofluorescence assay of TUNEL (×400) and (Figure 2E) TUNEL (+) cells assay in Con, oe-CERS1 and control-CERS1 mice. (Figure 2F-G) Survival analysis of Con, oe-CERS1, control-CERS1, sh-CERS1, and control-shCERS1 mice. (oe-CERS1 versus the Con and control-CERS1 group, *P or **P < 0.05, n = 6 per group).
Over-Express or Knockdown CERS1 Could Regulate Hypophysoma Development In Vitro
As over-expressed or knockdown CERS1 could regulate hypophysoma proliferation in vivo, we also detected this progress in vitro (Figure 3). We firstly tested the proliferation, cell cycle, invasion of Con, oe-CERS1, and control-CERS1 AtT-20 cells. The OD value in 24, 48, 72 hours were tested by MTT in oe-CERS1 group, and the value were significantly lower than the other 2 groups (Figure 3A). The distribution in G0/G1 phase in oe-CERS1 mice was significantly higher than in the other 2 groups and presented contrary results in S phase (Figure 3B, P < 0.05). The invasion ability test by Transwell assay in oe-CERS1 group was also decreased (Figure 3C, P < 0.05). To investigate the function of apoptosis by CERS1, we used flow cytometry to observe the changes (Figure 3D), and the apoptotic level in oe-CERS1 group was increased (Figure 3E, P < 0.05). For further verification of the CERS1 function in vitro, we also used sh-CERS1 and control-shCERS1 lentivirus, we found the opposite results as presented in Figure 3F-J.

(Figure 3A) Proliferation assay in 72 hours, (Figure 3B) cell cycle assay and (Figure3C) invasion assay at 72 hours of Con, oe-CERS1 and control-CERS1 group. (Figure 3D-E) The flow cytometry assay of apoptosis in Con, oe-CERS1 and control-CERS1 group. (Figure 3F) Proliferation assay in 72 hours, (Figure 3G) cell cycle assay and (Figure 3H) invasion assay at 72 hours of Con, sh-CERS1 and control-shCERS1 group. (Figure 3I-J) the flow cytometry assay of apoptosis in Con, sh-CERS1 and control-shCERS1 group. (oe-CERS1 or sh-CERS1 vs. Con and control-CERS1 or control-shCERS1 group, *P or **P < 0.05, n = 6 per group).
Over-Expression CERS1 Could Increase Hypophysoma Autophagy
To further confirm the tumor-regulated effect of the CERS1 through autophagy, we also observed autophagy-related proteins by western blot, immunofluorescence or MDC staining (Figure 4). In our experiments, we used CERS1 over-expressed lentivirus to increase the level of CERS1 expression. As shown in Figure 4A, in vivo, oe-CERS1 boosted Beclin-1 and LC3 protein levels compared to the other groups, the Beclin-1 and LC3-Ⅱ/LC3-Ⅰ level in oe-CERS1 group was increased (Figure 4B and C). The immunofluorescence staining of Beclin-1 was shown in Figure 4D, the Beclin-1 positive cells were significantly increased (Figure 4E).

(Figure 4A) Western blot assay of Beclin-1, LC3-Ⅰ and LC3-Ⅱ expression in vivo. (Figure 4B and C) Quantification of Beclin-1 and LC3-Ⅱ / LC3-Ⅰ. (Figure 4D) Immunofluorescence assay of Beclin-1 (×400) and (Figure 4E) Beclin-1 (+) cells assay in Con, oe-CERS1 and control-CERS1 mice. (Figure4F) Western blot assay of Beclin-1, LC3-Ⅰ and LC3-Ⅱ expression in vitro. (Figure 4G,H) Quantification of Beclin-1 and LC3-Ⅱ / LC3-Ⅰ. (Figure 4I) MDC staining assay and (Figure 4J) fluorescence intensity in Con, oe-CERS1, and control-CERS1 group. (oe-CERS1 vs. Con and control-CERS1 group, **P < 0.05, n = 6 per group).
In vitro, Treatment with CERS1 over-expression lentivirus significantly increased Beclin-1 and LC3-Ⅱ/LC3-Ⅰ level (Figure 4F-H). The MDC staining was shown in Figure 4I; the fluorescence intensity was also significantly increased (Figure 4J).
The Regulation of Autophagy by CERS1 in Hypophysoma Was Thought PI3K/AKT Signaling Pathway
In order to eliminate the tPI3K/AKT signaling pathway involved in the autophagy by CERS1 in hypophysoma, we used LY294002 and MK-2206 2HCL, which was the specific inhibitor of PI3 K and AKT (Figure 5). As shown in Figure 5A, LY294002 and MK-2206 2HCL could affect neither PI3K-p85 nor AKT expression but reduced the phosphorylation of PI3K-p85 and AKT in vivo and in vitro. Furthermore, the CERS1, Beclin-1 and LC3 expression was also reduced. Similarly, the immunofluorescence staining of Beclin-1 and MDC staining was also significantly reduced which was administrated with LY294002 and MK-2206 2HCL (Figure 5B-E).

(Figure 5A) Western blot assay of PI3K-P85, p-PI3K-P85, AKT, p-AKT, CERS1, Beclin-1, LC3-Ⅰ and LC3-Ⅱ expression in Vehicle, LY., MK. and LY.+MK. group. (Figure 5B) Immunofluorescence assay of Beclin-1 (×400) and (Figure 5C) Beclin-1 (+) cells assay in the Vehicle, LY., MK. and LY.+MK. group. (Figure 5D) MDC staining assay and (Figure 5E) fluorescence intensity in Vehicle, LY., MK. and LY.+MK. group. (vs. Vehicle group, **P < 0.05; vs. LY. and MK. group, ##P < 0.05, n = 6 per group).
The main experimental processes and molecular mechanisms in this article were shown in Figure 6. It mainly describes the potential mechanisms of autophagy by CERS1 through the PI3K/AKT signaling pathway in hypophysoma.

The potential mechanisms of autophagy by CERS1 through PI3K/AKT signaling pathway in hypophysoma. PI3K/AKT signaling pathway could increase CERS1 expression, enhance autophagy and autophagosome progress by rough endoplasmic reticulum, induce apoptosis and prolong the life of mice. LY294002 and MK-2206 2HCL reverse the process through reducing p-PI3 K and p-AKT expression, causing CERS1 to decrease and inhibit the autophagy.
Discussion
Overview and Treatment Status of Hypophysoma
Hypophysoma is originated from pituitary gland cells. It refers to a group of tumors that occur from the anterior pituitary which accounts for 10% of nervous system tumors and is a common intracranial tumor. 20 Hypophysoma usually occurs among young adults and affects the patient’s growth and development, reproductive function, learning and working ability. Clinical manifestations include syndrome of abnormal hormone secretion, syndrome of tumor compression on tissue surrounding pituitary gland, pituitary apoplexy, and other hypofunction manifestations of anterior pituitary glands. 21
The cure rate of resection surgery for hypophysoma only around 80%, so a variety of comprehensive treatment methods are usually needed. 22 Although radiotherapy can achieve relatively good clinical effects, secondary radiation brain edema has become an unavoidable problem in treating hypophysoma, which probably leading to pituitary dysfunction, intracranial nerve damage, and radiation-induced encephalopathy. 4 Researches on the pathogenesis of hypophysoma and target-gene therapy have attracted scholars’ attention. Gene-targeted therapy has gradually become a research feature of clinicians. The occurrence and development of hypophysoma is considered to be an extremely complex biological process controlled by multiple genes with multiple factors interacting with each other, the specific mechanism of which still remains unclear.
Autophagy in Tumor
Autophagy plays a vital role in the formation of tumors. Although some tumor cells have different autophagy activities prior to cancer development, their autophagic ability is weakened after the cells become cancerous. These findings suggest that the weakening of autophagy activity may escalate the deterioration of tumors. 23 Autophagy is a rapid response of cells to changes in their surroundings, which underpins cell metabolism. 24
The Research Status of CERS1 in Tumor
Ceramide is involved in a variety of physiological functions. CERs is a key enzyme in synthesizing ceramide. 12 Located on the endoplasmic reticulum membrane, CERS1 usually synthesizes C18-ceramide and C20-ceramide. It is a CERS with the highest expression, which is mainly expressed in the cerebral cortex, hippocampal neurons, and cerebellum. 25,26 The lack of C18-ceramide in the human brain can lead to Alzheimer’s disease and neurodegenerative diseases. 27 In squamous cell carcinoma tissues in the heads and necks of most human, CERS1 and C18-ceramide levels are significantly lower compared to para-carcinoma tissues, 28 and overexpression of CERS1 can trigger tumor cell growth inhibition. 29 CERS1 is widely considered as an important gene target for tumor suppression in clinical researches, but the relationship between CERS1 and tumor autophagy in hypophysoma is rarely reported.
In this study, we first performed the Western blot and RT-PCR analysis on 4 human hypophysoma specimens in invasive growth hormone adenoma, non-invasive growth hormone adenoma, invasive nonfunctional adenoma, and non-invasive nonfunctional adenoma. Results showed that both the protein expression and mRNA levels of CERS1 in para-carcinoma tissues decreased in the invasive and non-invasive tissues, indicating that CERS1 has a certain relation with the occurrence and development of hypophysoma. In addition, we also found that CERS1, in invasive nonfunctional adenoma and non-invasive nonfunctional adenoma, presented a sharper decrease, suggesting that CERS1 may play a more significant role in nonfunctional adenoma. Further verification was conducted during in vitro experiments, results show that the expression of CERS1 in AtT-20 cells was significantly lower than that of astrocytes, which is consistent with the results of in vivo experiments.
Proliferation, migration, and invasion of tumor cells are key steps for the deterioration of tumor tissue. Increased volume and weight of tumor cells can trigger not only compression, but also abnormal energy and endocrine metabolism, causing systemic organ dysfunction and even body death. 30 To examine the role of CERS1 in the progression of hypophysoma, we applied CERS1 to overexpress and interfere lentivirus. In vivo experiments found that after CERS1 overexpression, the volume and weight of hypophysoma were inhibited to a certain extent, apoptosis shown, and the survival time of mice prolonged. In addition, most mice could not survive for up to 42 days due to the drastic reduction in survival time after the CERS1 interference, which disabled us to measure tumor volume, weight, and apoptosis. During in vitro experiments, we also applied the same methods to observe the proliferation, cell cycle, and invasive ability of tumor cells. We found that after CERS1 overexpression, the proliferation of AtT-20 cells was significantly inhibited after 24 hours. The cells are stabilized in the G0 / G1 phase, the distribution of the S phase is reduced and the invasiveness of the cells is reduced. In addition, the proliferation of AtT-20 cells was significantly enhanced after 24 hours after CERS1 was knocked down, with the cell distribution of the S phase expanded, cells in the G0 / G1 phase decreased, and the invasion capacity of the cells elevated. We also observed the cells apoptosis, and the results show that CERS1 overexpression increased apoptosi, and CERS1 interference reduced apoptosis. These results underline the important role of CERS1 in the occurrence and development of hypophysoma, yet the mechanism by which CERS1 functions is still to be further studied.
Huang et al reported that CERS1 plays a role in autophagy in endothelial cells, 18 so we made further verification in hypophysoma cells. Similarly, we applied CERS1 to overexpress lentivirus, and found that after CERS1 overexpression, the autophagy-related proteins Beclin-1 and LC3 were enhanced in vivo and in vitro, suggesting that CERS1 may play a part in the occurrence and development of hypophysoma through autophagy, which may provide new insights for studying the mechanism and treatment of hypophysoma.
PI3 K / Akt signaling pathway plays a critical role in cellular, proliferation, survival, and metabolism. 31 We hypothesized that CERS1 might have tumor-regulation effects through the PI3 K / AKT signaling pathway. We applied PI3 K and Akt to specifically inhibit LY294002 and MK-2206 2HCL and observed CERS1 and autophagy-related proteins. The data shows that the protein expression of CERS1 and autophagy-related proteins was significantly reduced after LY294002 and MK-2206 2HCL intervention in vivo and in vitro experiments; autophagy was also inhibited in immunofluorescence assay, especially after the simultaneous intervention of LY294002 and MK-2206 2HCL; the degree of inhibition of cell autophagy was more pronounced.
In our study, the mechanism of CERS1 on autophagy was not fully developed. Our research interests focus on CERS1 regulating the autophagy through PI3K/Akt signaling pathway in this article. Further studies on how CERS1 regulates the autophagy, as well as the related proteins need to be further tested and verified in the following studies. The limitations of this manuscript including the calculation and justification of the sample size, and more comprehensive methods to explain CERS1 function in autophagy.
CERS1 Can Regulate the Autophagy of Tumor Cells Through the PI3K/Akt Signaling Pathway
To summarize, the study presents that CERS1 can regulate the autophagy of tumor cells through the PI3K/Akt signaling pathway and affect the occurrence and development of hypophysoma. CERS1 overexpression can significantly reduce tumor volume and weight, inhibit the proliferation and invasion of hypophysoma cells, enhance apoptosis, and raise the mice survival rate in hypophysoma models. CERS1 overexpression can improve tumor cell autophagy and CERS1 may regulate autophagy of tumor cells through the PI3K/Akt signaling pathway. These results may provide a new strategy to hypophysoma development by autophagy.
Footnotes
Authors’ Note
JT designed the study and write the first draft; JM polished the first draft, confirmed the methodology and material parts; DZ and XS analyzed the data, write, and revised the paper. All authors read and approved the final manuscript. All human tissues used in this study were cared for in strict accordance with the World Medical Association (Declaration of Helsinki)–ethical principles for medical research involving human subject (JAMA Publication No. 20, revised 2013). All experimental procedures were approved by the Human Ethics Committee of Affiliated Hospital of Hebei University of Engineering, and the informed consent were obtained from each subject. All animals used in this experiment were cared for in strict accordance with the Declaration of Helsinki. Measures were taken to minimize animals suffering. All experimental procedures were approved by Animal Ethics Committee of Affiliated Hospital of Hebei University of Engineering.
Declaration of Conflicting Interests
The author(s) declared no potential conflicts of interest with respect to the research, authorship, and/or publication of this article.
Funding
The author(s) received no financial support for the research, authorship, and/or publication of this article.