
Abstract
Objective:
This study aimed to investigate the correlation of long noncoding RNA plasmacytoma variant translocation 1 with clinical features and prognosis in patients with multiple myeloma.
Methods:
The bone marrow samples were collected from 128 patients with de novo symptomatic multiple myeloma (before initial treatment) and 30 healthy donors (on the enrollment). Long noncoding RNA plasmacytoma variant translocation 1 expression in bone marrow-derived plasma cells was detected by reverse transcription quantitative polymerase chain reaction. In patients with multiple myeloma, their demographics and clinical features before treatment were collected; induction treatment response (complete response and overall response rate) and survival profiles (progression-free survival and overall survival) were assessed.
Results:
Expression of long noncoding RNA plasmacytoma variant translocation 1 was increased in patients with multiple myeloma compared to healthy donors. Receiver-operating characteristic curve showed that long noncoding RNA plasmacytoma variant translocation 1 distinguished patients with multiple myeloma from healthy donors with an area under the curve of 0.884 (95% confidence interval: 0.829-0.940). In patients with multiple myeloma, high expression of long noncoding RNA plasmacytoma variant translocation 1 correlated with elevated β-2 microglobulin, increased International Staging System stage, and raised Del (17p), but it did not correlate with other biochemical indexes or chromosomal abnormalities. Furthermore, long noncoding RNA plasmacytoma variant translocation 1 high expression patients presented with decreased complete response and overall response rate compared to long noncoding RNA plasmacytoma variant translocation 1 low expression patients, and high expression of long noncoding RNA plasmacytoma variant translocation 1 predicted unfavorable progression-free survival as well overall survival in patients with multiple myeloma.
Conclusion:
Long noncoding RNA plasmacytoma variant translocation 1 might be a potential biomarker for the supervision of disease progression and prognosis in patients with multiple myeloma.
Keywords
Introduction
Multiple myeloma (MM), a B-cell neoplasm, arises from an abnormal expanded plasma cell clone. 1 It is a common hematological disorder, which is characterized by back pain coupled with hematological abnormalities (elevated erythrocyte sedimentation rates, low platelet counts, or more rarely low total white cell counts), hypercalcemia, renal failure, anemia, and bone lesions. 1 For current treatments, high-dose chemotherapy with autologous stem cell transplantation (ASCT) is considered as the first-line therapy for newly diagnosed patients with MM to improve survival. Whereas for patients with MM who are not suitable for ASCT, proteasome inhibitors and immunomodulation are frequently utilized. 2,3 Although the multiple treatments have been greatly improved, MM remains as a large challenge featured by a classically relapsing course. Taken together, it is necessary to explore convincing biomarkers for early diagnosis and prognosis improvement of MM.
Long noncoding RNAs (lncRNAs) are transcripts typically longer than 200 nucleotides, which are crucial for regulating gene expression at posttranscriptional level to affect multiple cellular activities such as cell growth, cell cycle, and cell migration. 4,5 Accumulating evidences show that various lncRNAs are vital in the development and progression of cancers, including hematologic malignancies. 5 -8 As one of the most common cancer-related lncRNAs, lncRNA plasmacytoma variant translocation 1 (lnc-PVT1) is located on chromosome 8q24 that is a location shared with the proverbial oncogene c-Myc (an oncogenic transcription factor relating to the development of leukemia and lymphoma). 9 -11 Meanwhile, lnc-PVT1 is reported to not only sponge anticarcinogenic miR-203a to promote cell proliferation and repress cell apoptosis in MM 6 but also interact with c-Myc to increase cells in G0/G1 phase and activate cell proliferation in lymphoma. 12 Besides, previous studies disclose that lnc-PVT1 overexpression correlates with worse clinical features and poor prognosis in patients with acute myelocytic leukemia (AML). 13 Hence, lnc-PVT1 might present with a high potential for clinical application in hematologic malignancies.
Although the underlying mechanism of lnc-PVT1 in hematologic malignances and its oncogenic role in several hematologic patients have been clarified, the clinical implication of lnc-PVT1 in patients with MM is still unclear. In our preliminary research, we discovered that lnc-PVT1 expression was higher in patients with MM, and it correlated with advanced clinical features and worse prognosis of patients with MM. Based on above mentioned, a hypothesis was proposed that lnc-PVT1 might also accelerate progression and relate to worse prognosis in patients with MM. Herein, the focus of this study was to investigate the correlation of lnc-PVT1 with clinical features and prognosis in patients with MM.
Materials and Methods
Participants
During the period between January 2016 and June 2019, 128 patients with de novo MM were consecutively enrolled from our hospital. All patients were newly confirmed as de novo MM according to 2014 International Myeloma Working Group updated criteria for the diagnosis of MM, 14 aged 18 to 80 years old; without other hematological malignancies, solid tumors, or serious infection; no history of chemotherapy, radiotherapy, or stem cell transplantation, and not pregnant or lactating women. While the smoldering (asymptomatic) MM, relapsed MM, secondary MM, or patients with mixed MM were excluded from this study. Besides, 30 healthy individuals who underwent bone marrow (BM) donation in our hospital during the same period were recruited as healthy donors, and their health conditions were confirmed when examining the eligibilities for BM transplantation. Meanwhile, 42 patients with relapsed/refractory (R/R) MM treated in our hospital were also enrolled in the study, and all of them were aged 18 to 80 years old without other hematological malignancies. The ethical approval for this study was acquired from the Ethics Committee of Huashan Hospital, Fudan University. The approval number of ethics committee was No. 2015-422. The written informed consents were provided by the patients before enrollment.
Data and Sample Collection
The demographics, immunoglobulin (Ig) subtypes, biochemical indexes levels, bone lesion status, renal impairment status, and chromosomal abnormalities were collected from electronic medical records. The Durie-Salmon (DS) stage was assessed based on hemoglobin (Hb) level, serum calcium level, bone X-ray result, and low M-component production rate according to the criteria of DS stage system for MM. 15 As for the International Staging System (ISS) stage, it was evaluated based on serum β-2 microglobulin (β2-MG) and albumin (ALB) level referring to the criteria of ISS for MM. 16 The BM samples of patients with MM were collected before initial treatment, and the BM samples of healthy donors were collected on the enrollment. After collection, the BM samples were processed with gradient density centrifugation to isolate BM mononuclear cells. Then, the plasma cells were purified from BM mononuclear cells with the use of CD138-coated magnetic beads (Miltenyi Biotec; Catalog No. 130-051-301), and the purified plasma cells were stored in liquid nitrogen for further detection.
Reverse Transcription Quantitative Polymerase Chain Reaction
Reverse transcription quantitative polymerase chain reaction (qPCR) was performed to detect the relative expression of lnc-PVT1 and c-Myc in plasma cells. After the extraction of total RNA by PureZOL RNA isolation reagent (Bio-Rad; Catalog No. 7326880), RNA was converted to complementary DNA (cDNA) using iScript cDNA Synthesis Kit (Bio-Rad; Catalog No. 1708890). The cDNA product was subsequently subjected to qPCR with KOD SYBR qPCR Mix (Toyobo; Catalog No.QKD-201 T). The polymerase chain reaction amplification was performed as follows: 95 °C for 5 minutes, followed by 40 cycles of amplification (95 °C for 5 seconds, 61 °C for 15 seconds). The qPCR result was calculated by the 2−ΔΔCt method with glyceraldehyde-3-phosphate dehydrogenase (GAPDH) as the reference gene. After that, the 2−ΔΔCt method was applied for calculating the expressions of candidate RNAs as follows: ΔC t (test) = C t (target, test) − C t (reference, test), ΔC t (calibrator) = C t (target, calibrator) − C t (reference, calibrator), ΔΔC t = ΔC t (test) − ΔC t (calibrator), then the relative expression of target gene was calculated as 2−ΔΔCt. The primers were as follows: lnc-PVT1 forward primer: CGAGCTGCGAGCAAAGATGT, reverse primer: CCGTGTCTCCACAGGTCACA; c-Myc forward primer: CAGCTGCTTAGACGCTGGATT, reverse primer: GTAGAAATACGGCTGCACCGA; GAPDH; forward primer: TGACCACAGTCCATGCCATCAC, reverse primer: GCCTGCTTCACCACCTTCTTGA.
Treatment and Clinical Response Assessment
After the patients were admitted in our hospital, appropriate treatments (such as bortezomib/dexamethasone and melphalan/prednisone/bortezomib) were given to them according to the clinical conditions, and their clinical response was assessed after treatment for 2 cycles in accordance with National Comprehensive Cancer Network clinical practice guidelines in oncology: MM (2015.V4) as follows: (1) complete response (CR) was defined as negative immunofixation on the serum and urine and disappearance of any soft tissue plasmacytomas and ≤5% plasma cells in BM; (2) very good partial response (VGPR) was defined as serum and urine M-protein detectable by immunofixation but not on electrophoresis or 90% or greater reduction in serum M-protein plus urine M-protein level <100 mg per 24 hours; (3) partial response (PR) was defined as ≥50% reduction of serum M-protein and reduction in 24-hour urinary M-protein by ≥90% or to <200 mg per 24 hours; and (4) overall response rate (ORR) was defined as CR + VGPR + PR.
Follow-Up
All patients were regularly followed up to June 30, 2019, and the median follow-up duration was 21.5 months. Progression-free survival (PFS) was calculated from the date of initial treatment to the date of disease progression or death. Overall survival (OS) was calculated from the date of initial treatment to the date of death. Patients not known to have disease progressed or have died at the last follow-up date were censored on the date of last visit or the date last known to be alive.
Statistical Analysis
Statistical analyses were performed using SPSS 24.0 (IBM). Figures were plotted using GraphPad Prism 7.00 (GraphPad Software). Descriptive analyses of continuous variables were expressed as mean ± standard deviation or median (interquartile range ). Descriptive analyses of categorical variables were displayed as count and percentage. Comparison of lnc-PVT1 relative expression between healthy donors and patients with MM was determined by Wilcoxon rank-sum test. Comparison of high and low expressions of lnc-PVT1 with biochemical index was determined by Wilcoxon rank-sum test. Correlation of high and low expressions of lnc-PVT1 with ISS stage was analyzed by Wilcoxon rank-sum test. Correlation of high and low expressions of lnc-PVT1 with DS stage, chromosomal abnormality, CR, or ORR was determined by χ2 test. The ability of lnc-PVT1 in discriminating patients with MM from healthy donors was evaluated by receiver-operating characteristic (ROC) curve, the area under curve (AUC), and best cutoff point. Progression-free survival and OS were illuminated using Kaplan-Meier curves, and the difference of PFS and OS between 2 groups was determined by log-rank test. Factors predicting PFS or OS were analyzed by univariate and forward stepwise multivariate Cox proportional hazard regression model. A P value <.05 was considered as significant.
Results
Clinical Characteristics of Patients With MM
The mean age was 55.0 ± 8.7 years old, and there were 46 (35.9%) females/82 (64.1%) males (Table 1). For Ig subtype, 70 (54.7%) patients presented with IgG, 35 (27.3%) patients presented with IgA, and 23 (18.0%) patients presented with others. The number of patients with bone lesion and renal impairment was 94 (73.7%) and 54 (42.2%), respectively. For DS stage, 12 (9.4%) patients and 116 (90.6%) patients were at stage II and at stage III, respectively. For ISS stage, 31 (24.2%) patients were at stage I, 33 (25.8%) patients were at stage II, and 64 (50.0%) patients were at stage III. As to biochemical indexes, the median value of Hb, calcium, serum creatinine, ALB, β2-MG, and lactate dehydrogenase (LDH) was 99.0 (83.0-113.8) g/L, 9.8 (8.7-11.1) mg/dL, 1.9 (1.4-2.3) mg/dL, 34.0 (29.0-38.0) g/L, 5.6 (3.1-8.8) mg/L, and 216.6 (179.7-248.3) U/L, respectively. For chromosomal abnormalities, 12 (9.4%) patients were with t(4; 14), 6 (4.7%) patients were with t(14; 16), and 13 (10.2%) patients were with Del(17p). The detailed information is shown in Table 1.
Clinical Characteristics.

Abbreviations: ALB, albumin; β2-MG, β-2-microglobulin; DS, Durie-Salmon; Hb, hemoglobin; IgA, immunoglobulin A; IgG, immunoglobulin G; IQR, interquartile range; ISS, International Staging System; LDH, lactate dehydrogenase; MM, multiple myeloma; Scr, serum creatinine; SD, standard deviation.
The Expression of lnc-PVT1 and Its Performance in Distinguishing Patients With MM From Healthy Donors
The median value of lnc-PVT1 in patients with MM and healthy donors was 2.812 (1.840-4.492) and 1.026 (0.617-1.434), respectively (Figure 1A), and it was greatly higher in patients with MM than that in healthy donors (P < .001). The ROC curve showed that lnc-PVT1 distinguished patients with MM from healthy donors with AUC of 0.884 (95% CI: 0.829-0.940). The sensitivity and specificity were 75.0% and 93.3%, respectively, at the best cutoff point (that was a point with the largest sum of sensitivity and specificity; lnc-PVT1 = 1.864; Figure 1B). In addition, we also compared the lnc-PVT1 expression between primary patients with MM and patients with R/R MM, and we discovered lnc-PVT1 expression showed an increased trend in patients with R/R MM compared to patients with primary MM, but with no statistical significance (P = .063; Supplementary Figure 1).

Expression of Lnc-PVT1 and ROC analysis of lnc-PVT1. A, Comparison of lnc-PVT1 expression between patients with MM and health donors. B, The performance of lnc-PVT1 in distinguishing patients with MM from healthy donors. Lnc-PVT1 indicates long noncoding RNA plasmacytoma variant translocation 1; MM, multiple myeloma; ROC, receiver-operating characteristic.
Association of lnc-PVT1 Expression With Clinical Characteristics in Patients With MM
According to median value of lnc-PVT1 in patients with MM, all patients were divided into lnc-PVT1 high expression group and low expression group for the following analysis. For biochemical indexes, lnc-PVT1 expression positively correlated with β2-MG (P = .011), while no difference was found in the correlation of lnc-PVT1 with Hb (P = .266), calcium (P = .387), Scr (P = .238), ALB (P = .247), or LDH (P = .952; Table 2). For disease stage, no correlation was discovered for lnc-PVT1 expression with DS stage (P = .544; Figure 2A), while lnc-PVT1 high expression correlated with increased ISS stage (P = .012; Figure 2B). As to chromosomal abnormalities, high expression of lnc-PVT1 correlated with high Del(17p), P = .041 (Figure 3C), while there was no correlation of lnc-PVT1 expression with t(4; 14), P = .225 (Figure 3A) or t(14; 16), P = .208 (Figure 3B). In addition, we assessed the correlation between lnc-PVT1 expression and c-Myc expression in patients with MM, and we found that lnc-PVT1 expression was positively correlated with c-Myc expression in patients with MM (P < .001, r = 0.361; Supplementary Figure 2).
Correlation of lnc-PVT1 With Biochemical Indexes.a

Abbreviations: ALB, albumin; β2-MG, β-2-microglobulin; Hb, hemoglobin; IQR, interquartile range; LDH, lactate dehydrogenase; lnc-PVT1, long noncoding RNA PVT1; Scr, serum creatinine.
a Comparison was analyzed by Wilcoxon rank-sum test.
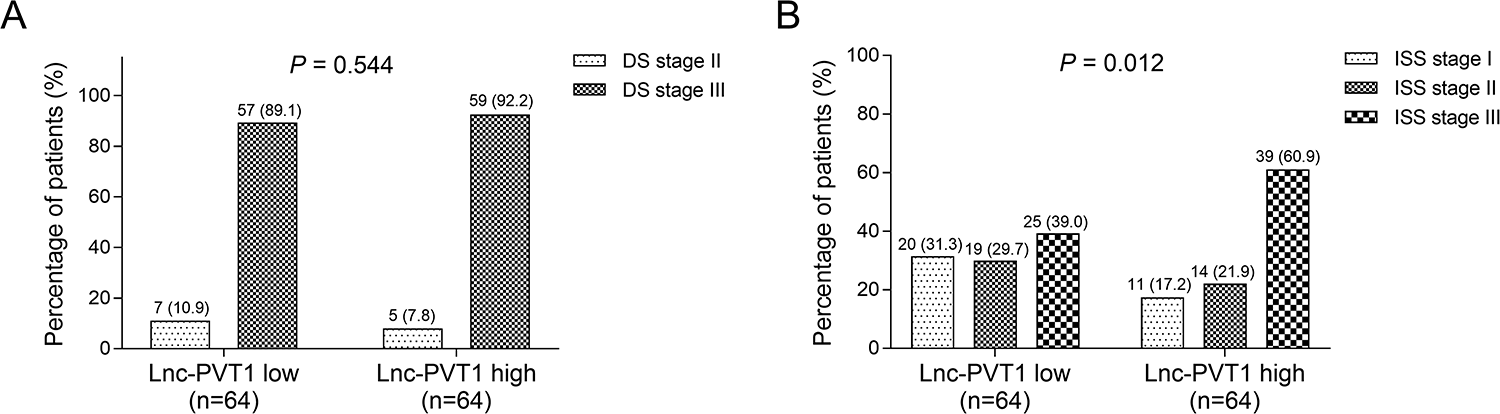
Correlation of lnc-PVT1 expression with DS stage and ISS stage in patients with MM. A, Correlation of lnc-PVT1 expression with DS stage. B, Correlation of lnc-PVT1 expression with ISS stage. DS indicates Durie-Salmon; ISS, International Staging System; Lnc-PVT1, long noncoding RNA plasmacytoma variant translocation 1; MM, multiple myeloma.
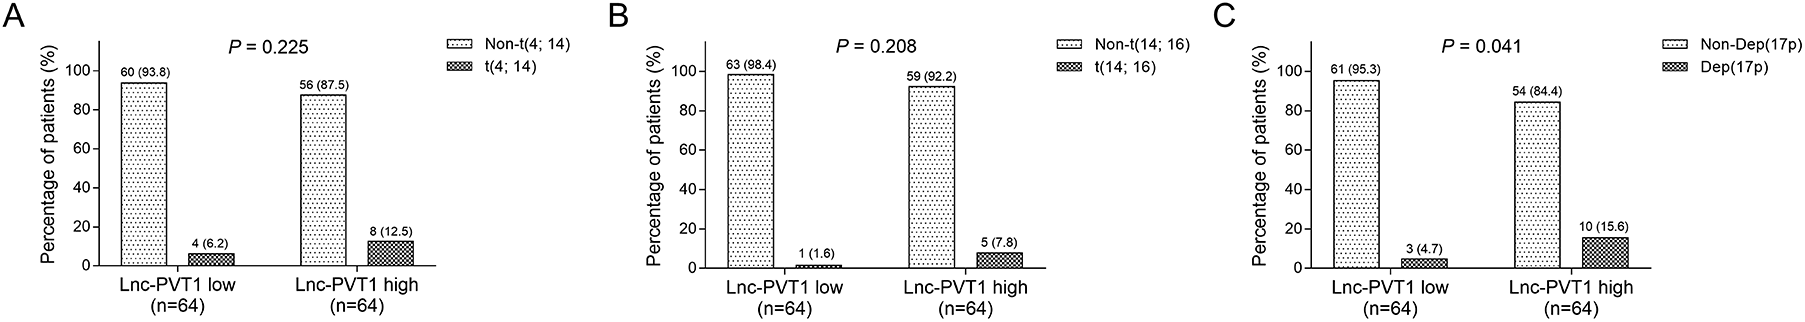
Correlation of lnc-PVT1 with t(4; 14), t(14; 16), and Del (17p) in patients with MM. A, Correlation of lnc-PVT1 expression with t(4; 14). B, Correlation of lnc-PVT1 expression with t(14; 16). C, Correlation of lnc-PVT1 expression with Del (17p). Lnc-PVT1 indicates long noncoding RNA plasmacytoma variant translocation 1; MM, multiple myeloma.
Association of lnc-PVT1 Expression With Treatment Responses in Patients With MM
There were 36 (28.1%) patients who achieved CR and 94 (73.4%) patients who achieved ORR (Figure 4A). The percentage of patients achieved CR was lower in lnc-PVT1 high expression group than that in lnc-PVT1 low expression group (P = .018; Figure 4B). In addition, the percentage of patients who achieved ORR was also reduced in lnc-PVT1 high expression group compared to lnc-PVT1 low expression group (P = .045; Figure 4C).

Correlation of lnc-PVT1 with CR and ORR in patients with MM. A, Treatment response. B, Correlation of lnc-PVT1 expression with CR. C, Correlation of lnc-PVT1 expression with ORR. CR indicates complete response; lnc-PVT1, long noncoding RNA plasmacytoma variant translocation 1; MM, multiple myeloma; ORR, overall response rate.
Association of lnc-PVT1 Expression With Survival Profiles in Patients With MM
Long noncoding RNA plasmacytoma variant translocation 1 high expression predicted poor PFS (P = .002; Figure 5A) and worse OS (P = .012; Figure 5B) in patients with MM.

Correlation of lnc-PVT1 with PFS and OS in patients with MM. A, Correlation of lnc-PVT1 expression with PFS. B, Correlation of lnc-PVT1 expression with OS. lnc-PVT1 indicates long noncoding RNA plasmacytoma variant translocation 1; MM, multiple myeloma; PFS, progression-free survival; OS, overall survival.
Prognostic Factors for PFS in Patients With MM
Univariate Cox regression analysis showed that lnc-PVT1 high expression (P = .003), bone lesion (P < .001), renal impairment (P = .001), ISS stage (P < .001), Scr (>2 mg/dL; P = .001), β2-MG (>5.5 mg/L; P < .001), LDH (>220 U/L; P = .025), and t(4; 14), P < .001, predicted poor PFS in patients with MM. Forward stepwise multivariate Cox regression analysis disclosed that lnc-PVT1 high expression could not independently predict PFS in patients with MM, while male (P = .008), β2-MG (>5.5 mg/L; P < .001), t(4; 14), P < .001, and Del(17p), P = .026, were independent factors for predicting worse PFS in patients with MM, which suggested that lnc-PVT1 might interact with β2-MG and Del(17p) to affect PFS in patients with MM (Table 3).
Factors Predicting PFS for Patients With MM.a

Abbreviations: ALB, albumin; β2-MG, β-2-microglobulin; DS, Durie-Salmon; Hb, hemoglobin; HR, hazard ratio; IgA, immunoglobulin A; IgG, immunoglobulin G; ISS, International Staging System; LDH, lactate dehydrogenase; lnc-PVT1, long noncoding RNA PVT1; MM, multiple myeloma; PFS, progression-free survival; Scr, serum creatinine.
a Factors predicting PFS were analyzed by univariate and forward stepwise multivariate Cox proportional hazard regression model.
Prognostic Factors for OS in Patients With MM
Univariate Cox regression analysis showed that lnc-PVT1 high expression (P = .015), bone lesion (P = .008), renal impairment (P = .006), ISS stage (P < .001), Scr (>2 mg/dL; P = .021), β2-MG (>5.5 mg/L; P < .001), t(4; 14), P = .001, and t(14; 16), P = .021, predicted worse OS in patients with MM. Forward stepwise multivariate Cox regression analysis illustrated that lnc-PVT1 high expression was not an independent factor for predicting OS, while β2-MG (>5.5 mg/L; P < .001), t(4; 14), P = .005, and Del(17p) (P = .009) could independently predict decreased OS in patients with MM, which indicated that lnc-PVT1 might interact with β2-MG and Del(17p) to affect OS in patients with MM (Table 4).
Factors Predicting OS for Patients With MM.a

Abbreviations: ALB, albumin; β2-MG, β-2-microglobulin; DS, Durie-Salmon; Hb, hemoglobin; HR, hazard ratio; IgA, immunoglobulin A; IgG, immunoglobulin G; ISS, International Staging System; LDH, lactate dehydrogenase; lnc-PVT1, long noncoding RNA PVT1; MM, multiple myeloma; OS, overall survival; Scr, serum creatinine.
a Factors predicting OS were analyzed by univariate and forward stepwise multivariate Cox proportional hazard regression model.
Discussion
Accumulating evidence reveals that lnc-PVT1 is functionally linked to tumorigenesis of cancers. For example, one previous study discloses that lnc-PVT1 mediates miR-128-3p/Gremlin 1 axis and bone morphogenetic protein signaling pathway to increase cell growth in glioma. 17 Meanwhile, lnc-PVT1 has been reported to suppress miR-195 to promote cell proliferation but decrease cell cycle arrest and apoptosis in osteosarcoma cells. 18 Furthermore, another study reveals that lnc-PVT1 downregulates miR-16-5p to accelerate cell proliferation, invasion, and epithelial–mesenchymal transition in renal cell carcinoma. 19 For hematologic malignancies, several comprehensive mechanisms between lnc-PVT1 and malignancies have been reported in continuance. On the one hand, lnc-PVT1 sponges multiple tumor suppressor microRNAs (miRNAs) in hematologic malignancies. For instance, lnc-PVT1 promotes MM cell proliferation and inhibits cell apoptosis via downregulating miR-203a. 6 On the other hand, owing to the specific location of lnc-PVT1 on chromosome 8q24, chromosome 8q24 could cooperate with PML-RARα (an initiating factor for acute promyelocytic leukemia [APL] leukemogenesis) to induce additional genetic lesions, thereby blocking differentiation and accelerating the development of myeloid leukemia. 20 Meanwhile, a previous study shows that knockdown of lnc-PVT1 contributes to Myc protein suppression to inhibit cell proliferation in APL. 21 Thus lnc-PVT1 might affect the stability of several key proteins that are indispensable for cell growth in hematologic malignancies. On the basis of above-mentioned mechanisms, lnc-PVT1 might present with a high potential for clinical application in hematologic malignancies, including MM.
More recently, lnc-PVT1 has been reported to be dysregulated and act as a convincing diagnostic biomarker in patients with a variety of cancers, including melanoma, 22 pediatric malignancies, 23 and liver cancer. 24 However, limited evidences could be found about its role in patients with hematologic malignancies. One recent study reveals that the patients with APL presents with higher lnc-PVT1 expression compared with the controls. 25 Although several evidences are available regarding to the potential mechanism of lnc-PVT1 underlying hematologic malignancies, including MM (above mentioned), the expression level and clinical implication of lnc-PVT1 in patients with MM are still unlearn. Herein, we enrolled 128 patients with de novo MM and found that lnc-PVT1 was higher in patients with MM compared to healthy donors, and it could distinguish patients with MM from health donors, which might be caused by that lnc-PVT1 was in the specific location shared with c-Myc (an oncogenic transcription factor contributing to the development of leukemia and lymphoma) on chromosome 8q24, and gain of supernumerary copies of the 8q24 chromosomal region in patients with MM could result in increased copy number of lnc-PVT1. 7 Thus, lnc-PVT1 expression was increased in patients with MM, and it could distinguish patients with MM from healthy donors.
In recent years, a growing number of studies focus on the correlation of lnc-PVT1 with clinicopathological characteristics in patients with cancer, which display that lnc-PVT1 high expression is related to advanced clinicopathologic characteristics in patients with solid tumor (such as lymph node melanoma metastasis and increased clinical stage in patients with small cell lung cancer 26 ; invasion depth, advanced tumor-node-metastasis stage, and regional lymph nodes metastasis in patients with gastric cancer 27 ; as well as clinical stage and N-classification in patients with pancreatic ductal adenocarcinoma. 28 For hematologic malignancies, just few previous studies have been performed. One previous study reveals that high level of lnc-PVT1 is associated with high-risk clinical features in patients with AML 13 ; another study discloses that lnc-PVT1 high expression is related to increased French-American-British subtypes stage in patients with APL. 25 Whereas it is not yet clear for the clinical value of lnc-PVT1 in patients with MM. In the current study, we discovered that lnc-PVT1 high expression correlated with high β2-MG level, increased ISS stage, and raised Del (17p) in patients with MM. The possible explanations were as follows: firstly, lnc-PVT1 could sponge multiple miRNAs directly (including the inhibition of miR-203a and miR-214), which subsequently increased MM cell proliferation and reduced apoptosis, thereby devoting into advanced clinical features in patients with MM. 6,29 Secondly, lnc-PVT1 might interact with c-Myc messenger RNA and also preserve c-Myc protein from phosphorylation at threonine 58 as well as subsequent degradation to accelerate disease progression, thereby contributing to worse clinical features in patients with MM.
Despite that the predictive value of lnc-PVT1 for poor prognosis has been determined in patients with various cancers (such as gastric cancer 27 and pancreatic cancer 28 ) regarding to the influence of lnc-PVT1 on prognosis in hematologic malignancies, limited studies have been performed. Just one previous study discloses that high expression of lnc-PVT1 is associated with lower OS rate and leukemia-free survival in patients with AML, which suggests the potential of lnc-PVT1 to be a prognostic indicator for patients with AML. 13 However, whether lnc-PVT1 also has a prognostic value in patients with MM is still unclear. Here, we discovered that lnc-PVT1 high expression predicted lower CR, ORR, poor PFS, and OS in patients with MM, which suggested that lnc-PVT1 expression predicted worse prognosis in patients with MM. The possible causes were as follows: firstly, lnc-PVT1 was related to aggravating clinical features, which contributed to poor prognosis in patients with MM (above mentioned). 6,29 Secondly, lnc-PVT1 promoted drug resistance and also participated in autophagy-related pathways (including positive feedback loop of lnc-PVT1—forkhead M1), thereby resulting in worse prognosis in patients with MM. 30,31 However, we also found that lnc-PVT1 high expression was not an independent factor for predicting PFS and OS in patients with MM, which indicated that lnc-PVT1 might interact with multiple factors such as β2-MG and Del(17p) to result in short PFS and OS in patients with MM.
Despite of the interesting results in this study, some limitations still existed. Firstly, we just enrolled 128 patients with de novo MM, and the sample size in this study was relatively small, which might lead to poor statistical power. Thus, further study enrolling more patients with MM was necessary. Secondly, the detailed mechanism of lnc-PVT1 underlying MM pathogenesis was not investigated; hence further investigation was necessary. Thirdly, all patients with MM were patients with symptomatic MM, while the impact of lnc-PVT1 on clinical features and prognosis in patients with asymptomatic MM was still not explored. Finally, the change of lnc-PVT1 expression before treatment, after induction treatment, and after a certain time of consolidation treatment was not analyzed in this study, thus, further study was needed.
Conclusion
In conclusion, lnc-PVT1 distinguishes patients with MM from healthy donors, and it correlates with advanced clinical features as well as predicts worse prognosis of patients with MM, which indicates that lnc-PVT1 might be a potential biomarker for the supervision of disease progression and prognosis in patients with MM.
Supplemental Material
Supplemental Material, Supplementary_Figure_1 - Long Noncoding RNA Plasmacytoma Variant Translocation 1 Is Increased in Multiple Myeloma and Correlates With Lower Induction Response
Supplemental Material, Supplementary_Figure_1 for Long Noncoding RNA Plasmacytoma Variant Translocation 1 Is Increased in Multiple Myeloma and Correlates With Lower Induction Response by Pei Li, Xiyao Han, Yinghua Xie and Yihan Liu in Technology in Cancer Research & Treatment
Supplemental Material
Supplemental Material, Supplementary_Figure_2 - Long Noncoding RNA Plasmacytoma Variant Translocation 1 Is Increased in Multiple Myeloma and Correlates With Lower Induction Response
Supplemental Material, Supplementary_Figure_2 for Long Noncoding RNA Plasmacytoma Variant Translocation 1 Is Increased in Multiple Myeloma and Correlates With Lower Induction Response by Pei Li, Xiyao Han, Yinghua Xie and Yihan Liu in Technology in Cancer Research & Treatment
Supplemental Material
Supplemental Material, Supplementary_file - Long Noncoding RNA Plasmacytoma Variant Translocation 1 Is Increased in Multiple Myeloma and Correlates With Lower Induction Response
Supplemental Material, Supplementary_file for Long Noncoding RNA Plasmacytoma Variant Translocation 1 Is Increased in Multiple Myeloma and Correlates With Lower Induction Response by Pei Li, Xiyao Han, Yinghua Xie and Yihan Liu in Technology in Cancer Research & Treatment
Footnotes
Abbreviations
Authors’ Note
Pei Li and Xiyao Han contributed equally to this work. The ethical approval for this study was acquired from the Ethics Committee of Huashan Hospital, Fudan University. The approval number of ethics committee was No. 2015-422. The written informed consents were provided by the patients before enrollment.
Funding
The author(s) received no financial support for the research, authorship, and/or publication of this article.
Supplemental Material
Supplemental material for this article is available online.
References
Supplementary Material
Please find the following supplemental material available below.
For Open Access articles published under a Creative Commons License, all supplemental material carries the same license as the article it is associated with.
For non-Open Access articles published, all supplemental material carries a non-exclusive license, and permission requests for re-use of supplemental material or any part of supplemental material shall be sent directly to the copyright owner as specified in the copyright notice associated with the article.