
Abstract
Background and Aim:
Although the prognosis of nasopharyngeal cancer largely depends on a classification based on the tumor-lymph node metastasis staging system, patients at the same stage may have different clinical outcomes. This study aimed to evaluate the survival prognosis of nasopharyngeal cancer using machine learning.
Settings and Design:
Original, retrospective.
Materials and Methods:
A total of 72 patients with a diagnosis of nasopharyngeal cancer who received radiotherapy ± chemotherapy were included in the study. The contribution of patient, tumor, and treatment characteristics to the survival prognosis was evaluated by machine learning using the following techniques: logistic regression, artificial neural network, XGBoost, support-vector clustering, random forest, and Gaussian Naive Bayes.
Results:
In the analysis of the data set, correlation analysis, and binary logistic regression analyses were applied. Of the 18 independent variables, 10 were found to be effective in predicting nasopharyngeal cancer-related mortality: age, weight loss, initial neutrophil/lymphocyte ratio, initial lactate dehydrogenase, initial hemoglobin, radiotherapy duration, tumor diameter, number of concurrent chemotherapy cycles, and T and N stages. Gaussian Naive Bayes was determined as the best algorithm to evaluate the prognosis of machine learning techniques (accuracy rate: 88%, area under the curve score: 0.91, confidence interval: 0.68-1, sensitivity: 75%, specificity: 100%).
Conclusion:
Many factors affect prognosis in cancer, and machine learning algorithms can be used to determine which factors have a greater effect on survival prognosis, which then allows further research into these factors. In the current study, Gaussian Naive Bayes was identified as the best algorithm for the evaluation of prognosis of nasopharyngeal cancer.
Introduction
Tumor-lymph node metastasis (TNM) staging currently ranks first in prediction of the prognosis of nasopharyngeal cancer (NC). However, this system alone is not sufficient for this type of prediction, and patients at the same TNM stage can present with significant clinical heterogeneity and distinct oncologic outcomes. 1 Plasma Epstein-Barr virus (EBV) DNA titer remains the only clinically useful biomarker in patients with NC. 2,3 Nevertheless, the high cost of examining plasma EBV DNA and the large interlaboratory variability prevent its integration into routine clinical practice. 4 Therefore, there is a need for lower cost, objective, and easily detectable markers that can complement the TNM staging system in the evaluation of NC survival prognosis.
The one-size-fits-all approach based on the TNM staging system may not be suitable for every case, with patients at the same TNM stage often having different treatment responses and overall survival rates. It is, therefore, valuable to determine patients with high risk of recurrence and mortality in order to guide treatment. Thus, it is also important to evaluate survival prognosis in this complex and heterogeneous group of diseases and plan the treatment accordingly. Evidence-based medicine is grounded on randomized controlled trials designed with large patient populations. However, the number of clinical and biological parameters that need to be investigated to obtain sensitive results is increasing day by day. 5 It is important to assemble a large and heterogeneous amount of data and construct appropriate models. In order to create such models, traditional statistical methods used in the past are now being gradually replaced by machine learning techniques.
Studies have shown that systemic inflammatory response stimulates cancer and metastasis by facilitating angiogenesis and inhibiting apoptosis. 6 Neutrophil/lymphocyte ratio (NLR) is a biomarker that can precisely show systemic inflammation. 7 Neutrophil/lymphocyte ratio was found to be a poor prognostic factor for many tumor types, 8 but there are also many studies examining the prognostic value of NLR in cases with NC, 9,10 which presents this parameter as a promising prognostic marker for NC. According to these studies, pretreatment NLR can be independent survival prognostic factors for patients with NC.
Factors affecting NC prognosis and the total effect of these factors on prognosis of NC remain to be a topic open to further investigation. To provide answers to related questions, this study examined prognostic factors for survival using machine learning techniques.
Materials and Methods
Patient Characteristics
A total of 72 patients, diagnosed with NC and treated in the Eskisehir Osmangazi University, Radiation Oncology Department between March 2006 and December 2018, were included in the study. The cases were evaluated retrospectively. The inclusion criteria were Karnofsky performance status (KPS) score of ≥60, no distant metastasis, and 18 to 80 years of age. Patients who had previously undergone radiotherapy due to NC, those having a multiple cancer diagnosis, and those with signs of infection at the beginning of treatment were excluded from the study.
All patients had a histopathological diagnosis. The diagnosis of NC was made based on the results of endoscopy-guided biopsy. All patients underwent head and neck magnetic resonance imaging (MRI) and/or computed tomography (CT) and fluorodeoxyglucose positron emission tomography (FDG-PET) CT imaging, as well as brain MRI where necessary. Prior to treatment, the patients were evaluated with a multidisciplinary approach in the head and neck cancer council. Staging was performed using the TNM system (eighth edition) provided by the Union for International Cancer Control/American Joint Committee on Cancer.
Treatment Characteristics
Both T1N1-3M0 and T2-4N0-3M0 cases were given concurrent chemotherapy if not medically contraindicated. Cisplatin chemotherapy was applied at 40 mg/m2 weekly or 80 to 100 mg/m2 every 3 weeks considering age, KPS, and comorbidities of the patients. The patients were seen in the outpatient clinic at least twice a week. Blood tests were performed once a week, and side effects were recorded using the Elekta Mosaiq (version 1.60Y1) and Varian Aria (version 15.6) patient follow-up systems. The oral intake and weight of the patients were monitored once a week, and oral nutritional solution or intravenous nutritional support was provided according to their needs.
The patients were divided into 2 groups according to the radiotherapy modalities used. Three-dimensional conformal radiotherapy was applied between 2006 and 2013, and all patients underwent intensity-modified radiotherapy using the volumetric-modulated arc therapy technique between 2014 and 2018.
Computed tomography simulation was used for treatment planning. The patient’s head, neck, and shoulders were immobilized with a thermoplastic mask with a standard head rest. The head was hyperextended to allow for maximal separation between the primary nasopharyngeal tumor and lymphatics. Computed tomography images were acquired, with slices of 3 to 5 mm. Therefore, MRI, CT, or PET imaging was instrumental in supplementing the information from clinical examination when delineating the tumor volume. The fusion of diagnostic MRI or PET scans to the planning CT was performed to accurately define the gross tumor volume (GTV) and surrounding critical structures.
In general, a total dose of 70 Gy/35 fraction was given to the gross tumor and 50 to 60 Gy for elective treatment of potential risk sites. The high-risk volume comprising the primary nasopharyngeal tumor and lymphadenopathy was treated with 70 Gy. Clinical target volume (CTV) gross disease is composed of GTV gross disease with a 5 to 10 mm margin to account for possible microscopic disease. The CTV subclinical disease included all areas at risk for microscopic spread, including the entire nasopharynx, clivus, base of skull, pterygoid fossae, parapharyngeal space, sphenoid sinus, posterior one-third to one-half of the nasal cavity, posterior ethmoid sinuses, posterior one-third of the maxillary sinuses, and the following lymph node regions: bilateral upper deep jugular (junctional, parapharyngeal), level Ib, level II, level III, level Va, and retropharyngeal nodes. The PTV was generally a 3 to 5 mm expansion of all the CTVs to account for potential setup errors and patient motion. Limiting the margin to 1 mm around the CTV was allowed near the brainstem and spinal cord. Sequential boost technique was used for all patients.
Dose-limiting critical normal structures were delineated on the planning CT including the brainstem, brain, temporal lobe, spinal cord, optic nerves and chiasm, parotid glands, pituitary, middle and inner ears, oral cavity, submandibular glands, thyroid gland, brachial plexus, retinas, lenses, eyes, cochlea, and larynx.
Patient Follow-Up
The patients were called for follow-up at the first posttreatment month, then every 3 months for the first 2 years, every 6 months for the following 3 years (up to 5 years), and yearly follow-up afterward. Detailed head and neck examination and endoscopic evaluation were performed in each follow-up session. The patient response was evaluated using CT/MRI in the first postradiotherapy month and FDG-PET-CT in the third month. During these sessions, thorax CT was performed in the presence of smoking history and clinical indications. Thorax CT was also performed for patients who had complaints, such as cough, sputum, and dyspnea. When local/locoregional recurrence or metastasis was detected, treatment decisions were made by the multidisciplinary council of oncology.
Machine Learning
Simon defined learning as the process of improving behavior through the discovery of new information over time. 11 When the process referred to in this definition is undertaken by machine, it is called machine learning. In this context, the concept of improvement is finding the best solution for future problems based on experience acquired from existing examples in the machine learning process. 11 Development of information technologies over time has led to the emergence of the big data concept, defined as very large and raw data sets that continue to accumulate without a limit and cannot be handled by traditional database methods. 12
Computers perform operations using algorithms by following a certain order without any margin of error. However, in addition to commands generated to obtain an output from the data entered in this way, there are also cases in which the decision-making process takes place based on the sample data already available. In such cases, computers sometimes reach wrong decisions, similar to mistakes people make in the decision-making process. Thus, machine learning is to gain the ability to learn and use data and experiences in a way similar to human brain. 13 The primary aim of machine learning is to create training models to develop themselves and perceive complex patterns to offer solutions to new problems based on available data. 14
Cross-validation is a statistical method used to estimate the ability of machine learning models. It is widely used in applied machine learning to compare and select a model for a given predictive modeling problem because it is easy to understand, easy to implement, and often results in skill estimates that have lower bias than other methods. 15
A confusion matrix contains information on actual and predicted classifications performed by a classification system. The performance of such systems is generally assessed using the data in the matrix. 16
Various machine learning algorithms are used to create prediction models based on clinical data. In the current study, prediction models were generated using the following machine learning techniques: logistic regression, artificial neural network (ANN), XGBoost, support-vector clustering (SVC), random forest, and Gaussian Naive Bayes (GNB). In the analysis of the data set, correlation analysis and binary logistic regression analyses were conducted, and 10 of 17 independent variables were found to affect the result. The variables were age, gender, KPS, weight loss, histopathology, T stage, N stage, TNM stage, tumor diameter, concurrent chemotherapy (+/−), concurrent chemotherapy scheme, number of concurrent chemotherapy, adjuvant chemotherapy (+/−), duration of radiotherapy, radiotherapy wait time, pretreatment NLR, pretreatment LDH, and pretreatment hemoglobin. Significant variables were detected by the Enter Feature Selection Method (significance value .05).
The study was conducted on the data of 72 patients. The survival status of these individuals is shown in Table 1. A balanced data set should be generated for the creation of a machine learning model. The data set was balanced by including in the model as many surviving patients as the number of dead patients, which was low in this case. Thus, the machine learning model was constructed based on the data of 30 (15 deceased and 15 surviving) patients in total; 70% of this data set (21 individuals, 11 deceased, and 10 surviving) was used for machine learning, and the remaining 30% (9 individuals, 4 deceased, and 5 surviving) for testing.
Survival Status of the Patients.

Statistical Analysis
In the analyses, SPSS version 22.0 (IBM Corp, Released 2013. IBM SPSS Statistics for Windows, version 22.0, Armonk, New York: IBM Corp) was used. Kaplan-Meier and Cox model analyzes were performed; P < .05 was considered statistically significant.
Results
A total of 72 patients, 24 (33.3%) female and 48 (66.6%) male, were included in the study, and the median age was 55 (20-76) years. The median tumor diameter was 30 mm (10-60 mm). The most common histopathological subtype was undifferentiated nonkeratinizing squamous cell carcinoma (SCC; 80.6%), followed by differentiated nonkeratinizing SCC (12.5%), keratinizing SCC (5.6%), and adenoid cystic carcinoma (1.6%). According to the TNM classification system, 5 (6.9%) cases were at stage I, 12 (16.7%) at stage II, 34 (47.2%) at stage III, 10 (13.9%) at stage IVa, and 11 (15.3%) at stage IVb. The median follow-up was 50 (4-143) months.
The patient and tumor characteristics are summarized in Table 2. The median duration of radiotherapy was 52 (39-69) days, and the interruption of radiotherapy was 3 (0-15) days. Concurrent chemotherapy was not performed in 14 (19.4%) cases due to the KPS score and medical condition. In the group that received concurrent chemotherapy, cisplatin was administered to 15 patients weekly and 43 patients on a 3 weekly basis. Adjuvant chemotherapy was applied to 57 (79.2%) cases.
Patient and Tumor Characteristics.
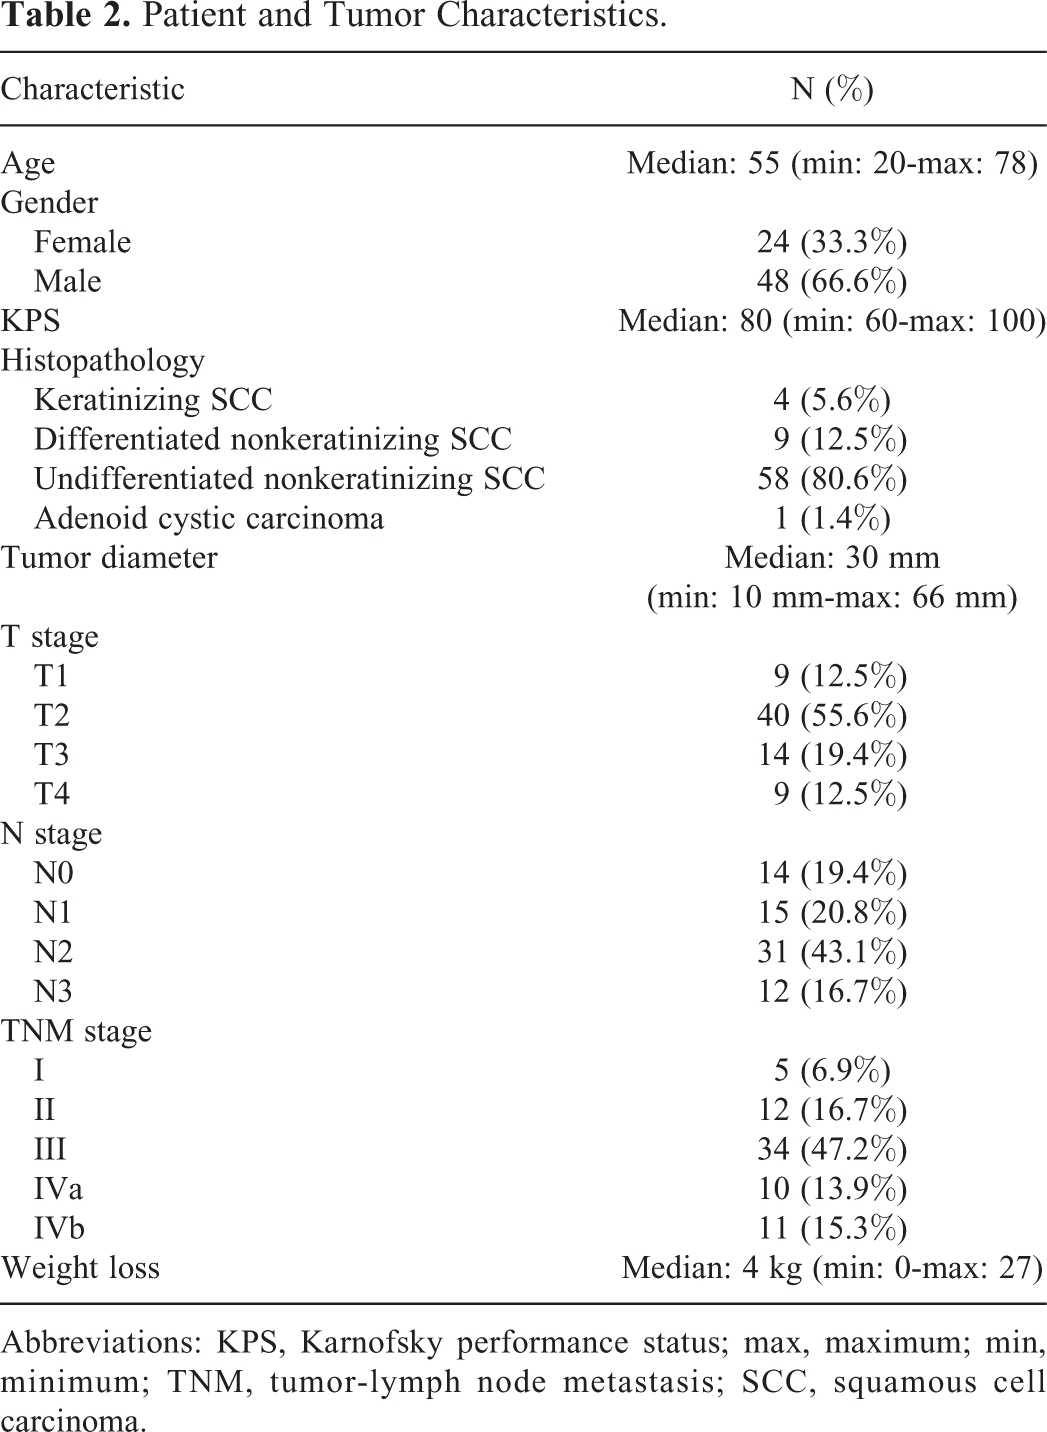
Abbreviations: KPS, Karnofsky performance status; max, maximum; min, minimum; TNM, tumor-lymph node metastasis; SCC, squamous cell carcinoma.
Table 3 presents the treatment characteristics. The median overall survival was 52.5 (6-145) months, and the median disease-free survival was 30 (6-139) months. Kaplan-Meier overall survival analysis is given in Figure 1. In the follow-up, distant metastasis was detected in 13 (18.1%) cases. The median weight loss detected in follow-up sessions during the radiotherapy was 4 (0-27) kg. During the follow-up period, 15 (20.8%) cases died of NC.
Treatment Characteristics.
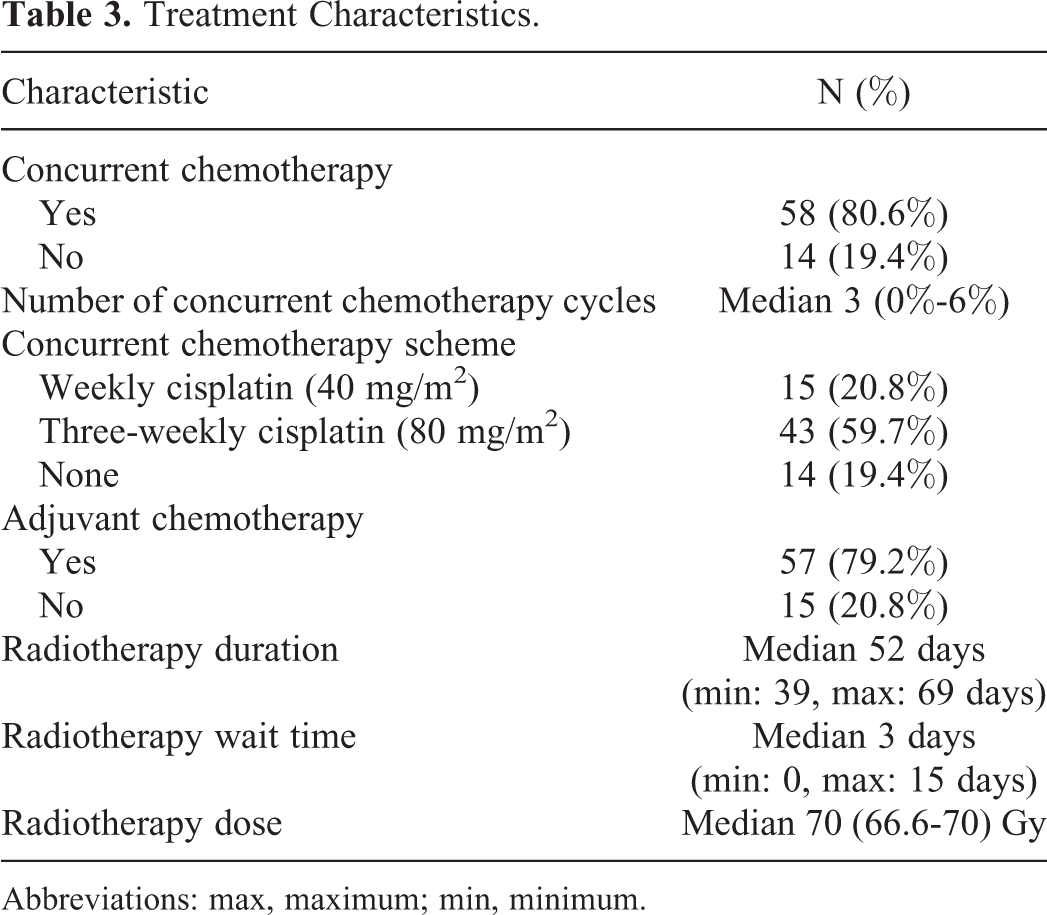
Abbreviations: max, maximum; min, minimum.

Kaplan-Meier overall survival analysis.
In terms of overall survival, univariate analysis showed that KPS, gender, pretreatment NLR, and pretreatment LDH were associated with overall survival (OS). In turn, the multivariate analysis showed that KPS and pretreatment LDH were associated with OS (Table 4).
Cox Regression Analysis: Overall Survival.
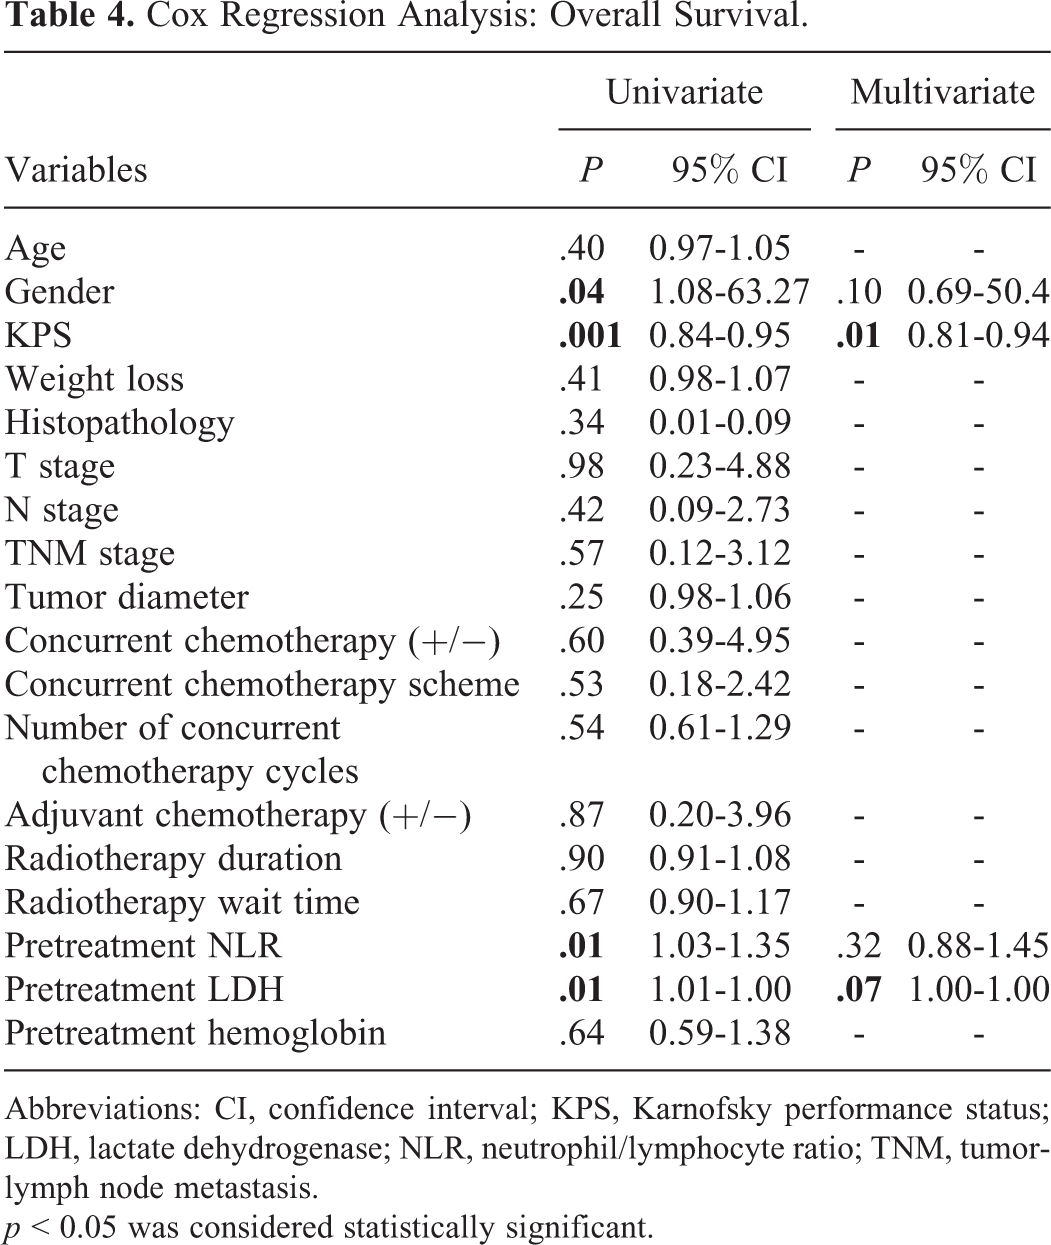
Abbreviations: CI, confidence interval; KPS, Karnofsky performance status; LDH, lactate dehydrogenase; NLR, neutrophil/lymphocyte ratio; TNM, tumor-lymph node metastasis.
p < 0.05 was considered statistically significant.
Significant variables were determined as age, weight loss, initial NLR, initial lactate dehydrogenase (LDH), initial hemoglobin, radiotherapy duration, tumor diameter, number of cases undergoing concurrent chemotherapy, and T and N stages. According to the correlation analysis, the variables with a threshold of 0.6 were eliminated to determine the input variables for the model. The feature importance of the determined variables is given in Figure 2, and the heat map showing the correlation of the best variables is presented in Figure 3.

Impact factors of the variables.

Correlation heat map of the variables.
The machine learning algorithms used namely logistic regression, ANN, XGBoost, SVC, random forest, and GNB had an accuracy of 77%, 88%, 77%, 33%, 66%, and 88%, respectively, in the prediction of NC survival prognosis; and the receiver operator characteristic indexes of these algorithms were 0.83, 0.91, 0.66, 0.50, 0.66, and 0.91, respectively. The results of the algorithms used are summarized in Table 5.
Prognosis Prediction Results of Different Machine Learning Algorithms.

Abbreviations: ANN, artificial neural network; AUC, area under the curve; SVC, support vector clustering.
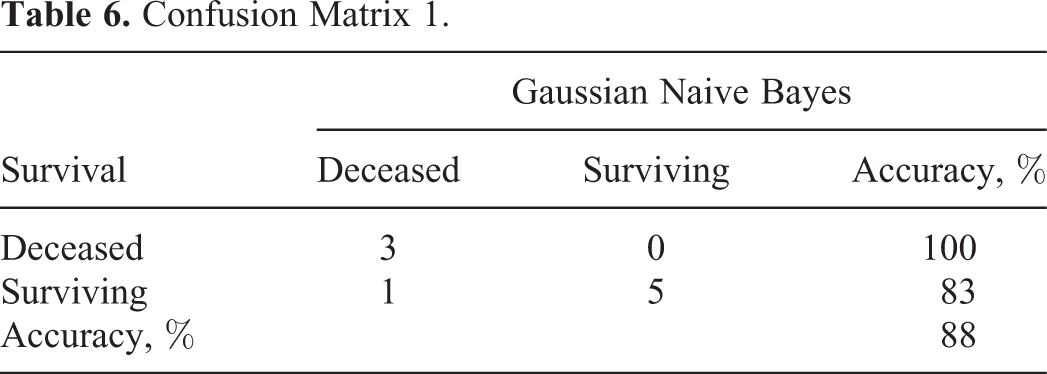
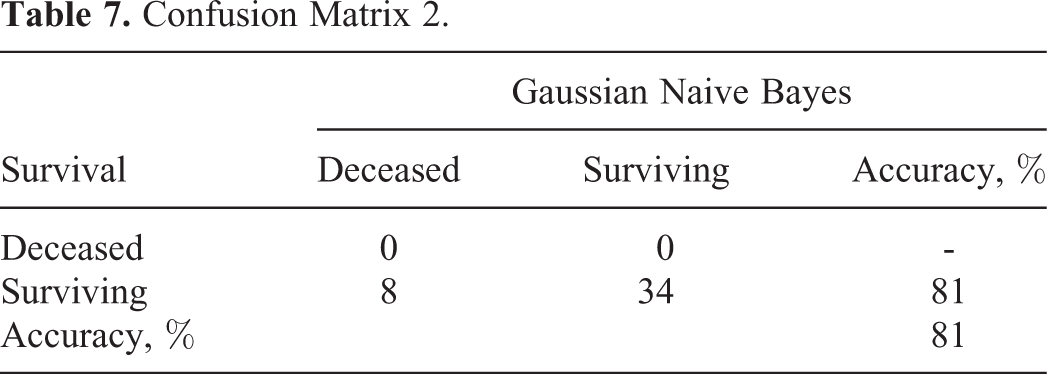
The machine learning model was constructed based on the data of 30 patients in total (15 deceased and 15 surviving); 70% of this data set (21 individuals) was used for machine learning, and the remaining 30% (9 individuals) for testing. Of the 21 patients used in machine learning, 11 were deceased and 10 were alive. Of the 9 patients used in the test, 4 were deceased. Machine learning estimated that 3 of 4 patients died with an accuracy of 88%. The GNB technique was able to predict all of the 3 deceased patients based on the confusion matrix (Table 6). Thus, the success rate of this technique in predicting mortality was 100%. According to the same matrix, of the 6 surviving patients included in the test data, 5 were successfully predicted by GNB, resulting in an accuracy rate of 83% (Table 6). Thus, the success of GNB in predicting disease-related survival was 88%. Model prediction was also performed on the data belonging to the remaining 42 surviving patients who had been previously excluded from the machine learning model to create a balanced data set. The GNB method made an accurate prediction for 34 of these patients but inaccurately classified 8 as deceased. The confusion matrix of these cases is given in Table 7.
Confusion Matrix 1.
Confusion Matrix 2.
The GNB classification involves the use of statistical methods for labeling data. Due to its easy-to-use nature, it is frequently preferred in classification problems. In general, a Bayesian classification aims to calculate the probability values of the effects of each criterion. The GNB method calculates the conditional probability of a class to which the data belongs in order to estimate the probability of that class. To perform these operations, Bayes’ theorem, given below, is used.

where P(A): independent probability of event A, P(B): independent probability of event B, P(B/A): posterior probability of event B given event A, and P(A/B): posterior probability of event A given event B. Using the above equation, it is possible to predict the class of the new data by identifying the cases that result in maximum P(A/B). 16
Discussion
Radiotherapy plus chemotherapy is the primary treatment in NC. Developments in radiotherapy technologies and chemotherapy regimens have resulted in 5-year survival rates of over 75% in this disease, 17 but clinical results are not homogenous in patients at the same TNM stage. 18 Some studies have revealed that certain biological markers, such as serum LDH and plasma EBV DNA, can successfully predict the prognosis of NC cases. 19,20 However, the plasma EBV DNA assay is not yet routinely integrated into clinical practice, and new biological markers are needed to complement the TNM system.
Inflammatory response plays a decisive role in different stages of cancer, including early stage, progression, and metastasis. 6 Among inflammatory cells, neutrophils mediate innate immunity and facilitate initiation and progression of cancer. In contrast, lymphocytes, through recognizing both pathogen-related and tumor-associated antigens, are responsible for specific adaptive immune responses. 21 It has been shown that in cancer, high neutrophil counts are associated with poor prognosis, while high lymphocyte counts are related to completely opposite effects. 22,23 This makes NLR an easily accessible clinical parameter that can assess the status of both neutrophils and lymphocytes, which may have prognostic value in cancer. In a study conducted by An et al with 363 NC cases, progression-free, locoregional recurrence-free, and distant metastasis-free survival rates were found to be worse in cases with an NLR of >3.73. 24 In another study by Sun et al, shorter progression-free survival was seen in patients with NC with an NLR of ≥2.7. 9
Tumor hypoxia is a marker for resistance to chemotherapy and radiotherapy in many tumors, including NC. More than 50% of solid tumors resistant to radiotherapy and chemotherapy have hypoxic regions. 25 The effects of radiation can occur through direct ionization in an organic molecule or indirectly with the help of free radicals. Since cells mostly contain water, most ionization products generated by radiation are found in water molecules. Approximately 60% to 70% of cellular DNA damage caused by ionizing radiation originates from OH. 26 Radiation-dependent free oxygen radicals are also exposed to other reactions. Aerobes have developed antioxidant defenses to protect themselves against oxygen derivatives produced from in vivo or in vitro sources. These include enzymes such as superoxide dismutases, catalase, and glutathione peroxidase; low-molecular agents, for example, α-tocopherol and ascorbic acid; and proteins that bind metal ions in forms that cannot catalyze the formation of free radicals. In contrast to these defense mechanisms, the oxygen molecule has a high affinity to free radicals, which can lead to other steps of radical production, thereby maintaining free radical damage to the important macromolecules of cells (eg, DNA). This indicates the effect of oxygen in radiation damage; that is, well-oxygenated cells are more radiosensitive than hypoxic cells. 27,28 A low hemoglobin level is an indicator of tumor hypoxia. 29 In a study conducted with 149 patients diagnosed with NC, Topkan et al obtained worse results concerning locoregional progression-free survival, progression-free survival, and overall survival in patients with hemoglobin levels of <11.0 g/dL prior to concurrent chemoradiation. 30
Body weight loss during radiotherapy is a common problem in patients with head and neck cancers. Body mass index, a commonly used measure to demonstrate nutritional status in adults, has been shown to be closely related to the prognosis of NC. 31,32 More than 60% of cases with NC receiving curative radiotherapy put on more than 5% weight during treatment. 33 Local advanced stage tumors, such as concurrent chemotherapy, cause predisposition to weight loss, and critical weight loss (5%) has been found to be associated with lower treatment tolerance and worse prognosis in head and neck cancers. 34,35
Lactate dehydrogenase is an enzyme analyzed in serum before treatment and has been defined as a prognostic factor in various malignancies, including renal cell carcinoma, melanoma, gastric, prostate, breast and lung cancers, and NC. 36 -38 High aerobic glycolysis is one of the primary metabolic changes that occur in the process of malignant transformation. Lactate dehydrogenase, catalyzing reversible transformation of pyruvate to lactate, plays an important role in anaerobic glycolysis. 39 It has also been described as a poor prognostic factor in cancers of solid organs, such as non-small cell lung cancer and colorectal cancer. 40,41 After evaluating 14 803 patients with an NC diagnosis, Zhang et al reported that high LDH levels before treatment were associated with poor overall, progression-free and distant metastasis-free survival. 42 In this study, significant variables were determined as age, weight loss, initial NLR, initial LDH, initial hemoglobin, radiotherapy duration, tumor diameter, number of cases undergoing concurrent chemotherapy, and T and N stages.
Machine learning is a subfield of artificial intelligence that involves development of algorithms that obtain model and parameters best representing the available data. Each learning process consists of 2 stages: (1) predicting the unknown parameters in a system from a specific data set and (2) using these parameters to predict new outputs of the system. 43 Evidence-based medicine is grounded on randomized controlled trials designed with large patient populations. Today, in cancer prognosis, the amount of data to be examined and interpreted is rapidly increasing. With machine learning, future clinical trials can be better planned and new findings can be obtained using the available data. In recent years, machine learning approaches have emerged as an alternative tool for model generation. With the fundamental developments in handling complex and large data sets, machine learning-based clinical decision support systems, merging multidimensional data, are increasingly used in the area of medicine. 44
A review of the literature revealed a limited number of studies evaluating survival and prognosis in NC using machine learning. Wan et al evaluated 79 cases with locally advanced-stage NC by including the data of 48 of these patients in the learning group and 49 in the test group. The authors assessed molecular biomarkers and used 3 different models with the SVM algorithm. The sensitivity and specificity values in prognosis evaluation were reported as 88% and 81.9%, respectively, for SVM1 containing 7 molecular biomarkers and 84% and 95%, respectively, for SVM2 consisting of 12 molecular biomarkers. SVM3, combining SVM1 and SVM2 models, had a sensitivity of 88% and specificity of 90.3%. 45 In the current study, the effect of clinical parameters on survival was estimated by machine learning and GNB algorithm had a sensitivity of 75% and specificity of 100%.
In another study by Zhang et al, radiomic models and machine learning methods were evaluated for the prediction of local recurrence and distant metastasis. A total of 110 cases with locally advanced NC were included in the study, and for each patient, 970 radiomic features were obtained from the MRI. Among the machine learning algorithms, the best results for the local recurrence and distant metastasis evaluation were obtained from the random forest + random forest combination as the feature selection and classification methods (area under the curve: 0.8464 ± 0.0069, test error: 0.3135 ± 0.0088). 46
In the current study, the survival evaluation of 72 patients with NC was performed using 6 different machine learning algorithms, and the best results were obtained from the GNB technique. During the median 50-month follow-up after the completion of radiotherapy, the case survival estimated using the GNB algorithm was found to have an accuracy rate of 88%.
Accurate prognostication of NPC will benefit patients for tailored therapy. The important challenge complementing the anatomic TNM staging prognostication is to integrate the clinical parameters. Our finding demonstrated that GNB algorithm showed the powerful efficacy in prediction of patient’s survival individually, indicating the promising clinical usage in future therapeutic and follow-up management.
Cancer biology cannot be explained only with the TNM stage. Therefore, factors that may affect survival such as age, gender, KPS, weight loss, histopathology, T stage, N stage, TNM stage, tumor diameter, concurrent chemotherapy (+/−), concurrent chemotherapy scheme, number of concurrent chemotherapy, adjuvant chemotherapy (+/−), duration of radiotherapy, wait time for radiotherapy, pretreatment NLR, pretreatment LDH, and pretreatment hemoglobin were evaluated by machine learning in this study. The treatment decision is made according to the TNM stage. However, TNM staging only is inadequate for prognosis. In order to provide a more accurate treatment, clinical factors are used in the staging system in some tumor types such as testicular cancer, oropharyngeal cancer, and sarcomas. When deciding on cancer treatment, clinical factors may need to be as effective as the TNM staging system.
Conclusion
Machine learning is a subfield of artificial intelligence that involves development of algorithms that obtain model and parameters best representing the available data. Today, the amount of data to be examined and interpreted in cancer prognosis is rapidly increasing. With machine learning, future clinical trials can be better planned and new findings can be obtained using the available data. To our knowledge, this is the first study to evaluate the effect of clinical factors on survival through machine learning. In the current study, the best results were obtained with the GNB technique for survival evaluation in NC. This finding will be reviewed again in the following years with an enhanced data set.
Footnotes
Authors’ Note
This study was approved by the Eskisehir Osmangazi University Ethical Committee (approval no: 25403353-050.99-E.56923). All patients provided written informed consent prior to enrollment in the study.
Declaration of Conflicting Interests
The author(s) declared no potential conflicts of interest with respect to the research, authorship, and/or publication of this article.
Funding
The author(s) received no financial support for the research, authorship, and/or publication of this article.