
Abstract
Purpose:
To optimize collimator setting to improve dosimetric quality of pancreas volumetric modulated arc therapy plan for stereotactic body radiation therapy.
Materials and Methods:
Fifty-five volumetric modulated arc therapy cases in stereotactic body radiation therapy of pancreas were retrospectively included in this study with internal review board approval. Different from the routine practice of initializing collimator settings with a template, the proposed algorithm simultaneously optimizes the collimator angles and jaw positions that are customized to the patient geometry. Specifically, this algorithm includes 2 key steps: (1) an iterative optimization algorithm via simulated annealing that generates a set of potential collimator settings from 39 cases with pancreas stereotactic body radiation therapy, and (2) a multi-leaf collimator modulation scoring system that makes the final decision of the optimal collimator settings (collimator angles and jaw positions) based on organs at risk sparing criteria. For validation, the other 16 cases with pancreas stereotactic body radiation therapy were analyzed. Two plans were generated for each validation case, with one plan optimized using the proposed algorithm (Planopt) and the other plan with the template setting (Planconv). Each plan was optimized with 2 full arcs and the same set of constraints for the same case. Dosimetric results were analyzed and compared, including target dose coverage, conformity, organs at risk maximum dose, and modulation complexity score. All results were tested by Wilcoxon signed rank tests, and the statistical significance level was set to .05.
Results:
Both plan groups had comparable target dose coverage and mean doses of all organs at risk. However, organs at risk (stomach, duodenum, large/small bowel) maximum dose sparing (D0.1 cc and D0.03 cc) was improved in Planopt compared to Planconv. Planopt also showed lower modulation complexity score, which suggests better capability of handling complex shape and sparing organs at risk .
Conclusions:
The proposed collimator settings optimization algorithm successfully improved dosimetric performance for dual-arc pancreas volumetric modulated arc therapy plans in stereotactic body radiation therapy of pancreas. This algorithm has the capability of immediate clinical application.
Keywords
Background
Pancreatic cancer was the fourth highest cause of cancer mortality in the United States in 2015, with a 5-year survival rate of 8%, and over 50% of the patients who had developed metastasis reported a 5-year survival rate of only 3%. 1 Challenges of treating pancreatic cancer include the long latency period, 2 high recurrence rate, 3 and the lack of curative treatment methods other than surgical resection, 4,5
Stereotactic body radiotherapy (SBRT) is an emerging treatment technique for neoadjuvant or adjuvant radiotherapy of surgical resection for pancreatic cancer. 6,7 With improvements in systemic therapies, SBRT becomes increasingly critical to therapeutic management of pancreatic cancer as a local regional therapy. Typically, SBRT delivers 35 to 50 Gy (5.0-7.0 Gy/fx) to the region of vessel involvement and 25 to 30 Gy (5.0-6.0 Gy/fx) to the rest of the planning target volume (PTV). 8 Several advantages of SBRT over conventional fractionated chemoradiotherapy exist (1.8-2.0 Gy/fx, 45-60 Gy in total (4)), including (1) SBRT can kill tumor cells through hypofractionated dose by direct cytotoxicity as well as other mechanisms such as stromal and vascular damage 9 -11 ; (2) SBRT avoids the delay of full-dose chemotherapy, as the treatment time is reduced from up to 6 weeks to 1 week 12 ; and (3) acute complications are rare and toxicity levels are acceptable. 13,14 Recent data showed that local recurrence dropped from up to 86% to around 20% after receiving SBRT for a year. 13 Stereotactic body radiation therapy was also proven to benefit patients with unresectable tumors 15,16 or isolated locally recurring tumors after resection. 17,18
Volumetric modulated arc therapy (VMAT) has a higher delivery efficiency and improved dose conformity compared to static intensity-modulated radiation therapy (IMRT) in delivering SBRT. 19,20 The improved dose conformity of VMAT over IMRT could be caused by the combination of an increased number of angular positions for the radiation beam and additional modulations available via the combination of dose rate and gantry rotation speed. 21 Challenges of pancreas SBRT VMAT planning include the complex tumor/organ at risk (OAR) geometry and the proximity of surrounding OARs with prioritized dose limits allotted to the gross tumor volume. Moreover, respiratory motion induces target motion and deformation, requiring an additional margin for the treatment target region. This additional margin further reduces the separation between the target and the OARs, potentially creating or enlarging target/OAR overlapping. Therefore, such SBRT planning requires considerable efforts. While meeting maximum dose constraints to proximal gastrointestinal (GI) OARs (stomach, large/small bowel, and duodenum) is prioritized, improvements in target coverage may need a few trials by even experienced planners before reaching the ideal balanced dosimetric results. 18
Of the many factors that can influence dosimetric outcomes in VMAT planning, collimator settings (CS) selection (including collimator angles and jaw positions) is the one evaluated in this project. Collimator angles and jaw positions may affect OAR sparing when the PTV projections in beam eye views (BEVs) are nonconvex or contain separated subvolumes, 22 -25 since the multi-leaf collimator (MLC) can only move along 1 direction. Previous studies demonstrated that dose coverage and dose–volume histogram (DVH) statistics were related to collimator angle selections in VMAT. 26 -29 However, in clinics, collimator parameters are commonly set by a template with default values following institutional guidelines and conventions. One common practice is employing dual arcs with symmetric collimator angles (eg, 30° and 330°) and full rotations. Jaw apertures are set manually or semi-automatically to include all PTV segments in all BEVs. We believe that treatment plan quality can be improved by balancing target coverage and OAR sparing through additional CS optimization based on individual anatomy and dose constraints.
In this study, a CS optimization technique was developed for dual-arc pancreas VMAT SBRT. For each individual case, a group of dual-arc CS candidates was generated using simulated annealing optimization. This iterative optimization was built upon a thorough analysis of patient anatomy in a pancreas SBRT case library. The final CS was then determined by a scoring system that evaluates MLC modulation capability in both target shaping and OAR shielding.
Materials and Methods
Figure 1 summarizes the workflow of this study, which has 2 core components: (1) an iterative optimization that generates a group of CSs candidates and (2) an MLC modulation efficiency evaluation that selects the final CSs using a scoring system.
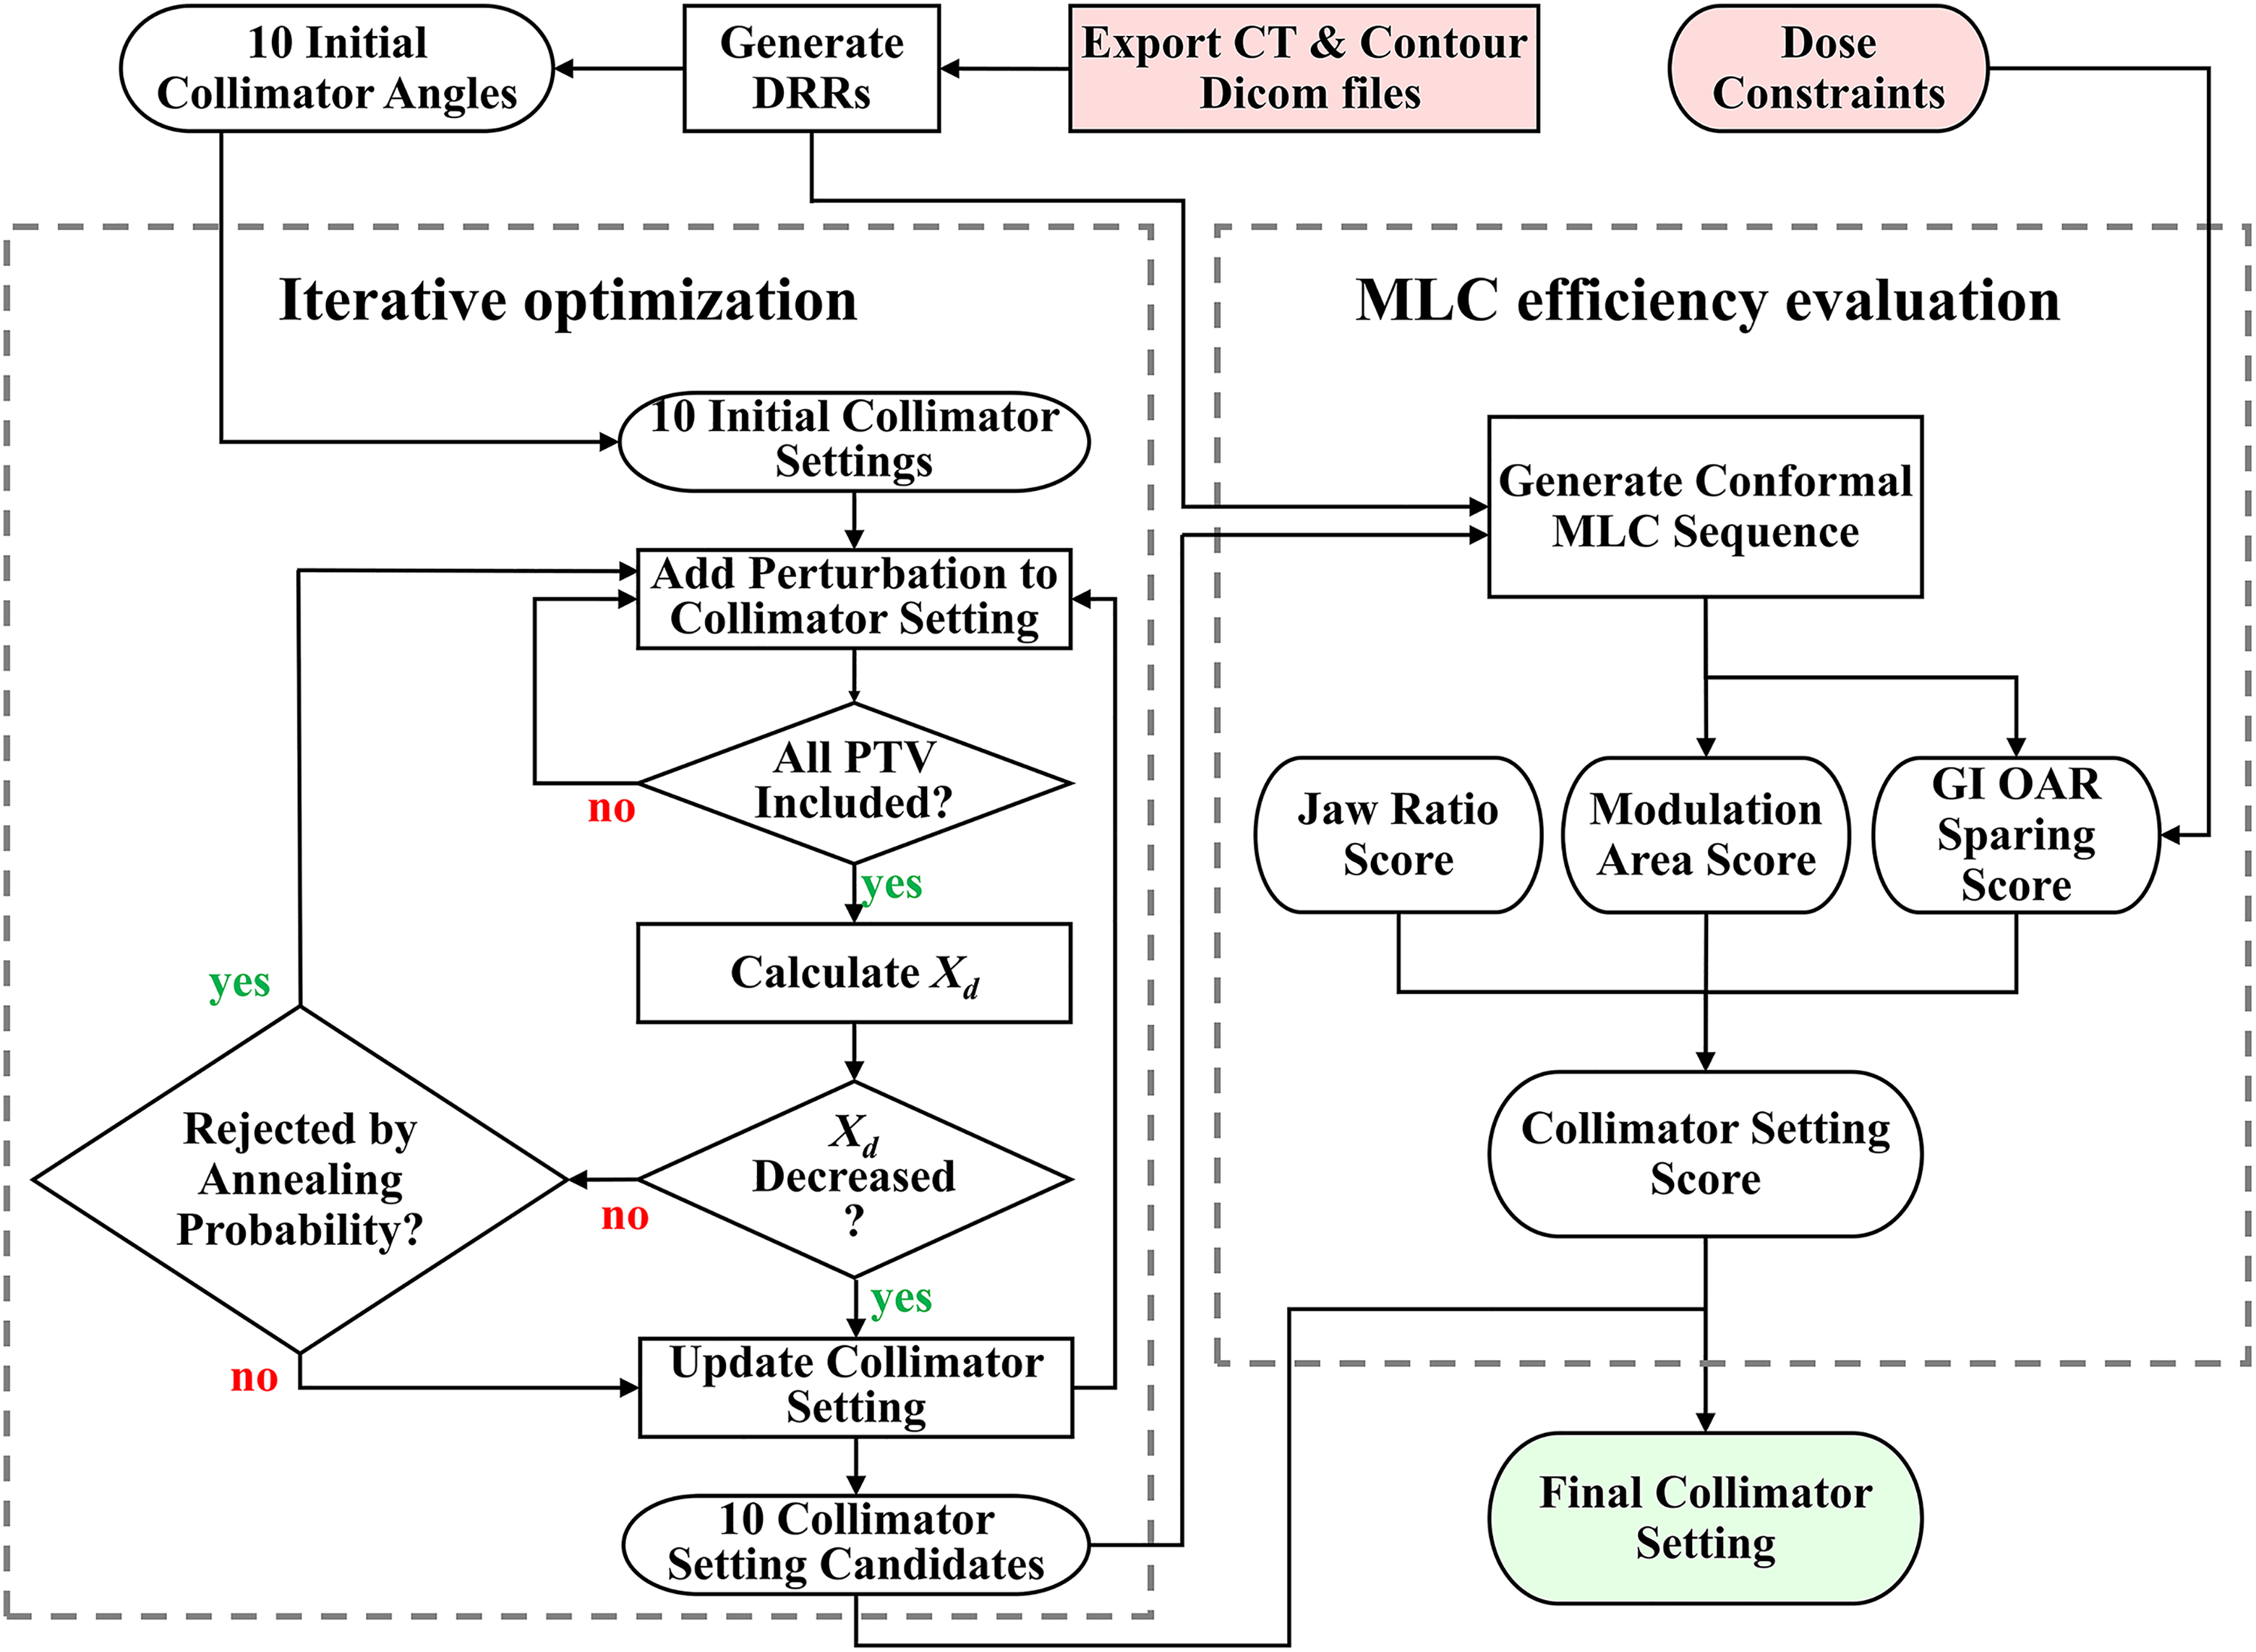
Flowchart of the proposed collimator angle optimization algorithm. Red blocks are inputs, and green block is output. Xd indicates the larger jaw opening value of the dual-arc pair in the X direction (multi-leaf collimator [MLC] motion direction).
Determination of Initial Collimator Angles
To determine the optimal CS of an individual case, the proposed algorithm started from 10 predetermined collimator angle pairs to search for the optimal CS. Specifically, these initial collimator angles (CSa,i, i = 1,2,.10) were used as starting points in the iterative optimization part of Figure 1. To determine CSa,i, a case library that consists of 39 dual-arc VMAT pancreas SBRT cases was analyzed. Critical planning structure contours, including PTV, boost PTV (if prescribed), large/small bowel, duodenum, and stomach, were exported to an in-house software package written in MATLAB (MathWorks, Natick, Massachusetts). Digitally reconstructed radiographs (DRRs) of all BEVs pertaining to each structure were generated. For each case, an exhaustive search was performed to find all possible dual-arc CS under the condition that each PTV voxel must be included in all BEVs by at least 1 arc (condition A). The optimal CS was selected as the one with the smallest value of Xd, which is the larger jaw size in the X direction (parallel to MLC motion direction) of dual arcs. Ten collimator angle pairs were determined from the library cases and were used as the initial collimator angles CSa,i.
Determination of CS Candidates
This step adds customization to the CSa,i that were determined from 39 previous case pool. Starting from CSa,i, the CS is iteratively adjusted to further optimize the balance between PTV coverage and OAR sparing using simulated annealing optimization. Simulated annealing techniques are implemented to make the adjustments in iterations. Inspired by a classic thermodynamic method in Monte Carlo simulation, simulated annealing applies unfavorable perturbation under regulation during the optimization to avoid local minimum trapping. 30
The iterative optimization started from each of the 10 CSa,i. At each iteration step, a random perturbation (< ±4 mm for jaw positions and < ±2° for collimator angle) was added to the current results. If condition A (defined above) was violated, the program would continue to the next loop; otherwise, the Xd (defined above) would be calculated and compared with the one from the last loop. If Xd decreases, the perturbed CS would be accepted; otherwise, the perturbed CS would be accepted with an annealing probability P:

where i is the iteration number, k is a constant that controls the speed of annealing, and ΔXd is the increase in Xd. When CSs had not been changed for 200 loops, the iteration ended and yielded a CS candidate. Constraints were added to avoid unreasonable settings, such as identical collimator angles in dual-arc pairs and extremely small jaw sizes (openings). Upon completion, 10 CS candidates are prepared for the final selection process.
Determine the Final Optimal CS
To determine the final CS, a collimator setting score (CSS) was designed to evaluate the generated CS candidates, as shown on the right part of Figure 1. The CSS focused on the MLC’s modulation capability of target shaping and OAR shielding. Starting with each candidate setting, a dynamic MLC sequence of dual-arc pairs was generated to conform to 2D non-OAR PTV projections (ie, PTV − proximal GI OARs) in all BEVs. The CSS was calculated based on the MLC sequences. Specifically, a CSS consists of 3 parts.
Jaw ratio score
Jaw ratio score (JS) is defined as:

where FRa is the ratio of jaw opening in the Y direction to the X direction after simulated annealing optimization and FRi is the corresponding value in the initial CS before the optimization. JS was calculated separately for each of the 2 arcs and then averaged. JS penalizes the ratio of jaw openings in the Y and X directions.
Modulation area score
Modulation area score (MS) penalizes the static MLC areas in a dynamic MLC sequence that are not used for modulation aperture shaping but are within the jaw opening. It is defined as:

where Aj is the area of jaw aperture and As is the area of the static MLC area. Modulation area score was calculated separately for each of the 2 arcs and then averaged.
Gastrointestinal OAR sparing score
The GI OAR Sparing Score (GS) evaluates MLC’s potential of OAR dose sparing. The GS relies on the assumption that the maximum dose sparing of each OAR is proportional to the 2D area of its DRRs shielded by the MLC in all BEVs. The GS is then defined as:

where SPP/O is the percentage of PTV/OAR 2D projections shielded by the generated dynamic MLC sequence, DR is the dose prescription, and DC is the maximum dose constraint of the OAR. The GS was calculated for each OAR and each arc and then averaged.
The CSS was designed as the multiplication of these 3 scores:

The final set of CSs would be the candidate with the highest CSS.
Validation and Plan Evaluation of the Proposed Optimization Technique
To validate the proposed algorithm in pancreas SBRT planning, a dosimetry study was performed to compare key dosimetric results of the plans generated with the optimized CS (Planopt) and with the conventional CS (Planconv). In this part, 16 cases with pancreas SBRT that were not included in the previously mentioned case library were studied. Patient information can be found in Supplemental Appendix. Among these 16 patients, 5 patients were planned with Varian TrueBeam machine and 11 patients were planned with Varian TrueBeam STx machine (Varian Medical System, Palo Alto, California) with high-definition MLC. Treatment planning was performed using Eclipse v13.7 software. Dose calculations were carried out by the anisotropic analytical algorithm with 1-mm grid resolution. To minimize human planning bias, an identical set of planning structure contours and DVH dose constraints determined by an experienced planner was used during VMAT optimization for each case. Jaw tracking was not included per our institutional guidelines. Primary dosimetric parameters are the target dose coverage and the maximum OAR dose (D0.03 cc and D0.1 cc). Root target conformity index (CIr) 31 and mean dose to all OARs were also compared. In addition, Planopt and Planconv were evaluated by MCS 32 and weighted MLC opening (Aw) as quantitative assessments of plan modulation intensity. Aw is defined as:

where Fw,i is the field weight of the arc number i (i = 1, 2), MUw,j,i is the MU weight of the arc number i and control point number j (j = 1, 2,…, 178), and MOj,i is the MLC opening of the arc number i and control point number j. Therefore, Aw measures the weighted average of beam aperture size shaped by the dynamic MLC sequence, and its value is inversely correlated with modulation strength. Wilcoxon signed rank tests were performed to compare these parameters between the paired Planconv and Planopt, and the statistical significance level was set to .05.
Results
Figure 2 shows an example plan comparison of Planopt (left) and Planconv (right) from a selected study case. Primary PTV is illustrated by the cyan segment (prescribed with 500 cGy × 5 fx), and boost PTV is illustrated by the red segment (660 cGy × 5 fx). Isodose distributions in both plans showed decent target coverage and reasonable gradient distribution. Specifically, dose coverages were similar between Planopt (V25 Gy = 97.9% to PTV, V33 Gy = 96.7% to PTV boost) and Planconv (V25 Gy = 98.0% to PTV, V33 Gy = 96.7% to boost PTV). The maximum dose constraints (3300 cGy) to the proximal GI OARs, stomach (yellow), duodenum (dark blue), and large bowel (dark green), were all met in both plans. In a detailed comparison with Planconv, Planopt demonstrated improved boost PTV dose conformity in the axial view (Figure 2A) and the sagittal view (Figure 2B) as shown by yellow arrows. In terms of OAR sparing, Planopt achieved better maximum dose sparing of large bowel (dark green) in Figure 2C. Indicated by blue arrows, the 3300 cGy (max dose limit) isodose line in Planopt abutted the large bowel’s concavity space and stayed apart from the protruding segment. In contrast, the same isodose line in Planconv did not spared large bowel as much as in Planopt. Figure 2D also indicated improved stomach (yellow) sparing by Planopt: While both plans met the maximum dose limit (3300 cGy) of stomach, Planopt spared more stomach volumes from high isodose levels (3135 cGy, white) in the sagittal view. In terms of quantitative results, Planopt reduced the maximum dose (at 0.1 cc) to the large bowel (3199 cGy), stomach (3130 cGy), and duodenum (3199 cGy) in comparison to Planconv (3247 cGy, 3217 cGy, and 3218 cGy, respectively). In addition, the mean dose to the kidneys and liver was slightly improved in Planopt.

Dose distribution comparison of Planopt (left) and Planconv (right) from a selected case. Yellow arrows in (A) and (B) indicate the comparison of dose conformity, and blue arrows in (C) and (D) indicate the comparison of organs at risk (OAR) sparing. Primary planned target volume (PTV25 Gy) is shown in cyan, and PTV33 Gy is shown in red. Proximal OARs are shown in yellow (stomach), dark blue (duodenum), and dark green (large bowel). Isodose lines are shown in yellow (3300 cGy) and white (3135 cGy). Planopt indicates proposed algorithm; Planconv, plan with the template setting.
Figure 3 shows the comparison of key dosimetric outcomes of Planconv and Planopt in all 16 cases. As illustrated, dose coverage and dose conformity to primary PTV and boost PTV (if prescribed) of Planconv and Planopt were comparable. In contrast, D0.1 cc and D0.03 cc of all proximal GI OARs decreased in Planopt compared to Planconv, and these reductions were statistically significant except for stomach D0.1 cc. Median value of OAR mean dose results of 16 studied cases are also reported in Table 1. Generally, mean dose results in Planopt and Planconv were comparable with minimal differences.

Comparison of the dose statistics (normalized to prescription dose value) in Planconv and Planopt.*Statistical significance. Planopt indicates proposed algorithm; Planconv, plan with the template setting
Dose Statistic Results of Planconv and Planopt, as shown in Figure 3.a

Abbreviations: OAR, organs at risk; Planopt, proposed algorithm; Planconv, plan with the template setting.
a The reported dose was the median of the 16 studied cases.
b Statistical significance.
Figure 4 shows the comparison of MCS and Aw. As illustrated, both MCS and Aw showed lower values in Planopt (medians are 0.2078 and 21.99 cm2, respectively) than Planconv (medians are 0.2378 and 28.33 cm2, respectively) with statistical significance. This observation suggests that Planopt generally has stronger MLC modulation. In addition, the median MU values of Planopt in the studied cases was 1775.0, which was higher than the corresponding values of Planconv (1534.2). This MU result is consistent with MCS and Aw studies.

Comparisons of the modulation complexity score, weighed multi-leaf collimator (MLC) opening, and total MU between Planconv and Planopt. Both tests were of statistical significance. Planopt indicates proposed algorithm; Planconv, plan with the template setting.
Discussion
Pancreas SBRT plans generated using our proposed jaw-angle optimization algorithm demonstrated improved dosimetric outcomes when compared to the plans with current clinical CSs without extensive computation. In addition, the proposed technique does not require any changes to the delivery of VMAT plans, as in colli-VMAT, 33 so it can be easily integrated into the current treatment planning workflow.
The rationale of library analysis was to provide reasonable starting points for the simulated annealing optimization (Figure 1). These library cases were analyzed by an exhaustive search as described in the Methods section. To explain the selection of these initial settings, Figure 5 shows the summarized results of the library analysis and the 10 initial collimator angle pairs. In this figure, all accepted CSs were mapped to a 2D plane composed of 2 collimator angle parameters of dual-arc pairs as independent variables represented by gray scale value, and the 10 initial collimator angle pairs were represented by red dots. The 2D map was symmetric to the plane center (90°, 90°) because angles with 180° difference were equivalent (ie, X1/X2, Y1/Y2, and arc1/arc2 were exchangeable). The upper left quadrant showed a scattered distribution with latent linear trends along the quadrant’s positive diagonal. Although not substantial, these trends may suggest that orthogonal or near-orthogonal collimator angles in dual-arc pairs might be favored. This deduction also agrees with common sense in clinical practice that orthogonal collimator angles enable MLC modulation in 2 directions, which brings additional modulation capabilities on interplane (superior–inferior) direction. As illustrated by red dots in Figure 5, the 10 settings covered the region with high occurrences and were distributed at a rather even interval in the 2D plane following the latent trend in the exhaustive search results. Hence, these 10 initial settings would suffice as initial values in iterative optimization.

Illustration of the initial collimator settings in the dual collimator angles plane. Each pixel value in the figure is the occurrence count of the desirable collimator angle pairs of 39 library cases. Please note that each case could have multiple desirable collimator angle pairs with similar Xd. Red dots represent the selected initial CSa,i.
The proposed iterative optimization workflow utilizes simulated annealing to optimize CSs for each case. The advantages of simulated annealing include higher computation efficiency compared to exhaustive search and decreased possibility of local minima trapping compared to gradient search. Two adaptations were made to the classic simulated annealing algorithm in this study: (1) The initial CSs were selected from an analysis of 39 prior cases, and (2) The perturbations added to the CSs in each iteration varied with the number of iteration steps. On our workstation (Intel Xeon E5-2640 v4, 64G RAM), the exhaustive search method required 2 to 6 hours (depending on the target geometry complexity) to find optimal jaw settings for each case. In contrast, the proposed iterative optimization took about 7 seconds on average for each case and each initial CS. The time of each iterative optimization may vary due to the stochastic nature. The longest one observed was 15 seconds. Such efficiency improvement suggests the feasibility of the proposed method in clinics. In addition, the accuracy of the results in the simulated annealing optimization was not compromised by the improved computation efficiency. Figure 6 shows the experiment results comparing the annealing optimization and exhaustive search of studied cases. As demonstrated in Figure 6A, the optimized collimator angle pair results from the proposed simulated annealing algorithm clustered on a positive diagonal region. The exhaustive search results, illustrated as red dots in Figure 6B, agreed well with the results in Figure 6A. A few red dots scattered at boundary regions in Figure 6B representing the results with extreme jaw positions, and these results could be excluded using current clinical paradigms. In short, the proposed optimization posed both high accuracy and high efficiency.

Collimator angle pair results from (A) simulated annealing optimization and (B) exhausting search (red dots) overlapped to the results from simulated annealing optimization. These 2 methods show good coincidence with each other.
As shown in Figure 4 (and Table 1), Planopt showed lower MCS and Aw than Planconv. In addition, Planopt had higher MU numbers. These quantitative results suggest that Planopt had higher modulations in MLC sequences, which is a reasonable cost for improving dosimetric outcomes. Heavier modulation in complex plans may not be the primary concern in the current clinical workflow using an accurately configured treatment planning system. Recent studies from imaging and radiation oncology core suggest that treatment delivery accuracy performance is not associated with treatment plan complexity. 34 To prove the delivery accuracy of the more complex Planopt plans, a treatment verification comparison was implemented. Planopt and Planconv from 5 cases planned for a Varian TrueBeam LINAC were verified by Mobius3D software (Mobius Medical Systems, Houston, Texas). For each plan, 3D dose distribution calculated by Mobius3D was compared to the one by Eclipse using gamma analysis in a 3D fashion. To verify delivery accuracy, this dose distribution was used as the ground truth and was compared to the reconstructed one using the acquired TrueBeam trajectory log file during delivery. In short, there was no difference between Planopt and Planconv from the perspective of deliverability. The median of a passing rate under 3%/3 mm was 99.54% ± 0.47% and 99.34% ± 0.86% for Planopt and Planconv, respectively. All OAR maximum dose differences in Planopt and Planconv were not larger than 0.1 Gy. These results indicate that Planopt can be accurately delivered on LINAC. Such indication also supports imminent clinic application of the proposed collimator optimization algorithm.
The proposed algorithm focused on the dual-arc VMAT regime that was the most commonly used technique for pancreas SBRT at our institution. Inclusion of additional arcs may further improve the dosimetric outcomes but may not be desired due to longer treatment time, especially for patients who need a breath-hold motion management and who have problems lying flat on the treatment couch. With further development, the proposed algorithm can be extended to multiple-arc (>2) VMAT. Another possible future research direction is the further tuning of the MLC efficiency scoring system. The designed scoring scheme in this work was determined by our extensive clinical experience. However, the exact quantitative relationships between each score and the selected dosimetric outcomes were unknown. Further studies with a larger cohort size would facilitate the modeling of such correlations and enable the extension to other treatment sites.
Conclusion
In this work, a CS optimization algorithm for dual-arc VMAT pancreas SBRT was successfully developed. The plans generated with the CSs from the proposed algorithm had improved dosimetric quality in comparison to the plans generated with the default CSs. The proposed algorithm was demonstrated with great clinical feasibility and readiness.
Supplemental Material
Supplemental - A Collimator Setting Optimization Algorithm for Dual-Arc Volumetric Modulated Arc Therapy in Pancreas Stereotactic Body Radiation Therapy
Supplemental for A Collimator Setting Optimization Algorithm for Dual-Arc Volumetric Modulated Arc Therapy in Pancreas Stereotactic Body Radiation Therapy by Xinyi Li, Jackie Wu, Manisha Palta, You Zhang, Yang Sheng, Jiahan Zhang and Chunhao Wang in Technology in Cancer Research & Treatment
Footnotes
Abbreviations
Authors’ Note
This study was a retrospective study under the Duke University Medical Center IRB approval Pro00102095.
Declaration of Conflicting Interests
The author(s) declared no potential conflicts of interest with respect to the research, authorship, and/or publication of this article.
Funding
The author(s) received no financial support for the research, authorship, and/or publication of this article.
Supplemental Material
Supplemental material for this article is available online.
References
Supplementary Material
Please find the following supplemental material available below.
For Open Access articles published under a Creative Commons License, all supplemental material carries the same license as the article it is associated with.
For non-Open Access articles published, all supplemental material carries a non-exclusive license, and permission requests for re-use of supplemental material or any part of supplemental material shall be sent directly to the copyright owner as specified in the copyright notice associated with the article.