
Abstract
In recent years, several computer-aided diagnosis systems emerged for the diagnosis of thyroid gland disorders using ultrasound imaging. These systems based on machine learning algorithms may offer a second opinion to radiologists by evaluating a malignancy risk of thyroid tissue, thus increasing the overall diagnostic accuracy of ultrasound imaging. Although current computer-aided diagnosis systems exhibit promising results, their use in clinical practice is limited. One of the main limitations is that the majority of them use direction-dependent features. Our intention has been to design a computer-aided diagnosis system, which will use only direction-independent features, that is, it will not be dependent on the orientation and the inclination angle of the ultrasound probe when acquiring the image. We have, therefore, applied histogram analysis and segmentation-based fractal texture analysis algorithm, which calculates direction-independent features only. In our study, 40 thyroid nodules (20 malignant and 20 benign) were used to extract several features, such as histogram parameters, fractal dimension, and mean brightness value in different grayscale bands (obtained by 2-threshold binary decomposition). The features were then used in support vector machine and random forests classifiers to differentiate nodules into malignant and benign classes. Using leave-one-out cross-validation method, the overall accuracy was 92.42% for random forests and 94.64% for support vector machine. Results show that both methods are useful in practice; however, support vector machine provides better results for this application. Proposed computer-aided diagnosis system can provide support to radiologists in their current diagnosis of thyroid nodules, whereby it can optimize the overall accuracy of ultrasound imaging.
Introduction
Thyroid nodules can be defined as abnormal cell growth in the thyroid gland and can be either benign or malignant. Palpable thyroid nodules are a common clinical finding with a long-term prevalence of 5% in women and 1% in men in developed parts of the world. 1,2 In fact, the prevalence of nodules in the thyroid gland is much higher, as it is often an asymptomatic disease and nodules may not always be palpable. In randomly selected individuals, thyroid nodules were detected by high-frequency ultrasound (US) in 19% to 68% of the cases, with more frequent occurrence in women and the elderly individuals. 3,4 When compared with benign nodules in the thyroid gland, malignancy occurs in approximately 5% of cases depending on age, gender, family history, history of radiation from natural or artificial sources, and other factors. 5 –7 The relatively high incidence that continues to grow makes thyroid cancer one of the most common endocrine malignancies worldwide, currently listed as seventh most common cancer in women and fifteenth most common cancer in men. 6,8 Its rising incidence results in the constant demand for the maximal diagnostic benefit of US imaging since US imaging has been marked as cost-effective, noninvasive, and risk-free—which cannot be said about the other diagnostic methods, cytology (fine-needle aspiration biopsy [FNAB]), or histology (surgical excision). Hence, there has been significant research in evaluating and ranking of US features used by radiologists to predict the malignant potential of thyroid nodules. Some US features have been reported in association with increased risk of malignity, whereas some are associated with benignity. 6 Over 12 500 nodules from 54 observational studies were included in a systematic review and meta-analysis by Remonti et al 9 and a total number of 18 288 nodules in another meta-analysis by Brito et al. 10 Based on these 2 meta-analyses, calcifications, taller than wide shape, irregular margins, absence of elasticity, hypoechogenicity, increased blood flow, absence of halo, and/or nodule size are all risk factors for malignity. Both studies, however, concluded that any of these US features in isolation is not an accurate predictor of thyroid cancer and does not provide reliable enough information to select nodules that should have FNAB performed. Additionally, they conclude that 2 features, cystic content and spongiform appearance, might predict benign nodules.
Alongside research in US diagnostics based on the visual inspection of images by radiologists, several computer-aided diagnosis (CAD) systems have been introduced to assist radiologists in diagnosing lesions and avoiding unnecessary biopsies. 11 Computer-aided diagnosis systems using US images are supposed to facilitate accurate and fast classification of benign and malignant thyroid nodules. Computer analysis of the US images, especially a texture analysis, provides a different perspective to radiologists. Texture-based CAD system does not evaluate the sonographic features already discussed, such as irregular margins, or taller-than-wide shape, but they provide quantitative information about image patterns, which, in combination with a visual inspection by radiologists, can provide high-level diagnostic performance.
Acharya et al 12 and lately Sollini et al 13 presented an overview of previously published CAD systems for the thyroid gland based on various image feature extraction and classification methods. The most commonly used magnitude for evaluating classifier efficiency is either accuracy (number of correctly classified cases/number of all cases), or area under the receiver operating characteristic (ROC) curve. Below, we briefly review the most crucial studies on thyroid US CAD systems. Savelonas et al 14 used an US image for the classification of healthy and nodular thyroid glands and then for the classification of malignant and benign nodules in the thyroid gland on data from 66 patients. The authors focused on the directional patterns of the image they extracted using radon transformation, achieving maximal classification accuracy of 89.4% using the support vector machine (SVM) classifier. Ding et al 15 used 125 thyroid nodules from 56 malignant and 69 benign patients to extract statistical and textural attributes from elastographic images and using the SVM classifier, achieved 93.6% classification accuracy in solid nodules (cysts and pseudocysts were excluded from the study). Acharya et al used contrast-enhanced ultrasonography (CEUS) 16 to display thyroid nodules in 20 patients (10 malignant and 10 benign), the acquired US images were then used to differentiate between benign and malignant nodules based on textural parameters (energy and entropy) and the attributes obtained by discrete wavelet transform. The authors used the kNN (k-nearest neighbor) classifier with resultant accuracy of 98%. In addition, the authors proposed a malignancy risk index, which can be calculated from the US image itself, expressing the risk of malignancy of the examined nodule. Acharya et al also published another study, 17 in which again, they used features based on wavelet transformation and directional textures for classification from B-mode US images. As in their previous study, 10 malignant and 10 benign nodules were used, this time in combination with Adaboost classifier, achieving ROC area under the curve of 1 and classification accuracy of 100%. In another study, Acharya et al 18 had calculated a large number of attributes such as Fourier descriptors, local binary patterns, fractal dimensions, or law’s textural energies, both from the CEUS image and classic B-mode. The obtained data were then used to diagnose 10 malignant and 10 benign patients using the Gausian mix model classifier, achieving accuracy of 98.1%. Chang et al 19 used both axial and longitudinal US images (30 malignant and 29 benign) to extract a large number of textural attributes (74 in total), such as histogram parameters mean, standard deviation, skewness, brightness in the nodule and in the surrounding tissue, co-occurrence matrix, and the so-called gray-run-length matrix. The authors also introduced their own segmentation algorithm, capable of marking the border of the nodule in the thyroid gland with significant accuracy (correctly marked more than 90% of the nodule in majority of images). The segmented boundaries were further used to fit the ellipse in the nodule, and parameters of the ellipse were used to determine whether the nodule has taller than wide shape, one of the risk factors evaluated by radiologists. In addition to the textural analysis, the authors evaluated 12 radiological parameters (6 of the axial and 6 of the longitudinal image) that corresponded to the risk factors according to Moon et al. 20,21 The study resulted in 98.3% accuracy of the CAD system using the SVM classifier versus 98.7% accuracy of visual inspection by radiologists, with no statistically significant difference (t test, P < .05) observed between the 2 results. The most important features of the CAD system were rotation of the ellipse (ie, the evaluation of whether the nodule is taller than the wide) and the maximum probability, calculated from the co-occurrence matrix, both in the axial and longitudinal images. In another study, Acharya et al 22 used Gabor’s transformation to extract about 3800 features, which were further reduced by locality sensitive discriminating analysis. The authors used images from a total of 242 patients, of which 211 were benign and 31 malignant. Given that the binary classifiers based on machine learning algorithms can lead to unrepresentative results when the data are imbalanced, 23 authors adjusted data using oversampling. The authors probably chose oversampling to avoid losing the information contained in a large number of benign images. This is a recognized solution for dealing with imbalanced data; however, we must keep in mind that information about malignant nodules is duplicated, thereby the resulting classifier may not be able to generalize enough for malignant nodules. Still, this is a study that has used the largest number of nodules so far. The authors compared several classifiers (SVM, decision trees, kNN, multilayer perceptron), achieving the highest accuracy of 94.3% using the C4.5 decision tree classifier. A review table of latest works in the field of automated diagnosis of thyroid nodules is provided in Table 1.
Comparison of Most Recently Published Studies With Our Study.

Abbreviations: CEUS, contrast-enhanced ultrasonography; DWT, discrete wavelet transform; HRUS, high-resolution ultrasound; kNN, k-nearest neighbor; RF, random forests; SFTA, segmentation-based fractal texture analysis; SMOTE, Synthetic Minority Oversampling Technique; SVM, support vector machine.
From a clinical point of view, most of the articles discussed have 2 main limitations. Firstly, the majority use images from only 1 device (notable exception is 22 ). The second limitation is that they are based on directional features. It means that the results of those studies are strongly dependent on the US device used for data acquisition, as well as on the position of the probe during the examination. To counter these drawbacks, we used data from 2 different device models and limited features that are dependent upon direction. This approach brings new perspectives to image analysis when evaluating grayscale properties of the nodules. We did not use the popular gray-level co-occurrence matrix (used for instance in 17,19,24,25 ) nor gray-level-run-length matrix (used in 19 ) for grayscale-level evaluation. We did, however, employ segmentation-based fractal texture analysis (SFTA) method proposed by Costa et al, 26 dividing the image into a set of binary images corresponding to different gray-level bands (stacks), upon which the nondirectional textural features were calculated in each stack. As far as we know, SFTA has not yet been applied to thyroid cancer diagnosis.
Materials and Methods
Data Acquisition
Axial US images of 40 patients were collected from the database system of our clinic (name of institution blinded for purpose of review) during a 2-year period. Patients were clinically confirmed to have benign or malignant thyroid nodules, either by cytology (FNAB) or histology (surgical excision). Of these nodules, 20 were malignant and 20 were benign; 29 female and 11 male patients, with a mean age of 51 in the malignant group and 60 pertaining to the benign group. Images were obtained using 2 US devices: 10 malignant and 10 benign using Logiq S8, made by GE Healthcare Inc (Chicago, Illinois), linear probe ML6-15-D (50 mm, 4-13 MHz), and 10 malignant and 10 benign using Philips Healthcare Inc (Amsterdam, Netherlands) EnVisor M2540A, linear probe L12-5. No preprocessing of captured images was done, except a common brightness modification for images from the Philips device. Segmentation-based fractal texture analysis algorithm is based on Otsu method, 27 which calculates optimal thresholds individually for each image based on histogram analysis and thus helps to overcome important challenges in US imaging such as noise and potentially inconsistent exposure when acquiring images. Feature extraction and classification of the images obtained were run on a computer with Intel (Intel Corp, Santa Clara, California) i3, 2.1 GHz dual-core processor, using 8 GB of RAM, running Windows 7 Professional (Microsoft Corp, Redmond, Washington). Image examples used in the study are seen in Figure 1. All procedures in the study involving human participants were in accordance with the ethical standards of the institutional and/or national research committee and with the 1964 Helsinki Declaration, including all amendments or comparable ethical standards and frameworks. Our study was approved by Ethics Committee of General University Hospital, Prague, under approval number 116/12. All patients involved in our study provided written informed consent.
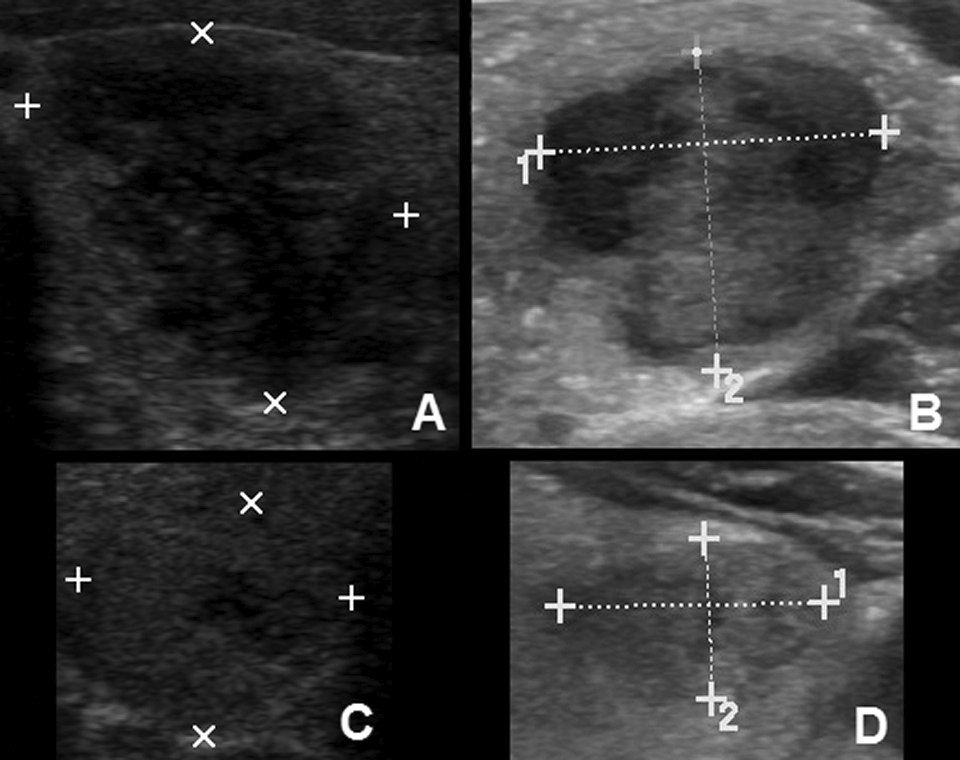
Sample images of benign and malignant nodules. Dimensions of a nodule are marked with crosses. (A) Malignant nodule from Phillips device; (B) malignant nodule from GE device; (C) benign nodule from Philips device; (D) benign nodule from GE device.
Feature Extraction
In this work, histogram parameters and features obtained by SFTA were used. All feature extraction was implemented in Matlab 7.12.0 (MathWorks Inc, Natick, Massachusetts).
Histogram Parameters
Histogram parameters consisted of mean (HistMean), standard deviation (HistStdDev), skewness (HistSkew), and kurtosis (HistKurt). Mean is defined as the average pixel brightness within the whole region of interest (ROI). Standard deviation (SD) is the SD of pixel brightness in the whole ROI. Skewness is an indicator of asymmetry based on the mean (negative values indicate data skewed left, positive values data skewed right, equals 0 for symmetric distribution). Kurtosis is an indicator of histogram peakedness (negative values indicate flat distribution; positive values indicate spiked distribution).
Segmentation-Based Fractal Texture Analysis
Segmentation-based fractal texture analysis (SFTA) was originally published in 2012. 26 The algorithm decomposes a grayscale image on a series of binary images using 2-threshold binary decomposition, based on a previously published method named binary stack decomposition. 28
Segmentation-based fractal texture analysis first calculates n thresholds for a grayscale image using the multilevel Otsu method, 27,29 which calculates optimal thresholds between background and foreground based on histogram analysis. These thresholds are then used for simple thresholding to obtain n binary images. Other n − 1 binary images are obtained using 2 neighboring thresholds, where output is a binary image in the band between the 2 thresholds. Example of decomposed image is shown in Figure 2.

Output of the SFTA algorithm with the number of Otsu’s thresholds n = 4 (labeled T1-T4). Top left: An example of a benign nodule. Also in the top row: Output of 2 threshold band decomposition. Bottom row: Result of simple thresholding using T1 to T4. In total, using the SFTA algorithm, we get 2n − 1 binary images. SFTA indicates segmentation-based fractal texture analysis.
The SFTA algorithm then calculates 3 features in each binary image obtained by the decomposition described above. These features are fractal dimension (FracDim), total number of pixels (PxCount), and mean brightness value (Mean). The FracDim quantifies the shape of objects in the binary image after thresholding. Segmentation-based fractal texture analysis algorithm determines FracDim by calculating a 2-dimensional (2-D) approximation of Hausdorff dimension D h. Considering an object that possesses Euclidean dimension E, D h can be calculated by following equation:
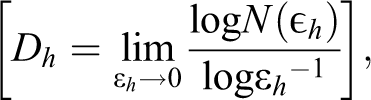
where N(εh) is the counting of hypercubes that fill the object, having dimension E and length εh. Since the object in SFTA is composed of pixels in a binary image, box counting method 30 is used to obtain a 2-D approximation for D h as follows: First, the image is divided into a grid of squares of size ε × ε, then the number of squares N(ε) that contain at least 1 pixel of the object are counted. The counting is repeated for various values of ε and then a log N(ε)/log ε−1 curve is plotted. The curve is subsequently approximated by virtue of linear regression line and FracDim is defined as a scalar corresponding to the slope of this line. The second feature, PxCount is simply a count of white pixels in the binary image after thresholding. Third feature, Mean, corresponds to mean brightness value of the pixels in the original image, which, in turn, positionally correspond to pixels in the binary image. Using SFTA algorithm, we gain 3 times 2n − 1 features; so, for instance, when the number of thresholds n = 4, we get 7 × 3 = 21 features in total. Detailed theory behind SFTA features is found in study by Costa et al. 26
Classification
Two classification methods were implemented: random forests (RF) 31 and SVM. 32,33 The decision made when selecting these 2 classifiers from the potential list of machine learning methods was based on the most up-to-date review on thyroid gland CAD. 13 It is clear from the review that though decision trees have been used several times for accurate classification of thyroid nodules, their modification in the form of RF has not yet been used successfully for this problem, even though RF is held in high esteem when it comes to solving the complex problems faced by all classifiers of today. 34 On the other hand, SVM can be considered as a standard for this problem since SVM has a long history in thyroid gland applications and—based on Sollini et al review, 13 it is one of the most commonly used methods for thyroid classification (used, eg, in 15,18,19,22,35 ). Henceforth, we decided to follow a study design whereby a new method (RF) is compared with a well-known and established one (SVM). Both classification methods were implemented in R 3.3.1 (The R Foundation for Statistical Computing, Wien, Austria) using Caret package. 36
Random Forests
Random forests are an ensemble classification method. It works on a principle that each committee of learners casts a vote for the final prediction. The learner here is a tree, built using the classification and regression trees methodology, 37 a model that uses binary splits on variables to predict class. Random forests use 2 types of randomness to create multiple decision trees. The first type of randomness arises since bootstrapped data are used to grow a tree. The second type of randomness is due to the fact binary splits are made using the best predictor out of a random subset of predictors, tested at each node. How many attributes will be randomly tested and compared on each node of each tree is controlled by mtry parameter. When mtry is 1, only 1 feature is randomly chosen at each node; when mtry is 2, 2 features are randomly chosen at each node; and so on. The optimal value of mtry can move anywhere between 1 and the total number of attributes. Random forests have some advantages in comparison with other classification methods. They can be used when predictors are correlated and can also determine the importance of variables in a given model. In addition, RF is able to handle data in which the number of predictors is much larger than the number of participants (the so-called curse of dimensionality). 38 A detailed theory behind the RF procedure is found in Breiman’s artilce. 31
Support Vector Machine
Support vector machine classifier generate hyperplanes that separate features belonging to 2 different classes in the given feature space. Linear hyperplanes are applied for linear separable data sets, or kernel transformations are applied in the case of nonlinear separable data sets. Support vector machine can be optimized using parameter C. Parameter C controls the tradeoff between the complexity of the decision rules and frequency of error. 32 A small value for C will increase the number of training errors, while a large C will lead to behavior similar to that of a hard margin SVM. 39 In this work, SVM classifier integrated with radial basis function is used. The main advantages of SVM compared to RF are simpler geometric interpretation and its lower computational cost. Both SVM and RF possess very high generalization abilities. 34
Validation of Classifier
We used the leave-one-out cross-validation (LOOCV) method to evaluate the model. Leave-one-out cross-validation is a variation of k-fold cross-validation, where number of fold is equal to number of participants. This procedure simulates testing on independent data, which limits overfitting to the data used, increasing the classifier’s capability of generalization. The accuracy was chosen as the decisive metric for selection of the final model for both RF and SVM.
Results
Classification of nodules using RF at the best setting (mtry = 12) reached accuracy of 92.42% with fold SD of 0.22. Classification of nodules using SVM at the best setting (C = 8) reached overall accuracy of 94.64% with fold SD of 0.16. Overall accuracy of 94.64% is comparable to the results of previous studies as seen in Table 1. Since only features independent of direction have been used, a highly satisfactory result can be observed.
Two-threshold binary decomposition cuts the image into a series of binary images, the number of which depends on the number of thresholds (see Figure 2), which of course affects the number of features and thus may in turn affect the overall accuracy. As shown in Figure 3, the highest accuracy for RF and SVM classifiers was obtained when number of threshold was 6 or 7. According to the authors of the SFTA algorithm, 26 classification accuracy may increase until the number of thresholds is 8 or 9. The authors describe that a possible explanation for this observation is that, after the number of thresholds is higher than 8 or 9, no additional texture patterns are identified by 2-threshold binary decomposition. 26 Similar behavior can be seen for our application in the Figure 3.
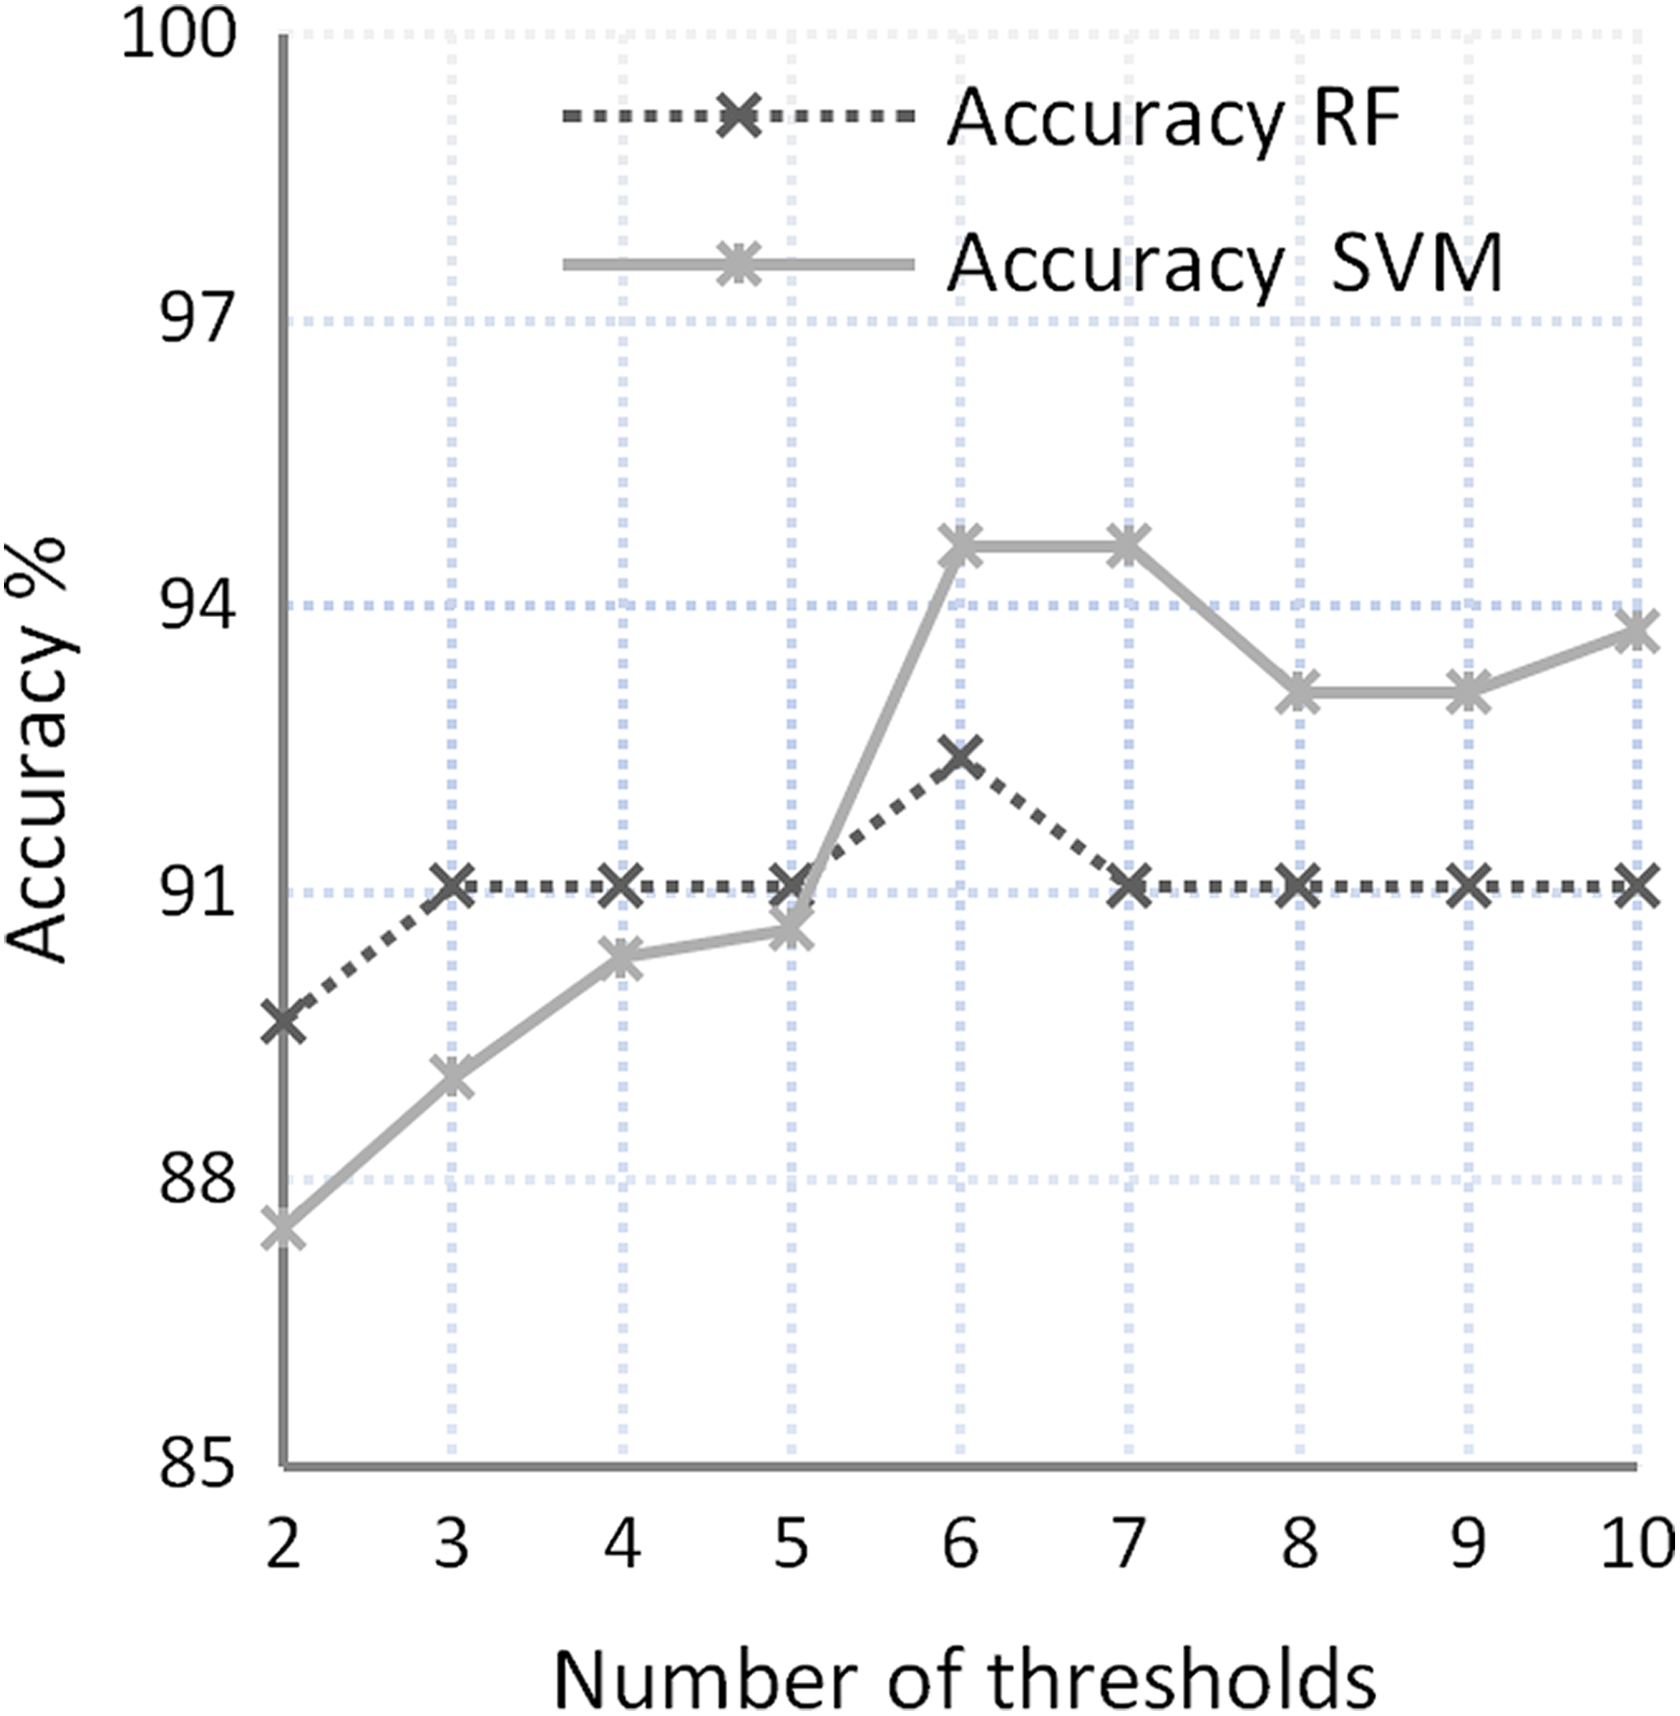
Dependency of total accuracy (evaluated by LOOCV) on number of thresholds of 2-threshold binary decomposition for both RF and SVM classifiers. LOOCV indicates leave-one-out cross-validation; RF, random forests; SVM, support vector machine.
As seen in Figure 4, histogram parameters (HistSkew, HistKurt) play a strong role in the classification process. High importance of the histogram parameters is corroborated by previously published studies on texture analysis. 19,40 In both studies, histogram features have high accuracy in comparison with other features, or they are included in a final set of features that achieves the highest accuracy. However, the authors have demonstrated that histogram features, in isolation, are not sufficient to distinguish between benign and malignant nodules. The most important feature obtained by SFTA is fractal dimension in stack 1, followed by pixel count in stacks 1 and 2, suggesting that the yield of 2-threshold binary decomposition features lays mainly in lower stacks, corresponding to areas of dark pixels in the images. Therefore, the most important properties of the nodule are how many dark pixels it contains (PxCount) and the complexity of the shapes formed by these pixels (FracDim).

Graph showing importance of features in random forests classifier when number of thresholds of SFTA is equal to 6. Importance score for each variable is scaled to have a maximum value of 100. Principle of the importance calculation is as follows: For each tree, the prediction accuracy of the out-of-bag portion of the data is recorded. The same is then done again after permuting each predictor variable. Importance score for variable is the difference between the 2 accuracies, averaged over all trees and normalized by the standard error. 36 SFTA indicates segmentation-based fractal texture analysis.
On the other hand, features that did not convey significant information for further classification correspond to the brightest stacks from 2-threshold binary decomposition. This is quite interesting because micro- and/or macro-calcifications, which have been considered as a risk factor for malignancy, 6,9,10 should occur in bright stacks. The results, however, did not support the hypothesis that there is presence of a significant feature in bright stacks.
Since the number of individual features is relatively small, both RF and SVM models are not very demanding for computing power. Total time for fitting the model was 0.12 second for RF at optimal setting (6 thresholds, mtry = 12) and 0.03 second for SVM at optimal setting (6 thresholds, C = 8); prediction time of a single case was less than 0.01 second for both RF and SVM; and total elapsed time when evaluating a model using LOOCV was measured 5.32 seconds for RF and 2.25 seconds for SVM. All time measurements were done using the same computer as specified above.
Discussion
Our intention has been to design a CAD system that will use only direction-independent features, that is, it will not be dependent on the orientation and the inclination angle of the US probe when acquiring the image. We have, therefore, applied histogram analysis and SFTA algorithm that calculates direction-independent features only. The proposed direction-independent features provide very good results.
Despite the fact that we have used LOOCV method to evaluate the results, the low number of images remains the main limitation of this study. In future, our proposed CAD system should be validated on another set of (prospectively collected) images to evaluate more thoroughly, the generalization ability of proposed CAD system. Another limitation of this study is that our approach requires manual segmentation by medical experts trained in neck ultrasonography, which may lead to inconsistencies among machine operators that can affect results. There are, as far as we know, only 2 segmentation techniques for thyroid nodules, 41,19 both reporting that the average result of the segmentation covered around 90% of affected areas. The problem faced during the segmentation process could be resolved using the patch-based classification method, which decomposes a nodule into small patches, so the analysis is significantly less dependent on the shape of the nodule. Using patch-based method, we can obtain a large number of training examples; however, we certainly lose some information about the nodule as a whole and so the question is: Can we possibly gain enough information from patches to sufficiently diagnose nodules? If so, we will be less dependent on identifying the nodule as a whole, since the analysis will be more focused on the texture of a nodule, the main area in which computers can provide support. We, therefore, suggest a patch-based approach using our proposed direction-independent features as the path for the future thyroid nodule CAD.
Random forests were used for the classification of thyroid nodules and its performance was compared with the SVM classifier. Results show that both methods are useful in practice; however, SVM provides better results for this application. As far as we are aware, RF have not yet been applied to such a problem. Additionally, a new feature extraction technique based on 2-threshold binary decomposition was used for classification of thyroid nodules. These features, especially those in low brightness levels, were shown to be of high importance in the RF classifier.
Proposed CAD system can provide support to radiologists in their current diagnosis of thyroid nodules, whereby the overall accuracy of US imaging can be greatly increased.
Footnotes
Declaration of Conflicting Interests
The author(s) declared no potential conflicts of interest with respect to the research, authorship, and/or publication of this article.
Funding
The author(s) received no financial support for the research, authorship, and/or publication of this article.