
Abstract
Photoacoustic computed tomography using an ultrasonic array is an attractive noninvasive imaging modality for many biomedical applications. However, the potentially long data acquisition time of array-based photoacoustic computed tomography—usually due to the required time-multiplexing for multiple laser pulses—decreases its applicability for rapid disease diagnoses and the successive monitoring of physiological functions. Compressed sensing is used to improve the imaging speed of photoacoustic computed tomography by decreasing the amount of acquired data; however, the imaging quality can be limited when fewer measurements are used, as traditional compressed sensing considers only the sparsity of the signals in the imaging process. In this work, an advanced compressed sensing reconstruction framework with a Wiener linear estimation-based Gaussian scale mixture model was developed for limited view photoacoustic computed tomography. In this method, the structure dependencies of signals in the wavelet domain were incorporated into the imaging framework through the Gaussian scale mixture model, and an operator based on the Wiener linear estimation was designed to filter the reconstruction artifacts. Phantom and human forearm imaging were performed to verify the developed method. The results demonstrated that compressed sensing with a Wiener linear estimation-based Gaussian scale mixture model more effectively suppressed the reconstruction artifacts of sparse-sampling photoacoustic computed tomography and recovered photoacoustic images with a higher contrast-to-noise ratio and edge resolution than the traditional compressed sensing method. This work may promote the development of low-cost photoacoustic computed tomography techniques with rapid data acquisition and enhance the performance of photoacoustic computed tomography in various biomedical studies.
Keywords
Introduction
Photoacoustic imaging (PAI) is a novel noninvasive biomedical imaging modality that has attracted considerable attention because it combines both the high optical absorption contrast of pure optical imaging and high resolution of ultrasound imaging. Photoacoustic imaging recovers important endogenous physiological parameters that reflect the status of various diseases, such as oxyhemoglobin, deoxyhemoglobin, oxygen saturation, and so on, and it also recovers the distribution of exogenous contrasts with high optical absorption for photoacoustic molecular imaging studies. 1,2 Therefore, this modality has considerable potential for use in the early diagnosis of cancer, the imaging of tumor angiogenesis, and the detection of vulnerable arthrosclerosis plaques for preclinical and clinical applications. 3,4,5 Photoacoustic computed tomography (PACT) is a major form of PAI in which the internal photoacoustic source distributions are recovered from the ultrasonic measurements over a plane or a volume. Generally, PACT uses either an unfocused ultrasonic transducer with mechanical scanning or an ultrasonic transducer array to acquire the image data. 6,7 Then, the optical absorption of the imaged objects can be recovered with a certain algorithm. For many biomedical applications, PACT equipped with an ultrasonic array is of particular interest because of its wide-field, multiscale, and multiresolution imaging capabilities. This technique has been successfully applied for several clinical applications, such as the diagnosis and treatment monitoring of breast cancer. 8,9
However, when using the traditional back-projection (BP) reconstruction method, the transducer elements of the ultrasonic array must be sufficiently dense to recover high-quality PACT images which leads to long data acquisition and processing times under the limitations of a lower laser repetition frequency (approximately 10 ˜ 20 Hz for deep PACT imaging [depth >1 cm]) and data acquisition card (DAQ) multiplexing; thus, the applications of PACT are limited in many fields, such as hemodynamics. 10 Moreover, a dense arrangement of numerous transducer elements is required, which increases the fabrication difficulties and system costs, particularly for PACT with high-frequency ultrasonic arrays. 11 To improve the detection sensitivity of PACT for deep signals, larger sized transducers are designed; however, such changes do not guarantee the dense packing of transducers, which decreases the quality of the photoacoustic images reconstructed by traditional methods. 12 Therefore, the development of advanced imaging methods capable of recovering high-quality photoacoustic images with sparse sampling data are becoming important for enhancing the applications of PACT in biomedical imaging and studies.
Compressed sensing (CS) is an effective method for recovering signals that are sparse in a certain transform domain. In recent years, many studies have been performed that demonstrate the advantages of CS in signal processing and biomedical imaging. 13 –15 Analyses aimed at leveraging the advantages of CS for PACT have also been recently reported, with Provost et al verifying the feasibility and effectiveness of CS for PACT via mathematical proofs and phantom experiments. 16 Many researchers have subsequently explored the applications of CS in different imaging systems using different reconstruction models. For example, Dr Liang et al employed CS in a random optical illumination PAI system 17 ; Dr Guo et al reported CS-based PAI of the cerebral vascular of rats in vivo. 18 Previously, our group developed a reconstruction model of CS with partially known support and then successfully applied it to the acoustic and optical resolution PACT in vivo. 19,20 All the abovementioned studies show the advantages of CS in improving the data acquisition speed and decreasing the system costs of PACT via the sparse-sampling mode.
However, in the traditional CS reconstruction, only the sparsity of the coefficients in the sparse domain is considered, and the images are recovered by minimizing the number of nonzero coefficients with the square error constraint between the measurements and the estimated data. In this case, the artifacts with amplitudes similar to those of the real signals may not be suppressed effectively or were overly suppressed, which resulted in the loss of many signals. Recently, an advanced CS reconstruction model with wavelet-domain coefficient dependencies (referred to as structured sparsity) was developed for signal processing. In this method, a Gaussian scale mixture model (GSM) was imported as a tool representing the structured sparsity of the wavelet coefficients. 21 –23 Kim first developed the GSM-based CS (CS-GSM) model in the wavelet domain and applied it to recover the digital image by sparse sampling. 24 Recently, the CS-GSM model was also applied for coronary magnetic resonance imaging by Akçakaya, and higher quality in vivo coronary images were obtained with fewer measurements. 25 Available CS-GSM reconstruction models are generally calculated by the Bayesian least squares (BLS) estimation, although, in practice, the BLS-based method increases the complexity of the Bayes computation process. In this work, we developed a convenient CS model with GSM using a Wiener linear estimation (CS-wGSM) and adapted it into the limited view PACT in vivo. To our knowledge, this study is the first to incorporate the structured sparsity of the wavelet coefficients into the PAI process. In this method, a Wiener linear estimation-based GSM (wGSM) operator was designed to estimate the clear signals of the wavelet coefficients, and then the image processed by the wGSM operator was incorporated into the CS reconstruction framework as a priori data. Phantom and in vivo experiments of a human forearm were performed based on a PACT. The experimental results demonstrated that our developed CS-wGSM-based PACT incorporated the structure features of the wavelet coefficients, and it suppressed the sparse-sampling artifacts more effectively and recovered the PACT images with a higher accuracy than the traditional CS-based PACT.
Materials and Methods
Compressed Sensing PACT
In PACT, assuming that the measurement data are

where Φ =

Furthermore, many applications demonstrate that the total variation in the signals improves the imaging process; thus, the more popular form of the CS-based reconstruction model is as follows 27 :

where α and β are regularization parameters that determine the trade-off between data consistency and sparsity.
Wavelet Coefficient Dependencies
A wavelet is often used as an effective sparse transform mode to implement signal processing; thus, it is usually the first choice for the CS method. In the traditional CS-based PACT, only the sparsity of the wavelet coefficients is considered. In fact, one coefficient, C, in a subband in the wavelet domain has statistical relationships with other coefficients from different subbands and scales. 28 Generally, these relationships hold for pairs of coefficients at adjacent spatial positions (called “siblings”), adjacent orientations (“cousins”), the same position at a coarser scale (“parent”), and adjacent orientations at coarser scales (“aunts”). All the related coefficients are called “neighbors” of C, and the positions of these neighbors in the steerable pyramid wavelet domain are illustrated in Figure 1.

Illustration of neighborhood choice of 1 wavelet coefficient.
Gaussian Scale Mixture Model
Many researchers have studied the statistical structure of the wavelet coefficients of many types of images and found that the wavelet subband coefficients have highly non-Gaussian statistical properties. 28 Photoacoustic images also have the same statistical features; for example, Figure 2A is a typical vascular B-scan photoacoustic image and Figure 2B is its wavelet decomposition. The non-Gaussian characteristics of the photoacoustic image are analyzed using the histogram of 1 subband. Here, the histogram and log histogram of the vertical subband of the B-scan image are listed in Figure 2C and D, respectively. The histogram curves exhibit an obvious non-Gaussian distribution, that is, a sharp peak at zero with heavy tails. Furthermore, although the coefficients of the wavelet subbands are approximately decorrelated, the wavelet coefficients are not statistically independent. In fact, large magnitude coefficients tend to occur in the surrounding spatial locations and also emerge at the same spatial location in the subbands at adjacent orientations and scales, and they represent the “neighbors” discussed in the section of wavelet coefficient dependencies. To utilize the coefficient dependency in signal processing, a GSM model was developed to express the non-Gaussian behavior of the subband coefficients. 29
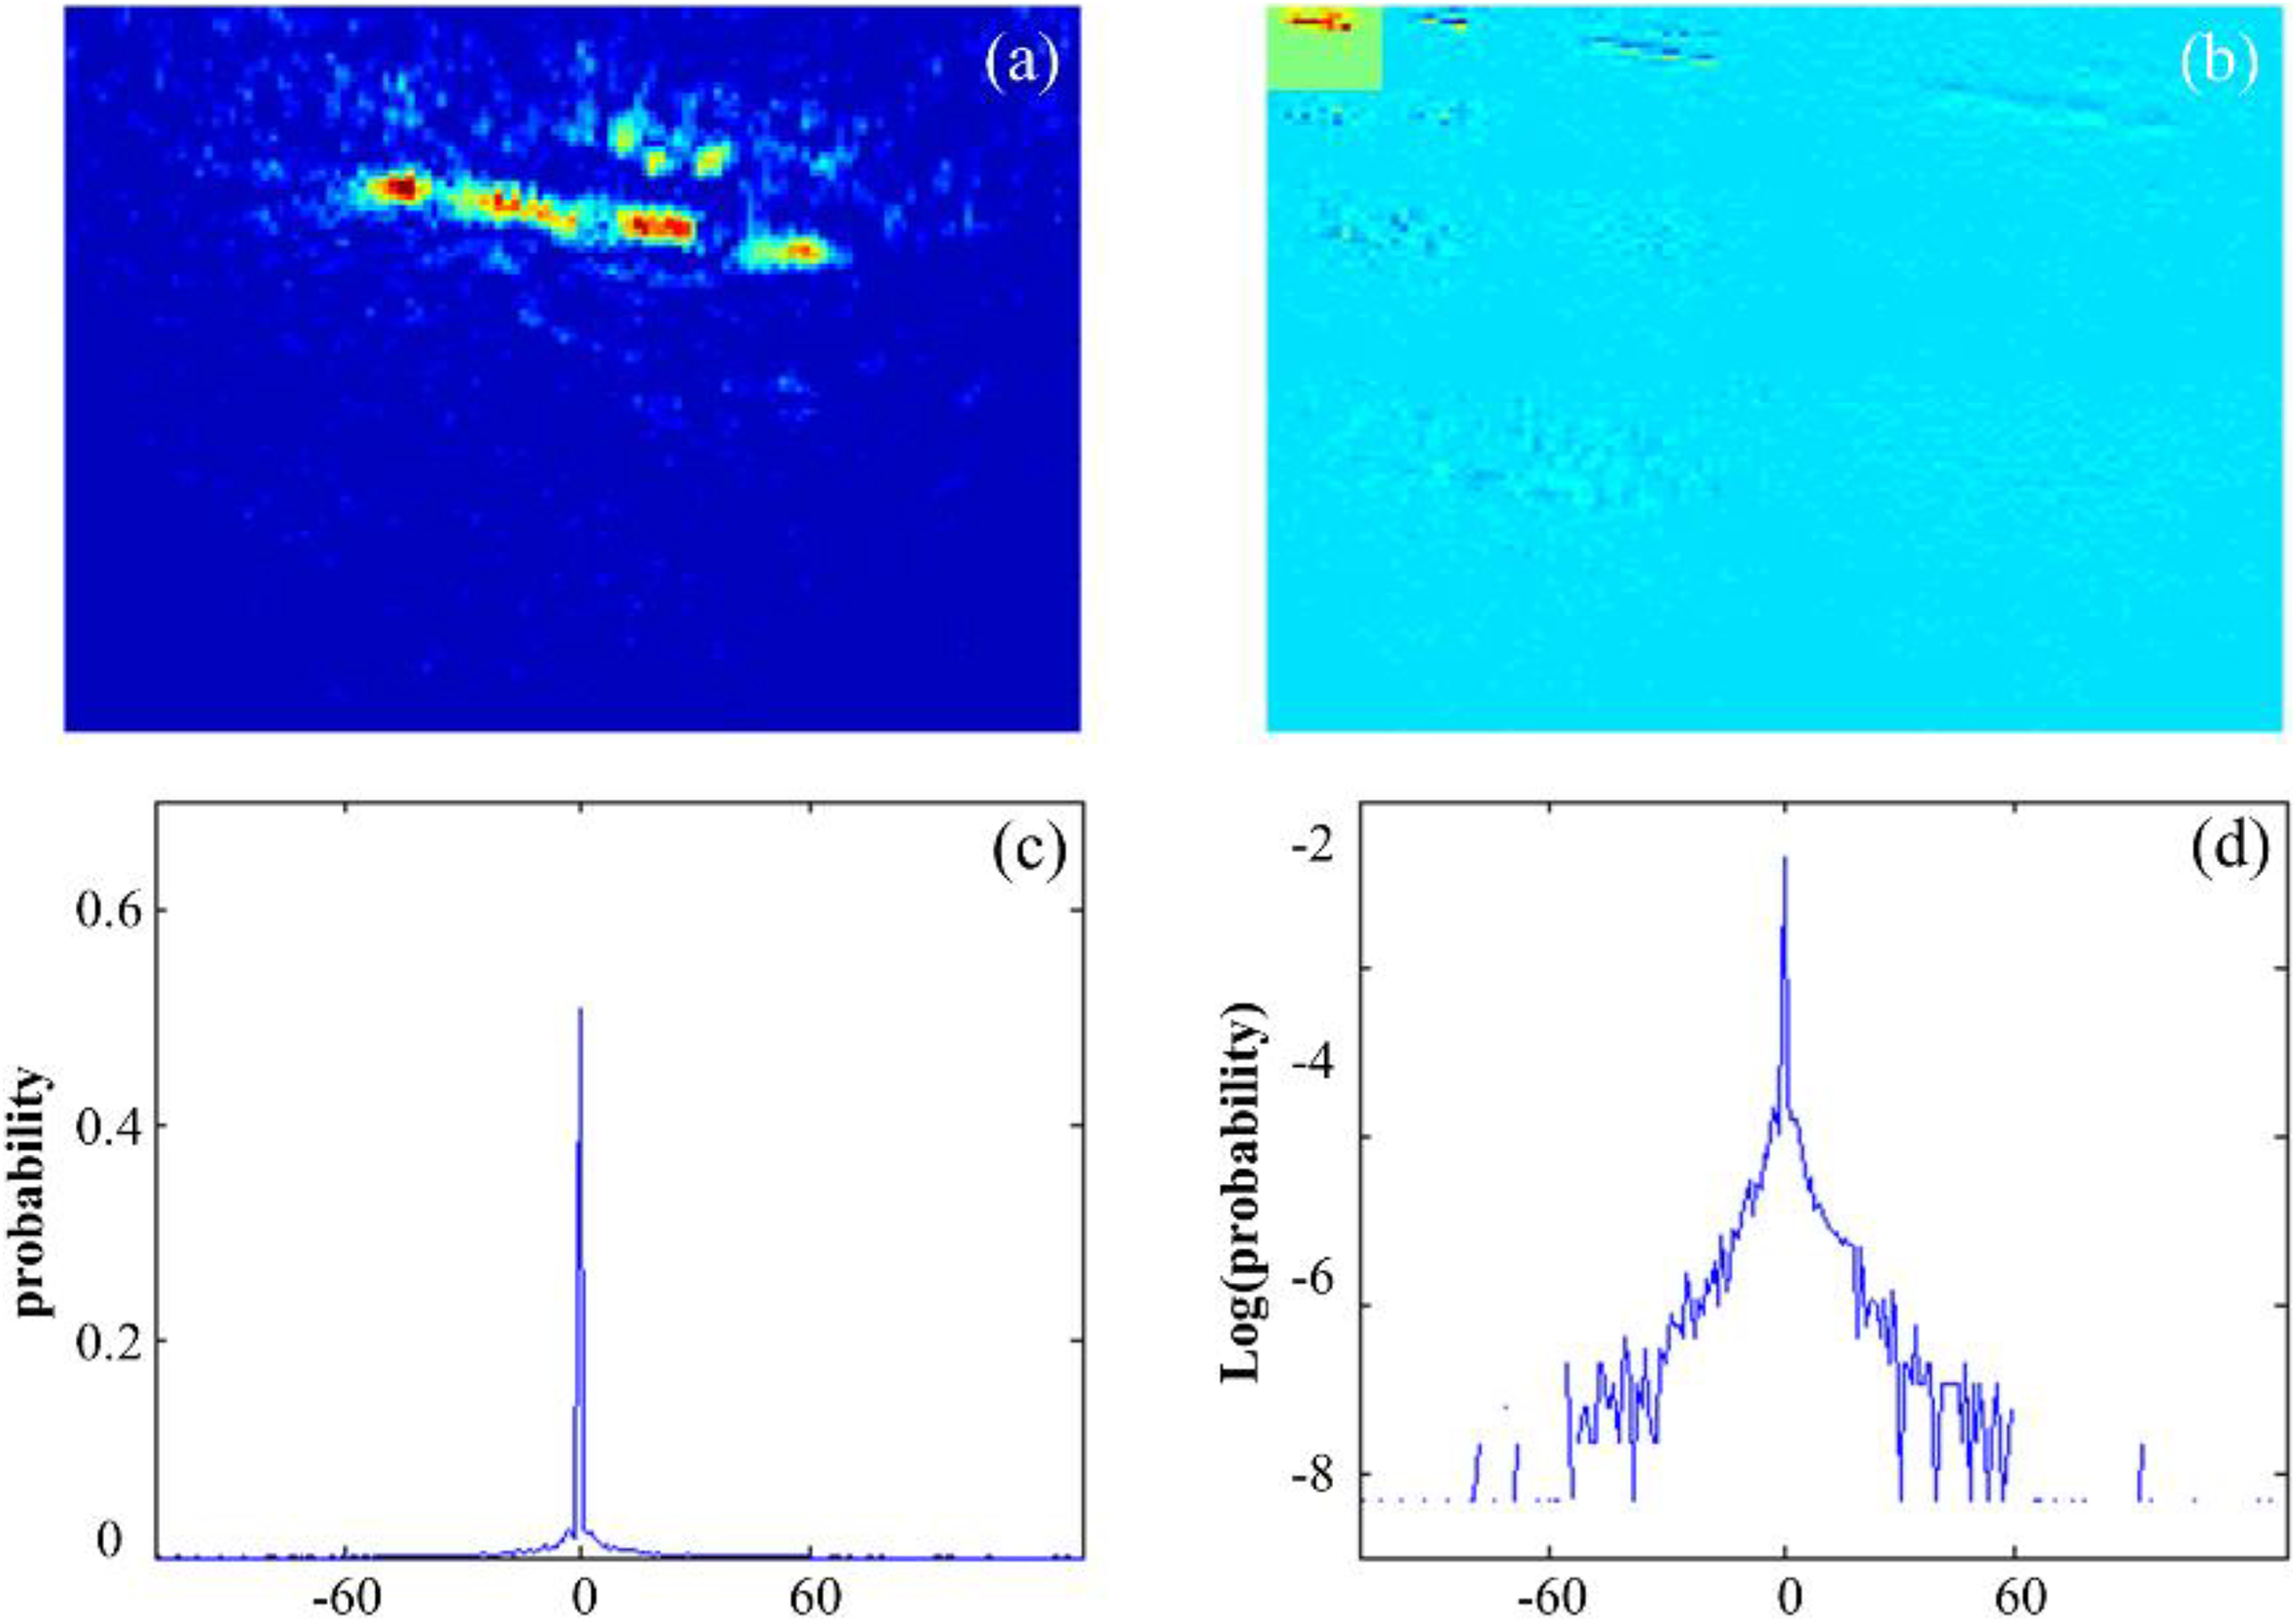
Analysis of wavelet coefficients for photoacoustic images. (a) An in vivo B-scan photoacoustic image; (b) wavelet decomposition of the B-scan image with 3 scales and 3 directions; (c) 256-bins sub-band coefficients histogram (vertical subband), (d) log-domain histogram of the vertical sub-band coefficients
Assuming that the image was decomposed into a wavelet domain (in this work, a steerable pyramid was used), let C represent a coefficient of 1 subband and O represent its neighborhood vector consisting of surrounding neighbors from different subbands as illustrated in Figure 1. Then, the distribution of the neighborhood vector O can be expressed by the following GSM 21 :

where X represents the clear coefficients; z is a positive random variable referred to as a hidden multiplier; U is a zero-mean Gaussian random vector with a covariance matrix CU , which is independent of z; and W represents the noise or reconstruction artifacts of the original image.
In Equation 4, the random variables U and W are independent; thus, the covariance of the neighborhood vector can be written as follows:

where CO and CW are the covariance matrices of O and W, respectively. CW can be estimated as follows:

where σW is the standard noise variance. Assuming HH represents the high-pass residual subband, then it can be estimated as follows:

For each subband, we can estimate CU from Equation 5, where CO can be estimated by the following equation:

where O
k is the neighborhood vector of the kth wavelet coefficient in 1 subband; K is the total number of the neighborhood vectors; and

Wiener Linear Estimation of Clear Signals
To estimate the clear signals of the noisy image using the GSM model, the z value related to each wavelet coefficient should be calculated first. In PAI with sparse sampling, the image noises mainly result from the reconstruction artifacts; thus, the noises are correlated with the image signals. In this case, z is estimated by the Cholesky decomposition of CW
and the eigenvalue decomposition of

Then, the maximum likelihood estimation

where

where
Reconstruction Model and Algorithms
To incorporate the wGSM into PACT to improve its performance when using sparse sampling, an advanced CS reconstruction model was developed as follows:

where MWG is a diagonal matrix, which includes prior information of the structured sparsity of the wavelet coefficients that are updated after every CS reconstruction process

where X
(r) is the estimate of the wavelet coefficients after the rth CS reconstruction. Then, the diagonal entries of the

where ∊is a small positive value to avoid division by zero. In the CS-wGSM reconstruction process, MWG is initialized by the identity matrix and then refined after each CS reconstruction using Equation 15.
The flowchart of the CS-wGSM reconstruction for PAI is illustrated in Figure 3. The input of this imaging process includes the measurement matrix K, the measurement data Y, and the wavelet transform ψ. Certain variables used in the imaging process were also initialized as follows: The image and its sparse signal were initialized to zero; the weighted matrix

Illustration of CS-wGSM reconstruction method for pact. (A) Flowchart of the CS-wGSM reconstruction process; (B) comparisons of wavelet coefficient images with steerable pyramid wavelet transform, (1) and (2) are the wavelet-coefficient images of 1 B-scan before and after the wGSM operator. CS-wGSM indicates compressed sensing with Wiener linear estimation-based Gaussian scale mixture model.
Step 1: Perform the CS reconstruction using Equation 14 with the current weighted matrix Step 2: Filter the sparse-sampling artifacts of the wavelet coefficients X
(r)by the wGSM operator and obtain the calculated clear wavelet coefficients Step 3: Update the weighted matrix Step 4: Calculate r = r + 1; if r > R, then the process is complete; otherwise, return to step 1.
In the above CS-wGSM reconstruction process, the wGSM operator was used to suppress the sparse-sampling artifacts of the wavelet coefficient, and it is described using the following algorithm:
Wiener linear estimation-based GSM operator (wGSM)

To demonstrate the effect of this operator, 1 in vivo B-scan datum was selected as an example, and its wavelet coefficient images before and after the wGSM operator are shown in Figure 3B. Figure 3B – 1 is the wavelet coefficient image of the B-scan before the wGSM operator, and the sparse-sampling artifacts are apparent. After wGSM filtering, the artifacts of every wavelet subband were greatly suppressed (see 2 in Figure 3B).
In Vivo Studies on Human
All experiments in our work were performed based on a clinical PAI system (EC-12R; Alpinion Medical Systems, Republic of Korea). 31,32 This system consists of a tunable optical parametric oscillator (OPO) laser pumped by a Q-switched Nd: YAG laser (Phocus, OPOTEK, Carlsbad, California), a linear ultrasound array with 128 transducer elements (center frequency, 7.5 MHz) and a 64-channel DAQ. The wavelength of the OPO range converts from 680 to 930 nm, and its laser output is initially coupled with bifurcated fiber bundles, which are then integrated with the ultrasonic array. To obtain volumetric PACT images, a motorized scanner (STM-1-USB, ST1) was used for 1-dimensional mechanical scanning along the elevational direction. At each scanning position, we acquired the raw data from 1 B-mode photoacoustic image. More discussions and applications of the imaging system can be found in Kim et al and Park et al. 31,32
To investigate the preclinical applications of the developed CS-wGSM method, we photoacoustically imaged a volunteer’s forearm based on the low-frequency PACT system illustrated earlier, and we have obtained the written consent from the volunteer. Initially, the forearm was positioned on a custom-made holder. We placed a 15-mm thick gelatin standoff atop the forearm to effectively deliver the light to the region of interest. The volumetric PACT images were acquired by moving the imaging probe using the motorized scanner within a range of 60 mm and at a step size of 0.4 mm. An excitation wavelength of 850 nm with an output energy of 2.2 mJ/cm2, which is much less than ANSI safety limits (ie, 40 mJ/cm2 at this wavelength), was used to acquire the PACT images. All the human experiments were conducted in accordance with protocols approved by the institutional review board of Pohang University of Science and Technology (approval number: PIRB-2016-A002).
Results
Phantom
A blood vessel-mimicking phantom was fabricated by embedding a mesh of silicone tubes (508-001, Dow Corning, Corning, New York) filled with red dyes in an intralipid-gelatin phantom. The inner and outer diameters of the tubes were 300 and 640 µm, respectively, and they were positioned ˜2 cm beneath the phantom surface. During volumetric PACT imaging, the 3-dimensional (3D) data were acquired by moving the imaging probe along the elevational direction with a step size of 0.5 mm, an excitation wavelength of 700 nm, and a laser pulse energy 2.2 mJ/cm2. Figure 4 shows the photoacoustic images of the phantom reconstructed by the different methods, and (A – B) are the MAP images reconstructed via BP with the data from the full sampling and 1/2 sampling rate, respectively. Here, the sparse-sampling data were acquired from part of the transducer elements homogeneously distributed in the ultrasonic array. In addition, (C – D) are the MAP images of the phantom reconstructed with a 1/2 sampling rate by the CS and CS-wGSM methods, respectively. When using the 1/2 sampling rate, the quality of the reconstructed images via BP deteriorated and the signal edges was blurred with many serrated artifacts. Observing the results reconstructed by traditional CS (Figure 4C), the artifacts showed a considerable amount of suppression, although the signals still presented serrated noise. Surprisingly, when CS-wGSM was used, the reconstruction artifacts were greatly suppressed (Figure 4D). To clarify the comparisons between the reconstructed results, we present 4-fold enlarged subimages, which are indicated by the rectangle box in Figure 4A. Figure 4E plots the photoacoustic amplitudes of the selected vertical dashed lines (see Figure 4A) of all reconstructed photoacoustic images for the quantitative analysis, and the contrast-to-noise ratios (CNRs) of the 2 signal peaks were calculated and are listed in the insets. Compared to the BP method, CS effectively improved the CNR of the signals and the CS-wGSM operator provided an even higher CNR with full sampling. In addition, our developed CS-wGSM method was also able to improve the resolution of the reconstructed photoacoustic images, which were intuitively observed in the reconstructed images. In addition, the quantitative values of the imaging resolution were estimated using the index of the full width with half maximum (FWHM). To calculate the FWHM, the segments of the representative signals from the reconstructed images, which are indicated by the arrows in Figure 4A, were selected as the samples. The plots of photoacoustic amplitudes of the selected signal segments are listed in Figure 4F, and the values of the FWHM of these segments were calculated and are shown in this figure. Compared to the BP method, the resolution of the photoacoustic images reconstructed by the CS-wGSM operator showed an improvement of approximately 25%.

Photoacoustic images of the phantom. (A – B) map images reconstructed by BP with data from full sampling and 1/2 sampling rate; (C – D) map images reconstructed by CS and CS-wGSM with 1/2 sampling rate; (E) plots of the photoacoustic amplitudes of (A) – (D) along the vertical dashed line shown in (A), insets: contrast-to-noise ratios of 2 selected signal peaks; (F) plots of the photoacoustic amplitudes of the selected segments of signals (indicated by the arrow in A) and their resolution analysis by FWHM. “full” means full sampling, “1/2” means 50% sampling rate. CS indicates compressed sensing; CS-wGSM, compressed sensing with Wiener linear estimation-based Gaussian scale mixture model.
Imaging a Human Forearm
In practical applications, the penetration depth of the PACT for human forearm imaging can reach ˜3.35 cm. 31 In this experiment, the 3D imaging volume was approximately 20 mm × 60 mm × 15 mm, and each 3D image consisted of 140 B-scans, with each B-scan image having 256 × 128 pixels. Figure 5 shows the photoacoustic images of the human forearm reconstructed by the different methods. Figure 5A is the MAP image, with the maximum photoacoustic amplitudes projected along the depth direction to the surface of the forearm, and it was reconstructed by BP with full measurements. To validate the imaging ability of CS-wGSM, sparse-sampling experiments were performed. Figure 5B-D shows the reconstructed results using the 1/2 sampling data by the BP, CS, and CS-wGSM methods, respectively. Compared to the reconstructed results from the full measurements, the quality of the reconstructed images by BP with 1/2 sparse-sampling data decreased, and the signals became blurred and some sparse-sampling artifacts emerged in the MAP images (Figure 5B). As expected, these artifacts were effectively suppressed by both the CS and the CS-wGSM methods (Figure 5C and D), and the CS-wGSM provided more clear images than CS. To further evaluate the potential of the CS-wGSM operator for sparse-sampling PAI, imaging experiments were performed with heavier sparse sampling data from only one-third transducer elements, and the reconstructed results are listed in Figure 5E-G. With a decrease in sampling data, more artifacts were produced in the results reconstructed by the traditional BP method (Figure 5E). Although, many of these artifacts were suppressed by the traditional CS (Figure 5F), the CS-wGSM method recovered higher quality photoacoustic images with fewer artifacts. To clarify the comparison between the reconstructed results from the different methods, a subregion from the MAP images indicated by the rectangle box in Figure 5A was selected, and the enlarged images of the corresponding subregions from all MAP images are exhibited in this figure. These enlarged subimages clearly show that the CS-wGSM method better suppresses artifacts than the BP and CS methods.

Photoacoustic imaging of a human forearm. (A) Map image reconstructed by BP with full sampling; (B – D) map images reconstructed with data from 1/2 sampling rate, by BP, CS, and CS-wGSM, respectively; (E – G) map images reconstructed with data from 1/3 sampling rate, by BP, CS, and CS-wGSM, respectively. BP indicates back-projection; CS, compressed sensing; CS-wGSM, compressed sensing with Wiener linear estimation-based Gaussian scale mixture model.
To specifically evaluate the reconstructed photoacoustic images, representative B-scans recovered by the different methods are listed in Figure 6. Figure 6A and B shows 2 B-scans selected from the MAP image along the vertical dashed lines of Figure 5A. Figure 6A1 to A6 is reconstructed scans of Figure 6A by the different methods with the 1/2 or 1/3 sampling, and Figure 6B1 to B6 is the result corresponding to Figure 6B. When the 1/2 sampling data were used, the quality of the photoacoustic images reconstructed by the BP decreased, whereas both the traditional CS and our developed CS-wGSM methods effectively suppressed the sparse-sampling artifacts and recovered acceptable photoacoustic images. However, when fewer measurements were used (such as with 1/3 sampling data), although the traditional CS could not effectively filter the artifacts, the CS-wGSM method still exhibited excellent artifact suppression and photoacoustic image recovery and presented a higher CNR and resolution. To further quantitatively evaluate the image quality, the estimated CNRs of the B-scans were also calculated and are shown in Figure 6. The selected peak signals and backgrounds of the CNRs are indicated by circles and rectangular boxes, respectively, in Figure 6A and B. As the amount of sampling data declines, the CNRs of the reconstructed images decreased considerably with the BP, were effectively improved by the CS, and showed the highest values with the CS-wGSM. The CNRs of the CS-wGSM were even higher than those of the control, which led to more effective direct artifact suppression.

Two representative B-scan photoacoustic images selected from the map images in Figure 5 along the vertical dash lines of Figure 5A. a and b, 2 B-scans reconstructed by BP with full measurements; (a1-a3), the B-scans of A reconstructed by BP, CS, and CS-wGSM, respectively, with 1/2 sampling data; (a4) – (a6) the B-scans of A reconstructed by BP, CS, and CS-wGSM, respectively, with 1/3 sampling data; (b1) – (b6) are those results corresponding to B with different methods and sampling data. BP indicates back-projection; CS, compressed sensing; CS-wGSM, compressed sensing with Wiener linear estimation-based Gaussian scale mixture model.
Discussion
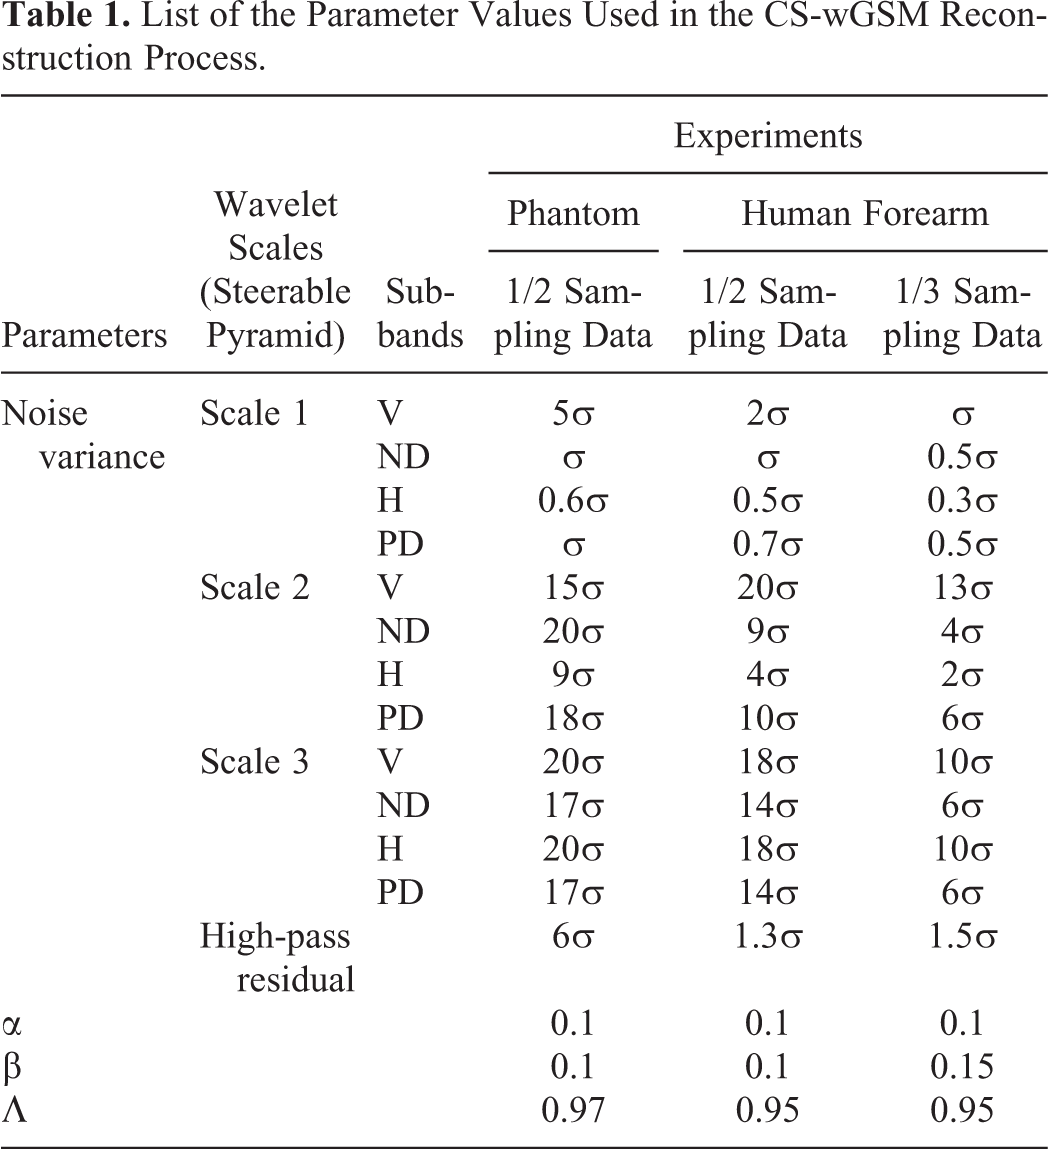
The experiments performed in our work demonstrated the advantages of the developed CS-wGSM method in improving the imaging speed of PACT using sparse sampling. However, several factors that affect image reconstructions by the CS-wGSM method should be discussed. First, the noise variance σ is an important parameter for evaluating the noise level. In practice, a small σ cannot effectively reduce artifacts, whereas a large σ may result in a distortion of the signals. In our limited view PACT with sparse sampling, the artifacts in the reconstructed images were inhomogeneous with the nonstructure features, and the noise characteristics in the different subbands were also different. Therefore, in our work, the noise variance was set adaptively for each subband in the wGSM operator according to the test, with the initial noise estimation obtained by Equation 7 used as a baseline. Table 1 lists the values of the noise variances used in our experiments. Second, the hyperparameters α, β, and λ are also important for the performance of the CS-wGSM-based PACT. Both α and β are regularization parameters that determine the trade-off between data consistency and sparsity, and they must be determined appropriately because overweighed values result in a distortion of the reconstruction. The parameter λ was used to update the noise variance for each reconstruction of CS-wGSM, and it represented the rate of decline of the noise level with successive reconstructions by the CS-wGSM. Currently, an effective method of calculating the optimal values of these parameters is not available, and the values are generally set by performing tests. The values of the parameters used in this work are listed in Table 1. Third, the number of CS-wGSM reconstructions should be set adaptively according to the practical sampling rate and the noise levels. In our phantom experiments with 1/2 sparse-sampling data, 2 reconstructions were sufficient, and for the human forearm imaging with 1/2 and 1/3 sparse-sampling data, 2 and 3 reconstructions were required, respectively. Finally, the choice of the neighborhood of the wavelet coefficients is also important to the CS-wGSM reconstruction. The measurement matrix used in the CS/CS-wGSM method is constructed by the idea of BP, and thus the detected photoacoustic signals will be back-projected to an arc on which the signals were collected by the transducers (the center angle of the arc is determined by the divergence angle of the transducer of the ultrasonic array). As a result, the distribution of the artifacts in the sparse-sampling photoacoustic images is not homogeneous and almost consistent with the direction of the arc. To suppress the artifacts adaptively, 3 principles for neighborhood choosing were used in our work: (1) In the neighborhood defined in the same subband to 1 wavelet coefficient, the positive and negative diagonal coefficients will not be included in its neighborhood vector; (2) in the neighbors not in the negative or positive sub-bands, the corresponding wavelet coefficients located in the “cousin” position will not be included in its neighborhood vector; (3) the parent coefficients in the adjacent scales of the wavelet coefficient (except the high-pass residual) are all included in its neighborhood vector.
List of the Parameter Values Used in the CS-wGSM Reconstruction Process.
To better evaluate the CS-wGSM method, the imaging speed comparisons for different reconstruction methods with different sampling rates are provided in Table 2 and the programs performed on a PC with an Intel Core E5-1620 CPU of 3.4 GHz. It can be seen the reconstruction time of CS is much more than the BP method because of the iteration process, and CS-wGSM is about 1.5-fold of the traditional CS method due to the computation of wGSM operator. In our future work, a parallel computation method with a graphic processing unit will be implemented as a tool for improving the reconstruction speed of the CS/CS-wGSM method.
Comparisons of Imaging Speed for Different Reconstruction Methods.
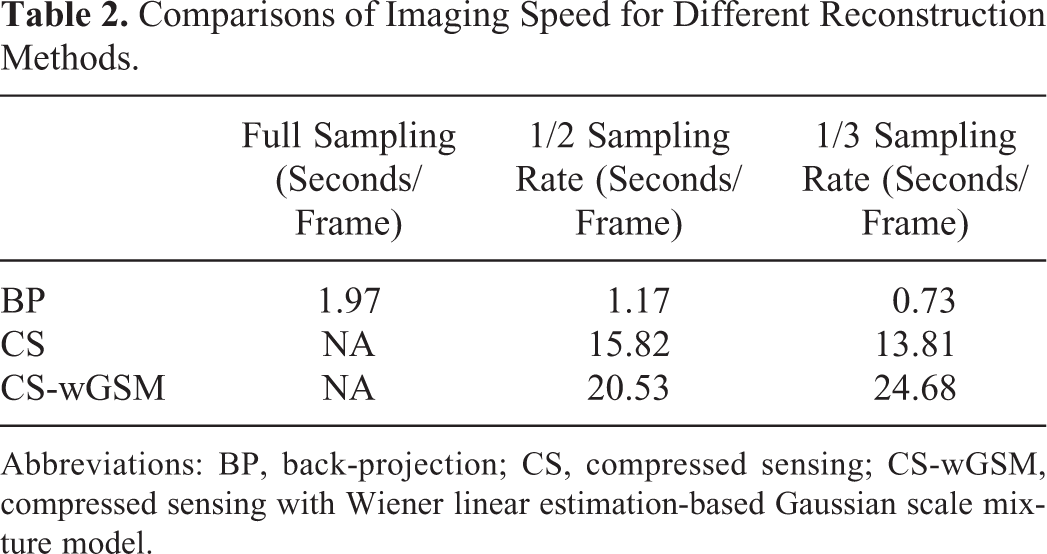
Abbreviations: BP, back-projection; CS, compressed sensing; CS-wGSM, compressed sensing with Wiener linear estimation-based Gaussian scale mixture model.
Conclusion
Overall, the CS-wGSM is a more effective approach for recovering higher quality photoacoustic images using sparse-sampling data than the BP and traditional CS, and it represents a promising method for developing new PACT methods with rapid data acquisition and low system costs and has potential for use in many biomedical studies. However, the implementation of the CS-wGSM method requires rigorous reasoning and a significant amount of dedicated work for the following reasons: (1) For limited view PACT, the neighborhood of the wavelet coefficients should be selected appropriately to improve the consistency with the characteristics of the artifacts and (2) the noise variance must be set adaptively for the specific imaging data and the different subbands through testing. Nevertheless, one beauty of the method is that, for a specific PACT system, the abovementioned parameters mentioned in (1) and (2) require to be set only once in a certain application.
Footnotes
Declaration of Conflicting Interests
The author(s) declared no potential conflicts of interest with respect to the research, authorship, and/or publication of this article.
Funding
The author(s) disclosed receipt of the following financial support for the research, authorship, and/or publication of this article: This work was supported in part by the National Natural Science Foundation of China grants No. 61308116, No. 81522024, No. 81427804, the China-ROK joint research program (NRF-2013K1A3A1A20046921), the MSIT (Ministry of Science and ICT), Korea, under the ICT Consilience Creative program (IITP-2018-2011-1-00783) supervised by the IITP (Institute for Information & communications Technology Promotion), the grant of the Korea Health Technology R&D Project (HI15C1817) through the KHIDI (Korea Health Industry Development Institute), funded by the Ministry of Health & Welfare, Republic of Korea, and the Opening Project of Key Lab of Health Informatics of Chinese Academy of Sciences.