
Abstract
The ultrasound-guided diffuse optical tomography is a noninvasive imaging technique for breast cancer diagnosis and treatment monitoring. The technique uses a handheld probe capable of providing measurements of multiple wavelengths in a few seconds. These measurements are used to estimate optical absorptions of lesions and calculate the total hemoglobin concentration. Any measurement errors caused by low signal to noise ratio data and/or movements during data acquisition would reduce the accuracy of reconstructed total hemoglobin concentration. In this article, we introduce an automated preprocessing method that combines data collected from multiple sets of lesion measurements of 4 optical wavelengths to detect and correct outliers in the perturbation. Two new measures of correlation between each pair of wavelength measurements and a wavelength consistency index of all reconstructed absorption maps are introduced. For phantom and patients’ data without evidence of measurement errors, the correlation coefficient between each pair of wavelength measurements was above 0.6. However, for patients with measurement errors, the correlation coefficient was much lower. After applying the correction method to 18 patients’ data with measurement errors, the correlation has improved and the wavelength consistency index is in the same range as the cases without wavelength-dependent measurement errors. The results show an improvement in classification of malignant and benign lesions.
Introduction
Diffuse optical tomography (DOT) is a noninvasive medical imaging technique capable of providing functional information of the tissue. This technology utilizes light in the near-infrared (NIR) window to assess the interior optical parameters of the tissue, which are closely related to the oxygenated and deoxygenated hemoglobin content within the tissue. 1 –5 Because of its high sensitivity and low cost, DOT applications are growing in many areas, such as functional brain imaging, breast cancer detection and treatment monitoring, and many others. 6 –11
The intense NIR light scattering in tissue imposes a significant challenge to DOT on its spatial resolution and localization accuracy. Coregistration approaches of DOT with high-resolution imaging modalities, such as X-ray, magnetic resonance imaging, or ultrasound (US), have been investigated. 9,12 –15 In these approaches, a lesion is localized and the information of lesion size, shape, and depth obtained from a high-resolution imaging modality can be used to guide the DOT image reconstruction. 16 –20 The US-guided DOT approach developed by our group has improved lesion location uncertainty and reconstruction accuracy of optical parameters. 21 –23 In recent years, a field of shape-based reconstruction techniques has emerged where a priori information about the topology, the approximate location, and shapes of the unknown subdomains and their optical properties can be incorporated in the inversion directly. 24 In the US-guided DOT approach, a semiautomated level set method that extracts tumor information from US images for DOT image reconstruction was introduced. 25
Previous studies have shown the capacity of US-guided DOT in classifying malignant lesions from benign masses. 26,27 However, there are number of challenges for the wide clinical acceptance of this technology. First, the contralateral reference breast measurements used to compute weight matrix and perturbation, which is the normalized difference between lesion and reference measurements, may not be homogeneous. This can reduce the accuracy of fitted background optical properties and then computed weight matrix, which in turn causes inaccuracy in reconstructed lesion optical properties. Second, measurement errors due to low signal to noise ratio (SNR) data at longer source and detector distances and bad coupling between skin and breast tissue are wavelength dependent. For example, SNR of wavelength 740 nm at longer source and detector distances is much lower than longer wavelengths due to higher light absorption of darker skin and skin pigment. 28 –30 Additionally, our DOT system uses a handheld probe which is placed on top of patient’s breast while the patient is in a supine position. Movements of operator’s hand or patient may lead to a bad coupling between the light guides and the breast, which may result in outliers in measurements and then in the calculated perturbations. These outlier measurements are random and significantly affect the accuracy of the reconstructed lesion optical properties.
A variety of experimental and modeling approaches have been developed for system calibration of optical source strengths and detector gains, source and detector (optodes) position errors, and coupling errors between skin and optodes. 31 –39 In general, source strengths and detector gains can be accurately estimated from homogeneous phantom measurements at each experiment and used to compensate tissue measurements. The compensation can be performed independently from image reconstruction 31,33 or as part of the inverse problem for image reconstruction. 32,34 These methods compensate system-related parameters and do not compensate tissue-caused wavelength-dependent measurement errors. Model-based approaches to compensate coupling errors between skin and optical optodes as well as optode position errors have been proposed in several studies. 35 –37 These methods model coupling errors as unknowns and include them in the reconstruction of tissue optical properties either sequentially or simultaneously. The advantage of these methods is the adaptive estimation of the coupling errors; however, the methods require the unknown coupling coefficients minimally vary from their initial estimates. Other approaches include the use of the differences between measurements at 2 separate wavelengths to reduce the coupling errors. 38 A nonlinear approach for difference imaging was studied on how this approach tolerates modeling errors like domain truncation, source and detector coupling errors, and domain shape errors. 39 The challenges we are facing are wavelength-dependent measurement errors caused by low SNR and wavelength-dependent skin and optode coupling errors, which can vary depending on patients’ bulk tissue optical properties, skin conditions, and operator’s hand or patient motion during data acquisition. An effective and robust data processing method is needed to remove these measurement errors while preserving the wavelength-dependent lesion optical properties. The method also needs to be automated to minimize the user interface and facilitate clinical translation. In our early approach, the individual source strengths and detector gains were estimated using a least-square method and compensated before fitting each patient’s background optical properties from the contralateral normal breast measurements. 31 The perturbation approach, which is the difference between lesion and contralateral normal tissue measurements normalized to the contralateral measurements, was used in imaging reconstruction. This approach has canceled out the unknown source strengths and detector gains. In a recent attempt by our group, Vavadi and Zhu et al 40 have introduced a statistical method to automatically remove outliers from contralateral normal breast measurements. This method utilizes multiple sets of reference measurements to produce a robust set of reference. However, in many clinical cases, the outliers due to measurement errors are present in the lesion measurements. Lesion measurements contain wavelength-dependent information and are expected to be more heterogeneous than the reference measurements. To separate the measurement errors from lesion heterogeneity, more information from multiple wavelength measurements can be incorporated in the preprocessing before image reconstruction.
In this study, we introduce a new automated approach for data filtering based on multiple wavelength measurements collected at lesion site. The method combines data collected from multiple sets of lesion measurements to detect and correct outliers caused by wavelength-dependent measurement errors in the perturbation. This method represents an important step toward a fully automated DOT system for its clinical translation. The hypothesis is that there is a strong correlation between multiple wavelength measurements in NIR spectrum collected from the same lesion site and that this correlation has significantly decreased with the presence of wavelength-dependent measurement errors. The hypothesis was tested with phantom and patients’ data.
Method
Ultrasound-Guided DOT System and Data Acquisition
Phantom experiments and clinical studies were performed using our US-guided DOT system. This system consists of 4 laser diodes of wavelength 740, 780, 808, and 830 nm and 10 parallel photomultiplier (PMT) detectors. Laser diodes were modulated at 140 MHz, and the light at each wavelength was sequentially delivered to 9 positions on a handheld probe through optical fibers. Ten light guides couple the reflected light from tissue to 10 parallel PMT detectors simultaneously. As a result, each wavelength data set has 90 measurements. The details of the NIR system can be found elsewhere. 19 To implement statistical tests for outlier detection, we repeated the data acquisition 3 times for each wavelength at the same lesion location, which results in 12 data sets of 90 measurements each.
Automated Preprocessing Approach
Using the US-guided DOT system, multiple sets of measurements are collected from a lesion site and a contralateral normal breast (a reference site) to calculate normalized perturbation. For each wavelength, the normalized perturbation (Uλ) is given as:

where A1 (m) and ∅1 (m) are, respectively, measured amplitude and phase from the mth source–detector pair at lesion site, while
As noted earlier, outliers in the normalized perturbation are mainly caused by measurement errors due to wavelength-dependent low SNR and skin–fiber coupling. In this method, perturbation outliers are detected and corrected by combining measurements of multiple wavelengths. A block diagram of the method is given in Figure 1. This figure illustrates that multiple data sets are acquired from a lesion site and a contralateral site of the normal breast. For each data set, our system is capable of acquiring measurements at 4 different wavelengths: 740, 780, 808, and 830 nm. The perturbation is calculated for each wavelength measurement, which is the normalized difference between the examined lesion and the contralateral normal breast measurements. Next, the correlation coefficients between all wavelengths are calculated to find the weakest correlated wavelength measurement. An outlier detection method is applied to the weakest correlated wavelength measurement to detect the outliers and correct them. This process is followed until all outliers are corrected. The following text is a detailed explanation of the method.

Block diagram of the proposed automated data preprocessing method.
In the first step, the normalized perturbations are used to calculate the correlation coefficients between each pair of wavelengths as 41,42 :
where
In the second step, the method examines each source–detector pair of both real and imaginary perturbation in the selected wavelength to determine outliers. This is achieved by combining 4 wavelength data of 3 lesion data sets, so that for each source–detector pair we have 12 measurements. Using multiple data sets measured at each source–detector pair, we are able to apply statistical test to detect outlier measurements for each source–detector pair and eliminate them.
We use the maximum normed residual (MNR) method for outlier detection. The MNR is a statistical test used to detect outliers based on the largest absolute deviation from the sample mean. By calculating the t distribution with k − 2 degrees of freedom, a threshold value for each source–detector pair i can be obtained as:

where
Once outliers are corrected for the selected wavelength, the correlation coefficients are recalculated between wavelengths with the updated values. If there are still any other weakly correlated wavelengths measurements (correlation <0.6), the above procedure is iteratively followed until all wavelengths measurements are corrected. The corrected normalized perturbation is used for DOT image reconstruction.
Diffuse Optical Tomography Image Reconstruction
The US-guided dual-zone mesh method introduced by our group 9,19 was utilized to perform the DOT image reconstruction. In this framework, we use the coregistered US image to divide the DOT imaging volume into a lesion region as a region of interest and a background region. A finer mesh is selected for the lesion and a coarse mesh for the background region. Thus, the method employs smaller voxel size for lesion and larger coarse voxel size for the background region. This technique notably reduces the total number of voxels with unknown optical properties and keeps it at the same scale as of the total measurements. As a result, the ill-posed DOT reconstruction problem has significantly improved. Born approximation of light propagation in the tissue is utilized for computing the weight matrix and an iterative optimization based on conjugate gradient method is used to compute the lesion distribution at each wavelength.
The reconstructed absorption maps of the 4 wavelengths (740, 780, 808, and 830 nm) are used to compute the tHb map directly using the summation of oxygenated hemoglobin and deoxygenated hemoglobin maps with extinction coefficients given in reference. 45
Computation of Wavelength Consistency Index
To assess the improvement in consistency between reconstructed results obtained from different wavelength measurements, we calculate the absorption coefficient

where “V” is number of voxels and “W” is number of wavelengths. This index is calculated voxel by voxel for absorption coefficient µa(p) of each pair of wavelengths. The value of this index is used as an indicator to compare the improvement in the consistency between wavelengths before and after the application of the method. Since this index calculates the absolute difference between absorption maps at different wavelengths, a low index value is an indicator of high absorption consistency between wavelengths. Likewise, a high index value is an indicator of low absorption consistency between wavelengths.
To evaluate the range of
Results
Phantom Study
We performed phantom study to evaluate the correlation coefficients between measurements of multiple wavelengths at the same target site. In phantom experiments, we used Intralipid solution as a reference to calculate the normalized perturbation. The Intralipid solution is a homogenous medium, which eliminates any reference heterogeneity effect on the calculated perturbation. Moreover, the DOT handheld probe was fixed during data acquisition in the phantom experiments. Outliers caused by patient’s or user’s movements of the handheld DOT probe during data acquisition did not exist in the phantom data.
A phantom target with calibrated value of μa = 0.23 cm−1 and diameter 3 cm was used for experiments. The target was merged in the Intralipid solution (which calibrated as μa =.03 cm−1) at different depths of 2.0 to 3.5 cm in 0.5 cm increments. The same Intralipid solution was used to acquire the reference measurements. Table 1 shows the correlation coefficients between measurements of multiple wavelengths for the target. Here, the presented correlation coefficients are the average correlation values of the real and imaginary parts of the perturbation. The table also shows the reconstructed target absorption coefficients at different depths. The phantom experiments show strong correlation coefficients between measurements of different wavelengths. The correlation coefficients decrease with depths due to lower SNR of the measurements, but all coefficients are above 0.6. Also, we see that reconstructed absorption coefficients are consistent among all wavelengths (Table 1). However, consistency between wavelengths also decreases with depth; the
The Correlation Coefficients, Maximum Reconstructed Absorption, and

Clinical Study
In this study, we have examined a total of 28 patients. These patients are divided into 2 groups based on the wavelength correlation analysis and
In Figure 2, we present the real and imaginary plots versus source–detector distance of normalized perturbation profiles for all 4 wavelengths of a wavelength consistent case with no preprocessing. Both real and imaginary parts of each wavelength show similar trend with other wavelengths, with no visible outliers. The range of the real and imaginary parts of the perturbation is similar across 4 wavelengths.

Real and imaginary plots of normalized perturbation (equation 1) of a wavelength consistent case with no data preprocessing. x-Axis is the source and detector distance in centimeter.
Table 2 shows the correlation coefficients, the maximum reconstructed absorption coefficients of all wavelengths, and
The Correlation Coefficients, Maximum Reconstructed Absorption, and

We have applied the automated preprocessing method to all cases. For wavelength inconsistent cases, measurements with outliers are seen to have weak correlation coefficients with others. An example of a normalized perturbation of a malignant case is illustrated in Figure 3. This figure shows the calculated perturbation profile for each wavelength versus source–detector distance. The wavelength 740 nm is weakly correlated with the other wavelengths, with correlation coefficients of less than 0.6, as summarized in Table 3. This lower correlation value is due to outliers observed in both real and imaginary parts of the 740 nm wavelength shown in Figure 3A. When the automated method is applied, outliers are corrected (Figure 3B) for the 740 nm wavelength and the correlation coefficients are improved (Table 3).

Real and imaginary plots of normalized perturbation (equation 1) of a malignant lesion with (A) no data preprocessing and (B) after applying the proposed automated method. x-Axis is the source and detector distance in centimeter.
The Correlation Coefficients, Maximum Reconstructed Absorption, and

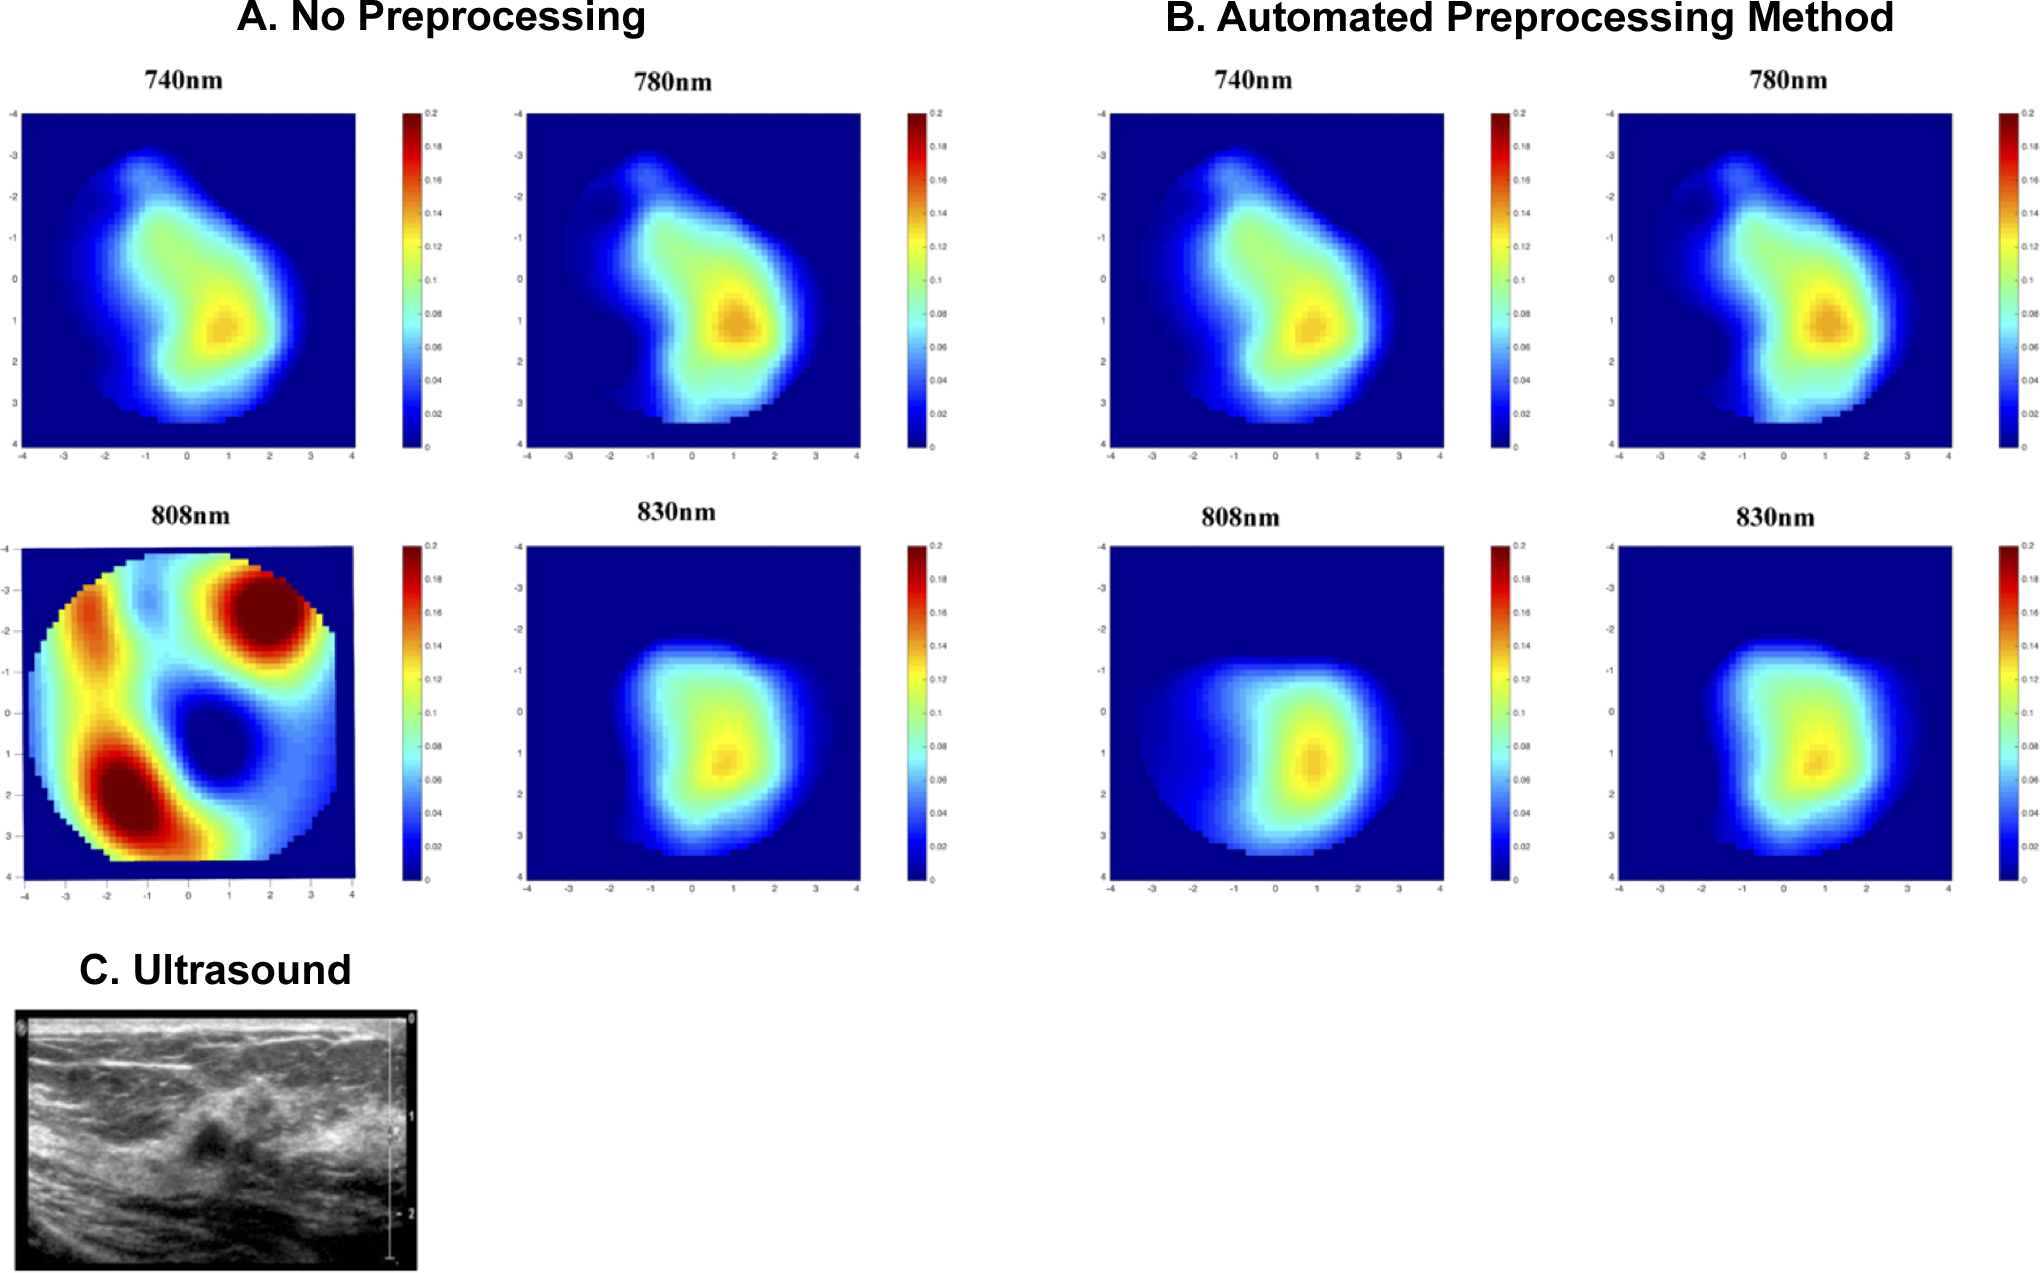
The reconstructed absorption maps of this case are illustrated in Figure 4. Both the reconstructed lesion shape and the maximum reconstructed absorption value for the wavelength 740 nm are not consistent with the other wavelengths (Figure 4A and Table 3). After applying the automated method, we see the shape of this wavelength becomes more consistent with other wavelengths (Figure 4B), and

The reconstructed absorption maps of a malignant lesion (A and B) along with the ultrasound B scan of the lesion (C). Reconstructed absorption coefficients are shown for 4 wavelengths with (A) no data preprocessing and (B) proposed automated method. Each image marked with wavelength represents a spatial image in x and y dimensions of 9 cm scale at the target depth of 2 cm, other depths are not shown.
A benign case is also presented in Figure 5. The wavelength correlation coefficients and the reconstructed absorption coefficients are summarized in Table 4. Based on the wavelength correlation analysis, the wavelength 808 nm is weakly correlated with the other wavelengths. Table 4 summarizes the average correlation coefficients of real and imaginary parts of the perturbation between multiple wavelengths. With no perturbation preprocessing, the reconstructed absorption map at 808 nm is too high and distorted as compared to other wavelengths. When the automated method is used, the
The reconstructed absorption map of a benign lesion (A and B) along with the ultrasound B scan of the lesion (C). Reconstructed absorption coefficients are shown for 4 wavelengths with (A) no data preprocessing and (B) proposed automated method.
The Correlation Coefficients, Maximum Reconstructed Absorption, and

An example of 2 inconsistent wavelength measurements is presented in Table 5. In this example, the wavelengths 740 and 830 nm are weakly correlated with 2 other wavelengths (low correlation coefficients). The correlation between the wavelengths 780 and 808 nm is high. With no preprocessing, the reconstructed absorption coefficient is too high at 740 nm and too low at 830 nm. We applied the automated method to this case and correlation coefficients have improved for the wavelengths 740 and 830 nm. The maximum reconstructed absorption coefficient for 740 nm decreased from 0.35 to 0.16, and the maximum reconstructed absorption for 830 nm has increased to 0.14 and became more consistent with the rest of the wavelengths. Also, the wavelength consistency index (
The Correlation Coefficients, Maximum Reconstructed Absorption, and

The average value of the

The calculated μaCI values for the 2 groups of clinical cases: the wavelength inconsistent cases and the wavelength consistent cases. The figure shows the index values of each group before and after the automated method is used.
The average wavelength correlation coefficients calculated for all 28 clinical cases are summarized in Table 6. Here, the wavelength correlation coefficients of the wavelength inconsistent cases are compared to those of the wavelength consistent cases. The results show the correlation coefficients of the wavelength inconsistent cases after applying the automated method are similar to the correlation coefficients of the wavelength consistent cases.
Average (Standard Deviation) of the Correlation Coefficients of the Clinical Cases.

The reconstructed absorption coefficients of the 4 wavelengths (740, 780, 808, and 830 nm) are used to compute the tHb. The computed tHb for the wavelength inconsistent cases is presented in Figure 7, which shows the calculated tHb for malignant and benign cases before and after applying the automated method. A 2-sided t test was performed between malignant and benign groups before and after applying the automated method. The proposed method shows the statistical significance, where the P value improved from.006 to.001 using proposed automated method. The tHb ratio of malignant to benign group is improved from 2.01 to 2.42 with the automated preprocessing method.

Total hemoglobin concentration of wavelength inconsistent clinical cases before and after the automated data preprocessing method. Red and blue boxes indicate the malignant and benign cases, respectively.
Discussion and Summary
We have introduced a new automated data preprocessing method based on multiple wavelength measurements. In the absence of wavelength-dependent measurement errors in phantom experiments, the data show strong correlations between measurements of multiple wavelengths in the NIR range. In addition, the phantom experiments show a high consistency between reconstructed images obtained from measurements of different wavelengths. Even though both the correlation and the consistency between wavelengths are reduced with target depth, correlation coefficients have maintained beyond 0.6. Similarly, the calculated
The automated preprocessing method was used to analyze 16 malignant and benign wavelength inconsistent cases. The results of this method were compared with those obtained with no data preprocessing. The wavelength correlation coefficients and the consistency indexes,
The lesion shape is also improved and become more consistent with the results of other wavelengths as we see in Figures 4 and 5. With no preprocessing, the reconstructed absorption coefficients of the benign case (Figure 5) at 808 nm are high and distorted as compared to the other wavelengths. The automated method demonstrated the ability to improve the consistency for this case. The shape of the lesion at 808 nm wavelength became more consistent as well.
These improvements were reflected in the tHb. The average value of the tHb for malignant cases increased by 10 μmol/L, while benign group showed similar improvement with tHb reduced by 12 μmol/L. As a result, the malignant to benign tHb ratio was improved by 20% after applying the automated method.
The automated method used in this study focuses only on the cases with one poorly correlated wavelength with other wavelengths, and all analyzed inconsistent cases are having problems in one wavelength. The results show strong improvement in terms of improving the wavelength consistency and robustness of the image reconstruction method. In cases that more than one wavelength measurements are distorted, the method can still be applied using the remaining consistent wavelength measurements to predict the distorted wavelengths and correct the distortion. However, our method requires that the wavelength with measurement outliers should be at most 2 if 4 optical wavelengths are used.
There are 4 major steps for a fully automated US-guided DOT system. First, the system calibration should be done automatically and the code has been implemented in our imaging algorithm. Second, the estimation of background optical properties of the contralateral breast and therefore the computation of the weight matrix should be done automatically after filtering out outliers in the measurements. Third, the perturbation, which is the normalized difference between the examined lesion and the background, should be automated after correcting wavelength-dependent errors and also eliminating other noise due to low SNR. Fourth, the US lesion measurements should be done automatically and these parameters can be inputted into the DOT imaging reconstruction for near-real-time US-guided DOT imaging. In this study, the automated approach for data filtering based on multiple wavelength measurements collected at lesion site is intended to automate the third step data processing, while the method introduced in Vavadi and Zhu 40 was used to automate the second step data processing. The semiautomated method proposed by Mostafa et al 25 is aimed to solve problems of the fourth step. The future work will combine these 4 steps of data preprocessing and validate and refine the combined approach in a large prospective patient study.
In conclusion, this study has introduced an automated data preprocessing method based on measurements of multiple wavelengths. The method eliminates the effect of wavelength-dependent measurement errors in the DOT perturbation, which helps to achieve more accurate reconstruction of optical properties of breast lesions. The automated method also helps to minimize both the user interface and the time for data preprocessing. The average time for the experienced user to manually perform data preprocessing is from 15 to 30 minutes for one patient’s data. The automated method could help to reduce this time to less than a minute. Although the method is demonstrated using US-guided DOT data, it is applicable to any DOT data preprocessing obtained with multiple wavelengths.
Footnotes
Authors’ Note
This study used patients’ data but de-identified. IRB #02-064S-2 (2002-2015).
Declaration of Conflicting Interests
The author(s) declared no potential conflicts of interest with respect to the research, authorship, and/or publication of this article.
Funding
The author(s) disclosed receipt of the following financial support for the research, authorship, and/or publication of this article: The authors acknowledge and thank the funding supports of this work from NIH (EB002136), Connecticut Bioscience Innovation Fund (CBIF) Award #513. Murad Althobaiti acknowledges the funding support of fellowship from Saudi Arabian Cultural Mission of the Royal Embassy of Saudi Arabia.