
Abstract
Leukemia is a fatal disease of white blood cells which affects the blood and bone marrow in human body. We deployed deep convolutional neural network for automated detection of acute lymphoblastic leukemia and classification of its subtypes into 4 classes, that is, L1, L2, L3, and Normal which were mostly neglected in previous literature. In contrary to the training from scratch, we deployed pretrained AlexNet which was fine-tuned on our data set. Last layers of the pretrained network were replaced with new layers which can classify the input images into 4 classes. To reduce overtraining, data augmentation technique was used. We also compared the data sets with different color models to check the performance over different color images. For acute lymphoblastic leukemia detection, we achieved a sensitivity of 100%, specificity of 98.11%, and accuracy of 99.50%; and for acute lymphoblastic leukemia subtype classification the sensitivity was 96.74%, specificity was 99.03%, and accuracy was 96.06%. Unlike the standard methods, our proposed method was able to achieve high accuracy without any need of microscopic image segmentation.
Keywords
Introduction
Leukemia is a type of blood cancer which generates the malignant white blood cells (WBCs) in the human body. These abnormal blood cells affect the blood and bone marrow which causes the immune system to be vulnerable. They can also limit the ability of bone marrow to generate red blood cells and platelets. 1 Furthermore, these malignant WBCs can flow into the blood and cause damage to other parts of the human body like liver, kidney, spleen, brain, and so on, which will lead to other fatal forms of cancer.
Leukemia is classified as either lymphoblastic or myelogenous depending on which type of WBCs is affected. If the affected cells are granulocytes and monocytes, then the leukemia will be classified as myelogenous (acute myeloid leukemia [AML]), and if they are lymphocytes, then the leukemia is classified as lymphoblastic (acute lymphoblastic leukemia [ALL]). 2 According to French American British (FAB) classification, ALL is further categorized into 3 subtypes, which are L1, L2, and L3. L1 type cells are usually small in size and are of similar shape with little cytoplasm. Their nucleus is discoid and well structured. L2 type cells have shape variability and are oversized as compared to L1. Their nucleus is not regular and contains dissimilarities in their cytoplasm. L3 type cells are of identical shape and normal size with round or oval nucleus. They have fair amount of cytoplasm which incorporates vacuoles. They are often larger than L1.
Acute lymphoblastic leukemia is usually diagnosed by performing complete blood count test. In this test, doctor will check if the number of WBCs increases and have some signs of leukemia cell. But sometimes these symptoms are not enough for doctor to confirm that the patient has leukemia. Therefore another method called bone marrow aspiration 3 followed by microscopic examining of blood smear 4 is performed to confirm that patient is diagnosed with leukemia. All these different methods for diagnosing of leukemia are manual which are fully dependent on the professionally trained medical specialists and their experience. Also, these manual methods can be time consuming and costly.
To overcome above mentioned limitations, studies have presented different computer aided diagnosing methods for ALL where microscopic blood image analysis is used for leukemia detection. These methods were found to be more efficient, fast, cost effective, and accurate as compared to manual methods. Joshi et al 5 investigated an automated method for WBC segmentation and leukemia classification. They had used contrast enhancement and histogram equalization for preprocessing of microscopic blood images, then Otsu threshold method was used for white cell segmentation. After extracting shape-based features, K nearest neighbor was trained over those features for classification of normal and blast cells. They were able to achieve an accuracy of 93%. A dual threshold method for lymphocyte segmentations was proposed by Li et al, 6 where they had achieved significant accuracy for segmentation of lymphocytes. They improved traditional single-threshold method by using golden section search to discover optimal threshold value of lymphocytes. Karthikeyan and Poornima 7 proposed a novel method for leukemia segmentation and classification where they used histogram equalization and median filter for preprocessing. For segmentation of lymphocytes, 2 methods including fuzzy c-mean and k-mean were compared. Fuzzy c-means performed better than k-mean clustering for segmentation of lymphocytes. Then support vector machine (SVM) was used for classification of normal and blast cells. An enhanced recognition for ALL cells was presented by MoradiAmin et al, 8 in which they deployed fuzzy c-mean clustering to segment out lymphocytes from background. After extracting different shape-based features, they used principle component analysis for features reduction which were given to SVM for classification of normal and blast cells.
After investigating the previous related work, we come to the point that there is still room available for research for the improvement of leukemia detection accuracy. Acute lymphoblastic leukemia detection is a highly sensitive issue which is related to the health and life of humans. Accuracy of such diagnoses systems should be impeccable for full replacement of human operators by these automated detection systems. Also after reviewing the related work, we have seen that there is very less work done for the classification of ALL subtypes, that is, L1, L2 and L3. Due to their higher intraclass variability as well as interclass similarity, these subtypes are difficult to detect and classify. It is very essential to get correct diagnosis since your subtype plays a vital role to help the doctor in recommending a particular treatment plan.
To overcome the limitations in previous work, we proposed a robust and vigorous automated detection method for ALL detection and classification of its subtype, that is, L1, L2, and L3. For this purpose, we applied concept of transfer learning using the pretrained convolutional neural network (CNN). After the first position of Krizhevsky et al, 9 in ImageNet 2012 competition, deep convolutional neural networks (DCNNs) have shown tremendous performance in object recognition and image classification. So lot of groups in medical imaging deployed DCNNs and they were able to achieve good accuracy. 10 –15 As per our knowledge for leukemia detection only, Vogado et al 16 investigated a pretrained CNN for the features extraction and used ensemble classifiers for classification of normal and blast cells. In this experimental study, we deployed DCNN for detection and classification of ALL and its subtypes which were mostly neglected in state-of-the-art. Also this approach can be further improved to a fully automated system by defining its input output parameters and integrating it as a part of submodule to a fully automated system. Rest of the article is organized as follows: Section “Materials and Methods” explains the methodology and network architecture of the proposed system. Section “Results” presents the results of proposed methodology. Section “Discussion” presents the discussion and analysis about the obtained results. In the end, section “Conclusion and Future Direction” is presented.
Material and Methods
Data Set
Images used in this study were obtained from ALL-Image DataBase (IDB) data set which is a public data set available online. 17 This data set was divided into 2 versions. Acute lymphoblastic leukemia-IDB 1 consisted of 108 images where 59 images were from healthy patients and 49 images were from patients affected with leukemia. Acute lymphoblastic leukemia-IDB 2 data set consisted of 260 images having single cell where 130 images were from patients affected by leukemia and 130 were normal images. These images had resolution of 257 × 257 with 24 bit color depth. In Figure 1, we can see samples of cancerous and healthy images of ALL-IDB2. According to FAB classification, 18 ALL was further categorized into 3 subtypes, which were L1, L2, and L3. Different subtypes of ALL are shown in Figure 2. Our main objective of this study was to classify the subtypes of ALL which were mostly neglected in the previous literature. Due to their interclass similarity and intraclass variability they were difficult to classify. Therefore we used the ALL-IDB 2 data set. For the classification of subtypes of ALL, these blasted images were labeled L1, L2, and L3 by an expert oncologist who labeled each blasted image into ALL subtype manually.

Acute lymphoblastic leukemia-Image DataBase (IDB) 2 sample images. (A) Leukemia cell, (B) leukemia cell, (C) normal cell, (D) normal cell.

Subtypes of ALL according to FAB. (A) A noncancerous cell, (B) L1 type ALL, (C) L2 Type ALL, (D) L3 Type ALL. ALL indicates acute lymphoblastic leukemia; FAB, French American British.
Also to enhance our data set, 50 more microscopic blood images for typical L1, L2, and L3 type cells were collected from Google which were then validated by the expert oncologist. This data set was divided into 60% training data set and 40% for evaluation data set, which was further increased by data augmentation to avoid overtraining.
Data Augmentation
If less number of training cases are used then there is a chance of overfitting. Due to limited number of training data in our data set, we used data augmentation technique by utilizing image manipulation 9,19 where we had applied image rotation and mirroring to increase the training data. Without data augmentation, our network may suffer from considerable overfitting. After applying data augmentation, the number of images were increased to 760 where 500 images were affected with leukemia and 260 images were normal cases. For subtype of leukemia, 500 blast images were subdivided into 266 images for L1 type, 153 images for L2 type, and 81 images for L3 type. Other 260 images were used for normal case. After applying data augmentation training data set for each category become unbalanced which could affect the final results. To overcome this problem, we had equalized the training data set by determining the smallest amount of images in each category. By applying this technique, now each category in training data set had exactly the same number of training samples. The sample images after data augmentation are shown in Figure 3.

Data augmentation of microscopic images by using different rotation angles.
Network Architecture
In this study, we deployed the pretrained AlexNet for detection of ALL and classification of its subtypes. This architecture was proposed by Krizhevsky et al, 9 who deployed this architecture for ImageNet Large Scale Visual Recognition Challenge 2012, 20 and won the challenge in first place. This architecture can be used from Matlab which provides an efficient environment for deep learning and neural network implementation. We utilized concept of transfer learning for deep neural network architecture. Transfer learning is a machine learning technique in which a model trained for some specific task can be used to learn new task by transfer of knowledge. This technique can be effective, fast, and convincing, when we don’t have enough data to train the model from scratch. For AlexNet, input images were Red Green Blue (RGB) color images with resolution of 227 × 227 pixels. It consists of 5 convolutional layers with 3 max polling layers. Each convolutional layer in AlexNet architecture is followed by rectied linear unit (ReLU). All the parameters including the filter size, the number of filters, and stride for each layer are illustrated in Figure 4. For transfer learning, we removed last 3 layers of the pretrained AlexNet which were fully connected layer trained for 1000 categories classification, softmax layer, and classification layer. After removing these layers, we tuned this architecture for 2 tasks, that is, detection of ALL, where we classified the data set into blasted or normal. For this purpose, we added another fully connected layer with 1024 neurons followed by ReLU layer to minimize the features vector for our classifier. After that another fully connected layer was added in which all units were fully connected to 2 class output probability using the softmax function. Our second target was to classify the leukemia cells into its subtypes, that is, L1, L2, and L3, respectively. For this purpose, we changed the last fully connected layer of the architecture from 2 classes to 4 classes’ output probability and rest of layers were same as for the ALL detection. Architecture for ALL subtype classification is shown in Figure 4.The rate of change of network is usually handled by learning rate. In this network, we didn’t change the learn rate of previous layers which were before the last 3 layers; instead, we increased the learn rate of our newly added layers to make them update quickly than the original layers, so that we can learn the new weight of these layers faster. In this study, batch size was set to 28 and max epochs to 100. Training was carried out on a notebook having NVIDIA GeForce GTX 960M DDR5 4096 MB GPU which took around 35 minutes.

AlexNet architecture for acute lymphoblastic leukemia subtype classification. Last 2 layers are newly added.
Results
A pretrained DCNN was deployed for automatic detection of ALL and classification of its subtypes. We analyzed different training results obtained from data set A in which input image was in RGB color, data set B in which input image was HSV (hue, saturation, value) color image, data set C in which input image was YCbCr (luminance, chroma blue, chroma red) color image, and in data set D input image was combination of hue, blue difference and red difference chroma component color channel. Sample images for different color channels are shown in Figure 5. The number of training samples and classification accuracy of different data sets are listed in Table 1. All the data sets retained fair accuracy for the detection and classification of ALL. Among these data sets, data set A retained the best accuracy for the detection as well as classification, in which input images were of RGB color model. For other data sets, ALL detection accuracy was good but subtypes classification accuracy was somehow lower than the RGB color images. This shows that DCNNs were able to classify more accurately over RGB color channels as compared to other color channels including HSV, YCbCr, and combined color channels. Tables 2 and 3 show the confusion matrix for ALL detection and subtype classification over the data set A. It can be seen that RGB color images have shown outstanding performance over other color channels and able to detect ALL and classification of its subtypes into 4 classes, that is, L1, L2, L3, and normal, respectively. Table 4 shows results of different input dimensional feature vectors used in our network architecture. For ALL detection, we were able to achieve an average sensitivity of 100%, specificity of 98.11%, and accuracy of 99.50%. For ALL subtype classification, we were able to achieve an average sensitivity of 96.74%, specificity of 99.03%, and accuracy of 96.06%. Average performance metrics of proposed approach are shown in Table 5. Our proposed network architecture took near to sublinear time complexity of O(n) to learn and perform detection and classification of leukemia.

Images created by different color models (from left to right: original Red Green Blue [RGB] image, HSV color image, YCbCr color image, Hue Chroma Blue Chroma Red [HCbCr] color combination image). HSV indicates hue, saturation, value; YCbCr, luminance, chroma blue, chroma red.
Classification Accuracies (%) for Different Color Channel Combination Data Sets.
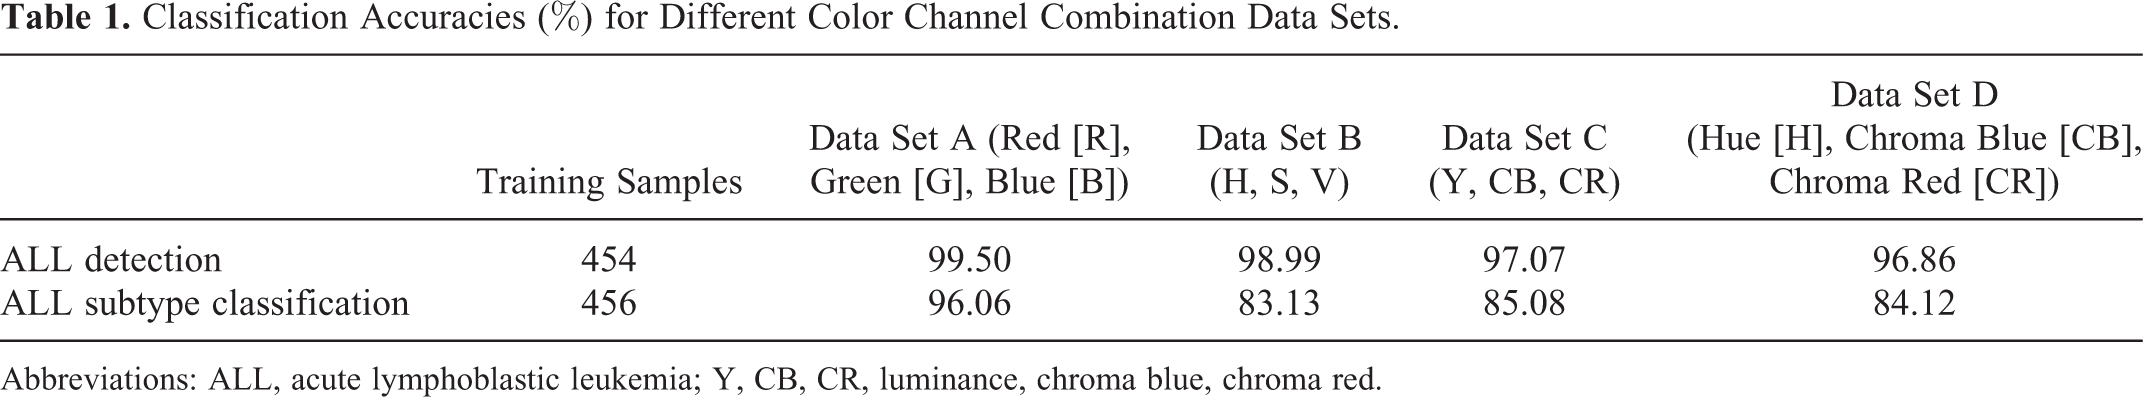
Abbreviations: ALL, acute lymphoblastic leukemia; Y, CB, CR, luminance, chroma blue, chroma red.
Confusion Matrix of ALL Detection Result for Data Set A.
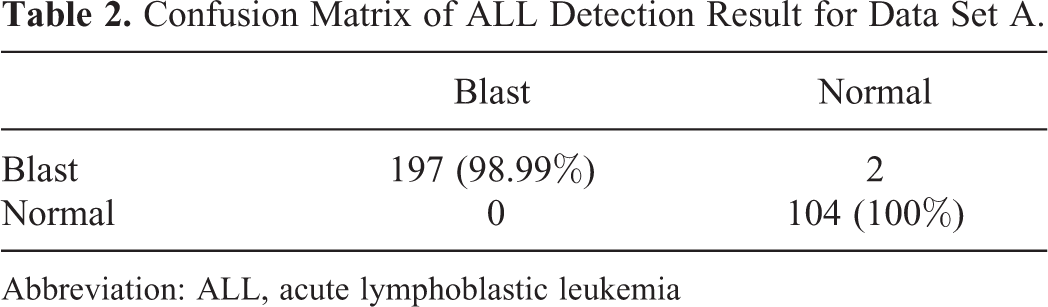
Abbreviation: ALL, acute lymphoblastic leukemia
Confusion Matrix of ALL Subtype Classification for Data Set A.

Abbreviation: ALL, acute lymphoblastic leukemia.
Classification Accuracies (%) for Different Dimensional Feature Vector.

Abbreviation: ALL, acute lymphoblastic leukemia.
Average Performance of CNN (AlexNet) For Data Set A.

Abbreviation: CNN, convolutional neural network.
Discussion
By using DCNN, we have performed automatic detection of ALL and have classified its subtype into 4 classes. Our proposed method has performed effectively and also it is better than the previous standard methods because it doesn’t need segmentation of the microscopic images as required by previous feature extraction methods. The convolutional and other hidden layers in DCNN are enough powerful that they can automatically detect and classify specific leukemia cells from large microscopic image data set.
Deep neural networks usually required large amount of data for training. But in this study, in spite of our limited data set, we were able to achieve higher accuracy of 99.50% for leukemia detection and 96.06% for leukemia subtype classification by using data augmentation and fine tuning of pretrained DCNN.
From the 4 data sets, data set A provided the best accuracy for the ALL detection and its subtype classification. Small difference between accuracy of other data sets shows that deep neural networks are powerful enough to detect leukemia images with different color intensities.
Abundant amount of work in state of art proposed different leukemia detection techniques but most studies neglected the classification of its subtypes due to their much interclass similarity and intraclass variability. Though these subtypes are difficult to classify, they play an important role in detailed diagnosis of disease and is very crucial for the medical treatment of leukemia.
In this preliminary study, we performed automatic detection of ALL and classification of its subtypes into 4 classes. In contrary, MoradiAmin et al 21 proposed leukemia detection and classification method in which they used histogram equalization and linear contrast stretching for preprocessing. For image segmentation, k-mean clustering was deployed and after extracting different features SVM classifier is used for classification of ALL subtypes. On their specific data set, they are able to achieve 97% accuracy for leukemia detection and 95.6% accuracy for ALL subtype classification. Even though the results can’t be directly compared with their data set, we deduce that better results can be achieved using DCNN without involvement of image segmentation.
Another leukemia detection method was proposed by Putzu et al, 22 in which they deployed zack algorithm for the segmentation of leukocytes. After that, SVM classifier was used to classify normal and cancerous cells on the given features. They are able to achieve 92% accuracy. Chatap et al 23 deployed global thresholding using Otsu threshold technique for segmentation of lymphocytes. After extracting shape-based features, k nearest neighbor classifier was trained to achieve an accuracy of 93%. The system we investigated in this study retains the highest accuracy between all the methods discussed in the literature. Also we have used larger amount of images as compared to others giving a more prominent unwavering quality in the outcomes and evaluating the approach using ALL-IDB 2 data set. Performance comparison of different methods provided in literature with our proposed method is shown in Table 6.
Classification Accuracy Comparison With State-of-the-Art Classifiers.

Abbreviations: ALL, acute lymphoblastic leukemia; ANFIS, adaptive neuro-fuzzy inference systems; KNN, K nearest neighbor; PNN, probabilistic neural network; SVM, support vector machine.
One of the limitation of our investigation system is that we skipped the suppression of noise from images, although it didn’t have much effects over the performance of our proposed system. However, there are different methods available to reduce the noise from images which could enhance the performance of the algorithm. These methods include median, mean, unsharp filters, gaussian smoothing, conservative smoothing, and frequency filter. Also in this study, we have used limited amount of training and evaluation data set which can affect the training process of deep neural network. Therefore in future, we plan to deploy deep learning to learn from scratch with larger image data sets so that these diagnostic system can be used in everyday life and help the pathologist and oncologist to diagnose the leukemia effectively.
Conclusion and Future Direction
In this work, we investigated an application of DCNNs in which we deployed pretrained AlexNet for the detection and classification of ALL and its subtypes. By performing data augmentation, we are able to achieve 99.50% accuracy for leukemia detection and 96.06% accuracy for its subtype’s classification. This automated diagnosing system can help in early diagnosing of leukemia so that it can be treated effectively. In future, one of the promising direction for researchers is to deploy different deep learning architectures for classification and detection of leukemia and compare these architectures to check which network performs well for the diagnosing of ALL. Also we can deploy deep learning models to learn from scratch with larger image data sets so that these diagnostic system can be used in everyday life and help the pathologist and oncologist to diagnose the leukemia in better way. This approach can also be further improved to a fully automated system by defining its input output parameters and we can consolidate it as a part of sub module to a fully automated system. Also another future direction for researchers is to develop an automated detection system for AML so that all different types of blood cancer can be automated.
Footnotes
Declaration of Conflicting Interests
The author(s) declared no potential conflicts of interest with respect to the research, authorship, and/or publication of this article.
Funding
The author(s) received no financial support for the research, authorship, and/or publication of this article.