
Abstract
Religion is on the decline in the United States. Americans increasingly report low religiosity, have less attachment to religion, and a rapidly growing number identify as nonreligious. In Congress, the story is different. While a quarter of the public identifies as nonreligious, only one member of Congress does. Why are the nonreligious vastly underrepresented in government? I use a conjoint candidate choice experiment to causally link religious voters’ bias against nonreligious candidates to reduced support for them in electoral settings. I demonstrate that bias against the nonreligious affects electoral decisions and is causally linked to the exclusion of the nonreligious from government. Furthermore, I show that nonreligious voters only exhibit in-group support for candidates who explicitly identify as Atheists, not agnostic or candidates that merely lack a religious identity.
Introduction
The nonreligious: atheists, agnostics, and nones 1 comprise between 20 and 25% of the population in the United States, making them the second-largest religious group, behind Christians, (Pew Research Center, 2019). This large and rapidly growing group emerged in the 1990s as Christian identification plummeted and Church attendance collapsed (Pew Research Center, 2019). However, this enormous increase in the number of nonreligious identifiers has not translated into representation. The nonreligious are almost totally excluded from government in the United States as only one sitting official at the Federal level explicitly identifies as nonreligious (Sandstrom, 2019). 2 Nearly one quarter of the population is nonreligious but only 1/535th of the present Congress publicly identifies as nonreligious. Here, a paradigm contrary to the core tenets of our society exists. In a democratic nation that often prides itself on representing diverse constituencies descriptively, a large and rapidly growing religious group is underrepresented by a factor exceeding one hundred. Were this occurring with a racial group or even a non-Christian minority religious group, such glaring underrepresentation would result in condemnation and panicked attempts to elect descriptive representatives. However, no such concern exists for the unrepresented nonreligious masses of America; the issue is barely known about and scholars have only begun examining the issue as one of representation.
Traditionally, legislative bodies and governments more broadly have been dominated by men from dominant racial, ethnic, and religious groups (Hughes, 2013). Descriptive representation or the actual presence of minorities in legislative bodies is a thriving area of research and a proven method of minority protection. More recently, the importance of having groups actually represented in legislatures by members of their own has been widely embraced. There are two reasons to prefer descriptive representation. The first argument for descriptive representation is that substantive policy outcomes may differ if previously excluded groups are represented by their actual presence in policy making bodies. For example there is significant evidence that substantive policy gains are made by women via descriptive representation (Chattopadhyay & Duflo, 2004) and evidence that this argument holds for both religious (Tatari, 2010), ethnic (Dunning & Nilekani, 2013), and racial (Cameron et al., 1996) minorities. For nonreligious groups, these arguments are theoretical and based on assumed beliefs in secular institutions because no empirical work has been done to date (Yates, 2007). However, the theoretical argument is rather convincing and can appeal to anyone, religious adherents included, interested in establishing a separation between church and state, or the non-establishment of a state sponsored religion. The exclusion of nonreligious Americans from government functions as a de facto religious test. Their exclusion from government imperils this separation and creates an implicit link between religion and the state. The presence of nonreligious representatives would almost certainly aid in the establishment of a more secular state, and ironically, a better environment for religious life free from government preferences for one faith over another.
The second argument for descriptive representation is about stigmatization and political alienation, even if inclusion does not affect substantive policy, it is an important component of democracy. Representation of minorities or marginalized groups may reduce political alienation (Bieber, 2004). It sends signals about which groups are perceived as “fit to rule” (Mansbridge, 1999) or make effective role models (Phillips, 1998). In the United States, this argument would seem to apply perfectly to a group that is presently excluded from government and explicitly barred from holding office in seven US states (Goodstein, 2014). Levels of animosity toward atheists and agnostics are consistently higher than toward Muslims and other outgroups (Jones, 2012; Saad, 2020). The nonreligious, particularly atheists, are among the most hated and disliked groups in America and are arguably the most disliked. Perhaps their exclusion from government sends a clear message that the nonreligious are not a group deemed fit to rule or welcome in the halls of power. Exclusion then furthers marginalization through alienation and the perpetuation of biased attitudes.
Whether inclusion promotes representative policy, better policy for all groups, rights protection, or reduces stigmatization and alienation, the argument for minority representation in legislative bodies is strong. Given that no other group that comprises such a large section of the population is similarly excluded from government in the United States, the normative case for nonreligious representation is similarly strong. Such exclusion is unimaginable with regards to other minorities in the 21st century so understanding this exclusion is both interesting and normatively valuable.
The inconsistency between the number of nonreligious people and the number of nonreligious representatives creates a puzzle: Why has this large and rapidly growing religious group not achieved meaningful descriptive representation? This paper builds on previous work showing widespread negative perceptions of nonreligious candidates (Madrid et al., 2022) and provides evidence of a causal mechanism linking outgroup bias to electoral behavior among voters. I argue that outgroup bias among religious voters is the mechanism driving the underrepresentation of the nonreligious and is the primary reason for the group’s exclusion from government.
I demonstrate the causal link through a conjoint candidate choice experiment, wherein nonreligious identity reduces support among the religious. Candidates whose religious identity was atheist, agnostic, or none were significantly less likely to be selected by religious respondents. Furthermore, I find that nonreligious voters do not exhibit generalized ingroup support for nonreligious candidates. Only candidates identified as atheists were more likely to be selected by nonreligious respondents. I conclude that, because of their religious identity, nonreligious candidates are likely to lose support from religious voters and are not able to reliably gain additional nonreligious votes. This evidence provides a causal link between bias and electoral behavior. The lack of nonreligious representatives is being driven by religious voters’ bias against them in an electoral context. The further lack of generalized support from nonreligious voters likely means that it is unlikely that gains in representation will accompany the groups expected expansion. Consequently, remedying the lack of nonreligious representatives will likely require efforts to reduce outgroup bias and misperceptions of nonreligious persons generally.
Outgroup Bias
Previous literature presents three sources for reduced trust and bias against the nonreligious. The first is a simple out-group cue, wherein the religious perceive the nonreligious as an “other.” Second, the explicit association of religious identity with morality provides a rational basis for bias against the nonreligious, particularly with regards to public office holding. A sincerely held belief that religion is the source of morality naturally leads to suspicion of the nonreligious and bias against nonreligious persons and candidates. Unsurprisingly, bias against the nonreligious is predicted by the strength of association between religion and morality (Gervais et al., 2011). Third, implicit processing has been found to bias even weakly religious or nonreligious persons against the nonreligious due to implicit preferences formed early in life (Albertson, 2011). The inclusion of implicit bias means that even the nonreligious can exhibit an implicit preference for religious candidates and may not universally exhibit an ingroup preference for nonreligious candidates.
Atheists have long been one of the most disliked groups in America (Edgell et al., 2006; Schafer & Shaw, 2009). Atheists are rated the lowest of any group when individuals are asked whether certain groups share their worldview (Edgell et al., 2006). Economists have found that in trust games participants exhibit more trust toward highly religious participants (Tan & Vogel, 2008). Similarly, sociologists have found that many Americans “associate religiosity with morality and trustworthiness” and view religious identity as a “basis for citizenship and a source of a common American identity” (Edgell et al., 2006). Moral psychologists have found that “for many people in many cultures, morality is religion” (Rai & Fiske, 2011). Bias against nonreligious persons is pervasive, with negative feelings toward the nonreligious, highest among the most religious (Gervais et al., 2011).
Particularly relevant to politics are findings that the public is explicitly unwilling to vote for nonreligious candidates. Gallup’s willingness-to-vote measure, has consistently ranked atheist at or near the bottom of citizens’ willingness to vote for an otherwise qualified candidate (Saad, 2020). Among identity groups only gay/lesbian candidates have ever been ranked lower than atheist by respondents to Gallup’s polls, occurring only in 1979. Furthermore, Madrid et al. (2022) show that this bias is rooted in broad negative perceptions of nonreligious candidates as well as perceptions of incompetence across a range of policy issues. They outline a framework based in social identity theory (Tajfel & Turner, 1979) wherein nonreligious candidates are evaluated as a group outside the mainstream of American political life. These findings provide a rich description of what the bias against nonreligious candidates looks like. However, no work to date has linked findings of bias to actual behavior in an electoral context or asked whether the nonreligious exhibit ingroup support for nonreligious candidates.
This paper provides a link between bias against nonreligious candidates and candidate choice in an experimental setting. I demonstrate a causal mechanism by which the nonreligious have been excluded from democratic government in the United States. Given the literatures’ broad findings of generalized bias against the nonreligious (Albertson, 2011; Edgell et al., 2006; Gervais et al., 2011; Rai & Fiske, 2011; Tan & Vogel, 2008), and nonreligious candidates specifically (Madrid et al., 2022), I expect religious voters will be less likely to support nonreligious candidates, ceteris paribus. I hypothesis that bias against the nonreligious is causally linked to the group’s exclusion from government via electoral disadvantage. Religious voters are less likely to support nonreligious candidates, and thus, candidates without religious identities either lose elections, conceal their identity, or choose not to run. 3 Furthermore, I expect religious voters do not make distinctions between nonreligious subgroups and will exhibit bias against candidates identified as atheists, agnostics, or nones. These expectations lead to two hypotheses about religious voters, stated formally here:
My hypotheses: First, religious voters will be less likely to support candidates with nonreligious identities (Analysis 1). This first hypothesis comes from broad evidence of bias and dislike against the nonreligious and is likely the driving force behind underrepresentation.
Second, religious voters will not make distinctions between the nonreligious subgroups and will be less likely to support candidates with all nonreligious identities (Analysis 2).
Ingroup Support
The existence of widespread outgroup bias against the nonreligious has broad support in the literature. Ingroup voting behavior has been well supported among religious groups (Hunter, 2001; Verkuyten, 2007). However, much less work has been done to examine the nonreligious themselves as a political group. Like other politically relevant religious groups, the nonreligious have a common partisan and ideological identity. They have long leaned heavily toward identifying as liberals and Democrats similar to how Evangelicals identity as conservative Republicans (Pew Research Center, 2012). The nonreligious have a stable common set of policy preferences for increased secularism, abortion rights, and LGBT rights (Pew Research Center, 2012). Interest groups like American Atheists organize nonreligious Americans in the political sphere and further collective organizations for the nonreligious exist (Smith, 2013).
Ingroup behavior is documented among the nonreligious for decisions such as charitable giving (Hawkins & Nosek, 2012). Yet, no work to date has shown a preference among nonreligious voters for ingroup candidates. Therefore, I hypothesize that a lack of ingroup support for nonreligious candidates provides a further mechanism beyond outgroup bias to explain the lack of representation. I propose that, unlike racial groups (Barreto, 2007), nonreligious candidates do not receive a general increased support from ingroup members (nonreligious voters). Why would it be the case that an ingroup fails to exhibit a preference for ingroup candidates?
I propose that candidates’ nonreligious identity does not provide voters with heuristic information about a candidate. Nonreligious identity does not provide useful heuristic information like evangelical identity. “Evangelical” serves as a useful ingroup heuristic because a large percentage of identifiers have similar right wing beliefs and those beliefs are publicly linked to the identity (Wilcox et al., 2003). Furthermore, Evangelicals have a history of political activism and a large number of elected officials identify with evangelicalism (Wilcox et al., 1989). Thus, an environment exists that allows a voter to make heuristic judgments about a candidate identified as evangelical because the identity is publicly associated with preferences that ingroup members are likely to share and voters have existent examples of evangelical candidates to inform their intuitions about how such candidates preform in office. Neither of these conditions hold for nonreligious candidates. First, nonreligious identity is not publicly associated with a particular set of policies or an ideology. So even if the group members have coherent policy preferences, the lack of public association between the identity and particular policies limit its heuristic effectiveness. Second, voters cannot look to existent nonreligious office holders to inform their intuitions about the performance of a nonreligious candidate because there are essentially no nonreligious office holders.
Furthermore, many nonreligious voters may have an implicit preference for religious candidates due to early socialization (Albertson, 2011). As a result, I expect nonreligious support for nonreligious candidates to be much lower than other religious groups’ support for ingroup candidates. This lack of ingroup support, combined with outgroup bias, can explain the lack of representation in districts with high numbers of nonreligious voters where we might otherwise expect nonreligious candidates to perform well. These expectations lead to the hypotheses about nonreligious voters, stated formally here:
Third, among nonreligious voters there will be no differences in support for candidates with nonreligious and religious identities (Analysis 3). Low levels of support for nonreligious candidates among the nonreligious are expected as a component of my theory to explain the lack of representatives from areas where the nonreligious are geographically concentrated.
Fourth, among nonreligious voters there will be no differences in support for candidates with different nonreligious identities: atheist, agnostic, and none (Analysis 4).
Methodology: Conjoint Design
To test my hypotheses, I fielded a conjoint experiment on a national sample. I employ a conjoint design because it is the ideal method for testing whether an identity effects voters’ likelihood of supporting a candidate (Hainmueller et al., 2014). Conjoint analysis allows researchers to identify component specific causal effects by randomly manipulating multiple attributes simultaneously. Additionally, conjoint design limits concerns about social desirability by providing respondents multiple identities to justify discriminatory choices (Wallander, 2009). A conjoint analysis run on a sample subsetted to respondents with religious identities allows for causal claims about religious persons’ preferences and behaviors in similar real-world circumstances. Conversely, a conjoint analysis run on a sample subsetted to respondents with nonreligious identities allows for causal claims about nonreligious persons’ preferences and behaviors in similar real-world circumstances.
The conjoint experiments detailed and presented below as Analyses 1–4, are indented to answer the following questions. First, do the biases that religious voters hold against nonreligious candidates, noted in the literature (Madrid et al., 2022), translate into a reduced likelihood of supporting nonreligious candidates? Second, does descriptive representation matter for nonreligious persons such that they are more likely to support nonreligious candidates? Third, do religious voters make distinctions between different types of nonreligious candidates or is bias generalized? Fourth, do nonreligious voters make distinctions between nonreligious subgroups, such that they are more likely to support nonreligious candidates of a particular identity?
Conjoint Attributes.
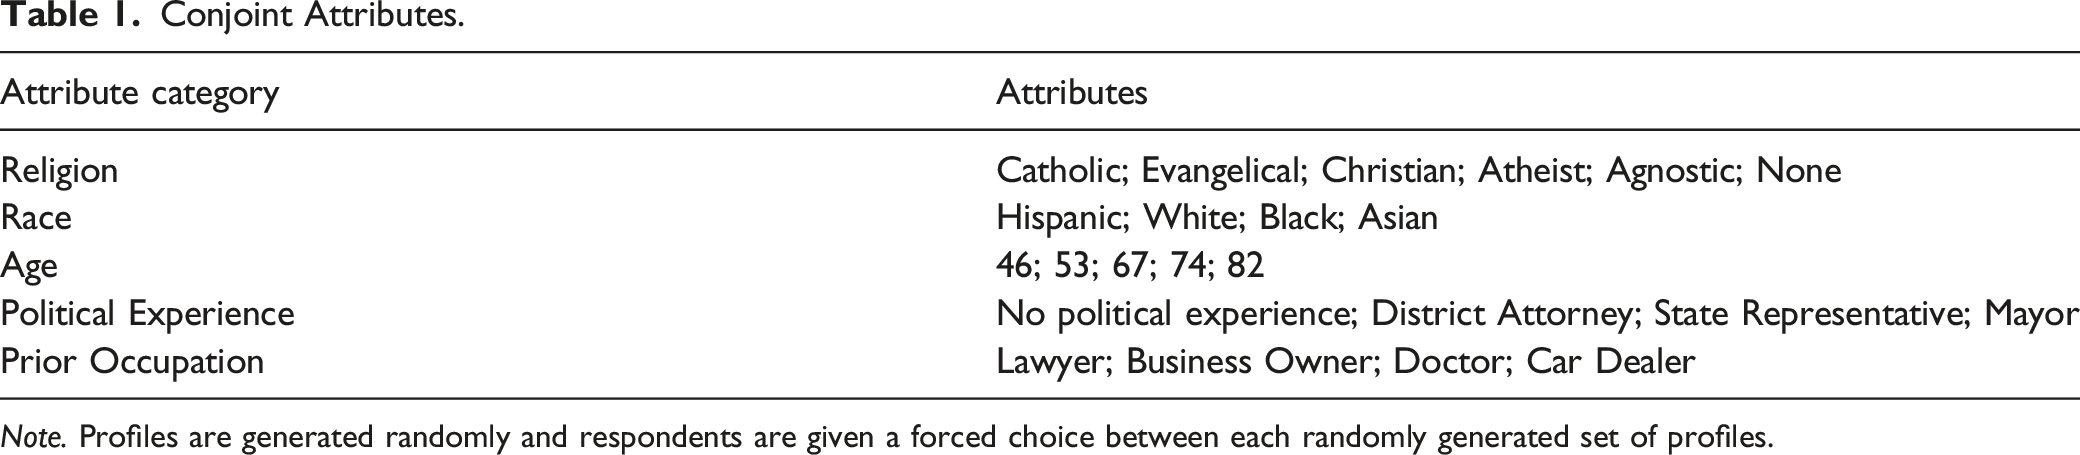
Note. Profiles are generated randomly and respondents are given a forced choice between each randomly generated set of profiles.
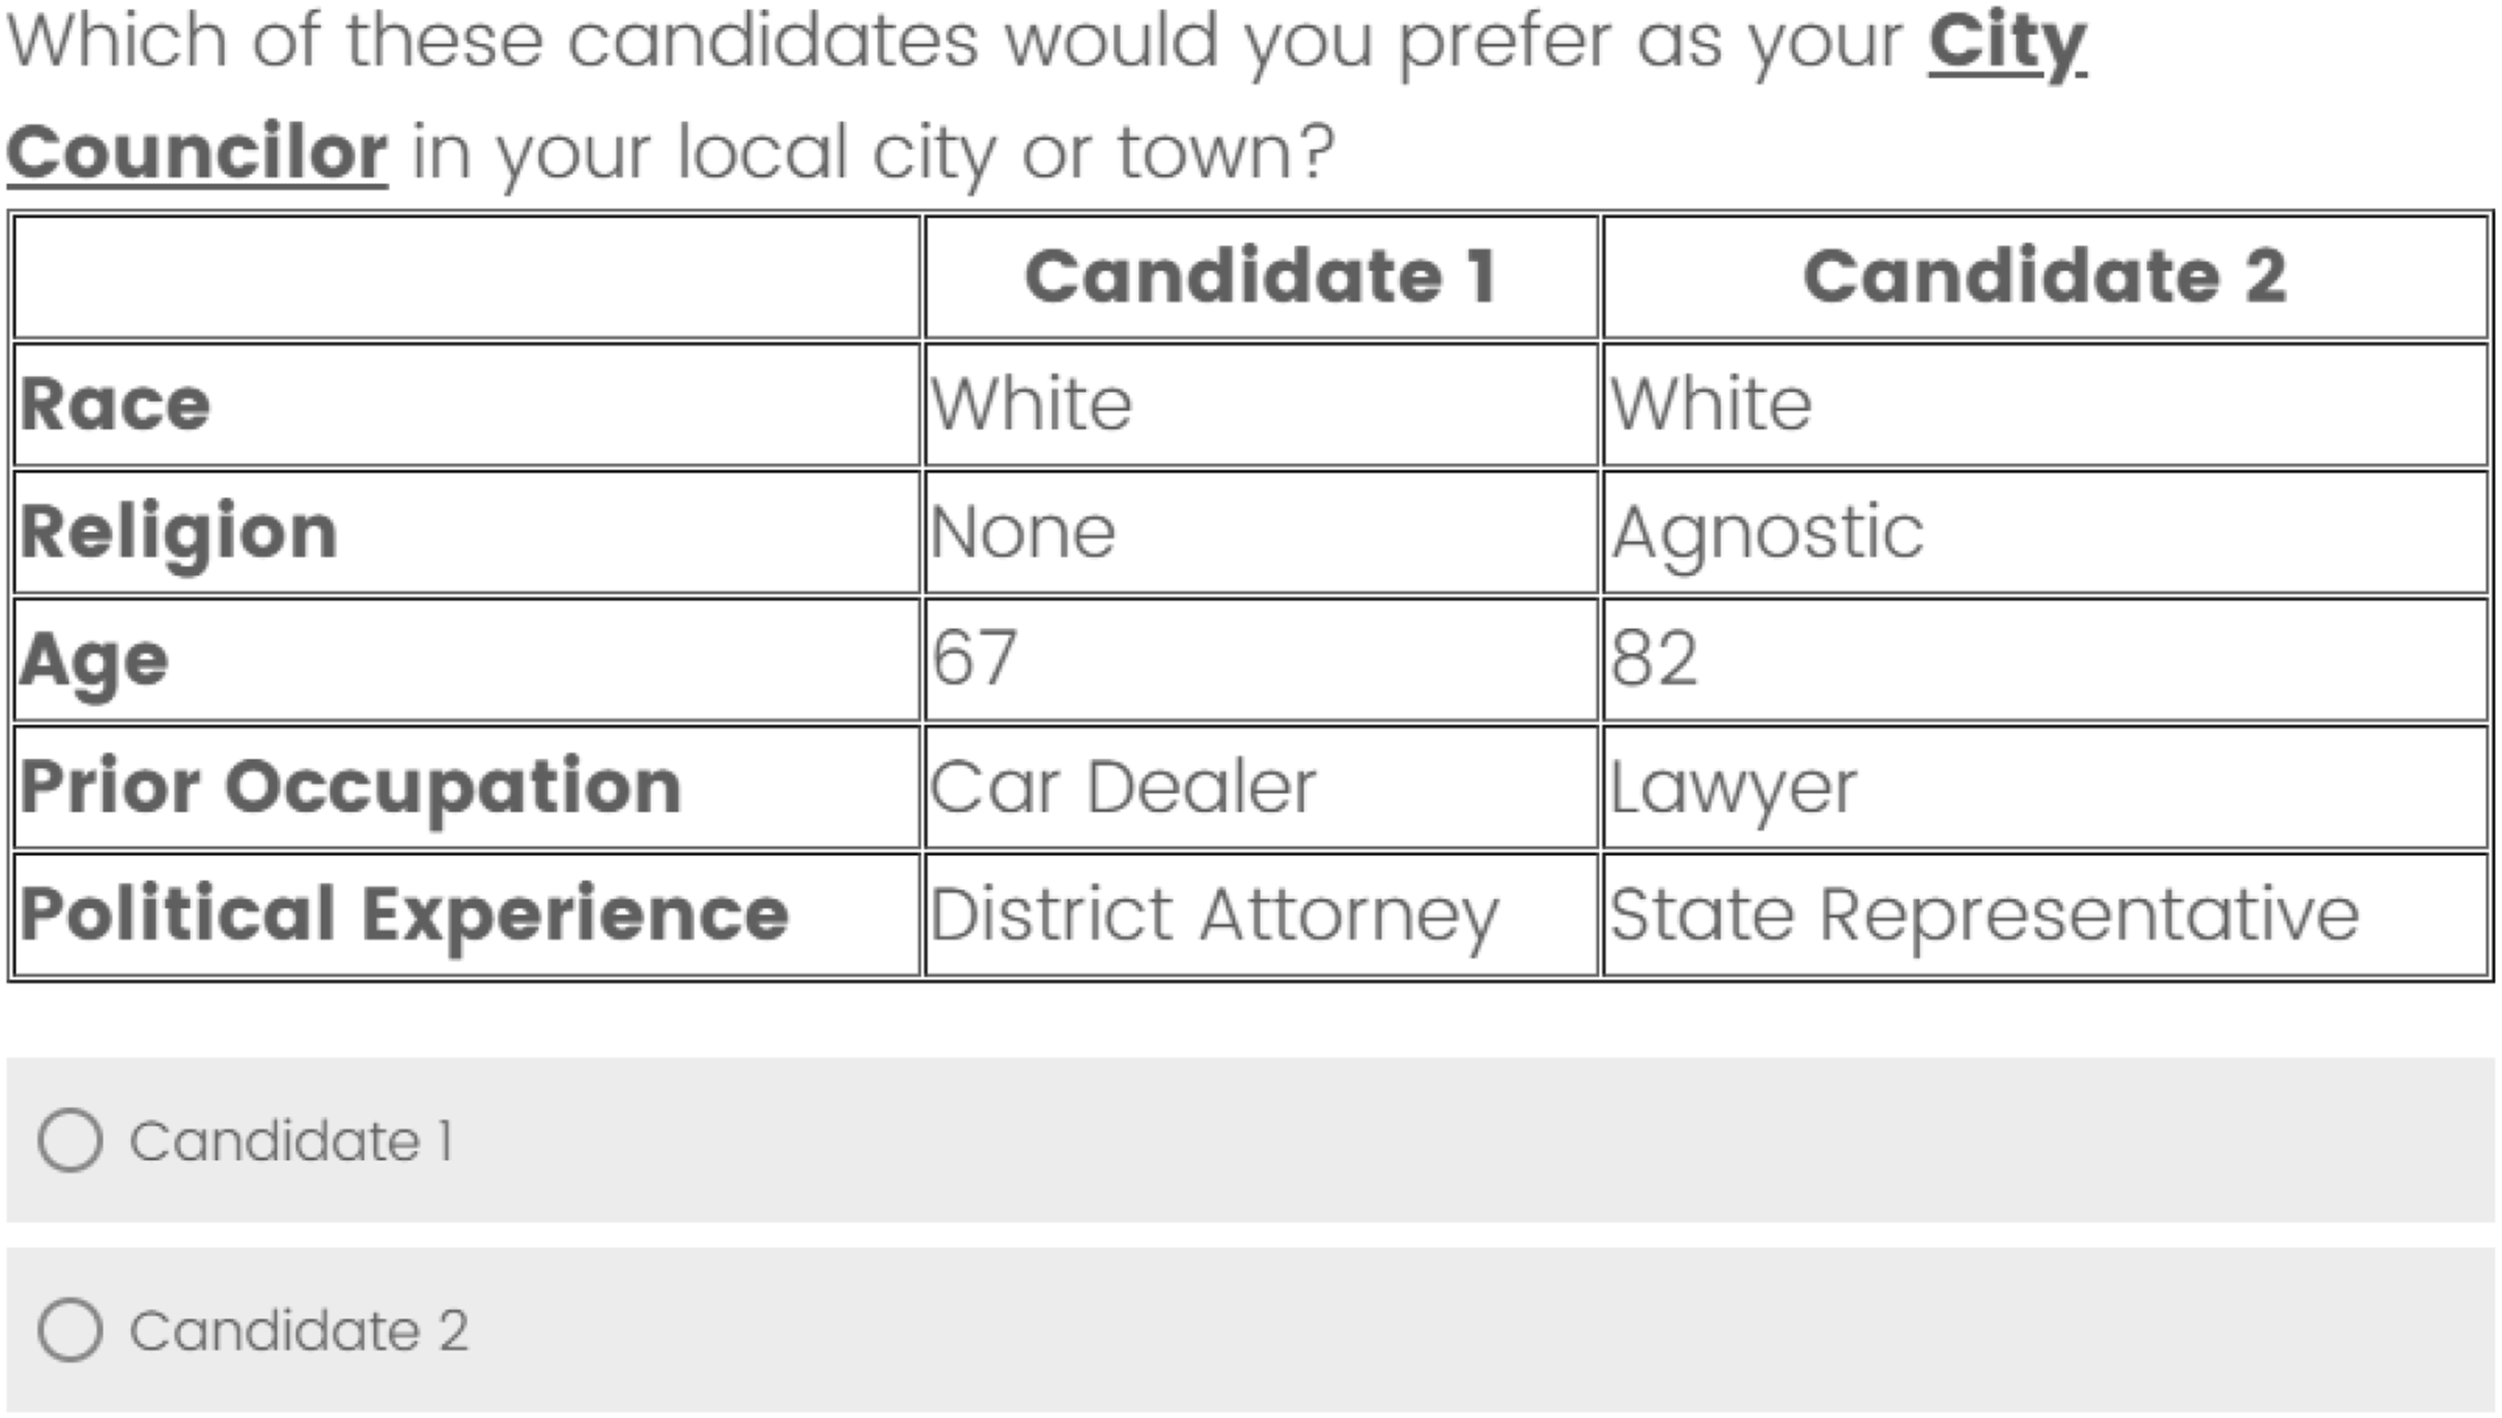
Conjoint profile example. Note. Profiles are generated randomly and respondents are given a forced choice between each randomly generated set of profiles.
A “forced choice” between the two candidates was used to enable evaluation of the role of each attribute value plays in the assessment of one profile relative to another. An example profile is displayed in Figure 1. This forced choice is designed to mimic real-world situations wherein voters choose between candidates who differ on multiple attributes. The question structure is keeping with the experimental procedure from Hainmuller et al. (2014). Respondents have no additional information to make decisions on and the profile attributes are fully randomized. Therefore, any effects estimated from profile categories cannot have a cause other than the text displayed as a candidate attribute.
The inclusion of five attributes obscures the study’s focus on religious identity and ensure internal validity (Hainmueller et al., 2014). The additional attributes, also detailed in Table 1, were candidates’ previous profession (Lawyer; Business Owner; Doctor; Car Dealer), racial/ethnic background (Hispanic, White, Black, and Asian), age (46, 53, 67, 74, 82) and previous political experience (No political experience; District Attorney; State Representative; Mayor). Candidates’ religious identity took one of six values; three of which were nonreligious values (Atheist, Agnostic, or None) and three of which were religious values (Catholic, Evangelical, and Christian). The inclusion of three nonreligious categories is designed to determine if, and to what degree, the subgroups matter in participants’ selection of candidates. Party ID was not included in order to avoid crowding out the other attributes (Kirkland & Coppock, 2018). These candidate attributes function as the independent variables and selection or not of a profile by respondents’ functions as the dependent variable.
Estimates are calculated as the effects of profile or candidate religion on the likelihood of selection using the Average Marginal Component Effects (AMCE). The AMCE reports the average effect of conjoint profile attributes on the likelihood that respondents choose a given profile. In other words, the “AMCE is interpreted as the average change in the probability that a profile will win support when it includes the listed attribute value instead of the baseline attribute value (Hainmueller et al., 2014, p. 19).” Importantly, reported effects can only be interpreted versus the baseline value, not against each other. Figures and tables report AMCEs versus the baselines but cannot be interpreted against each other. Controls for all AMCE models presented include all other profile attributes, and all models used standard errors clustered by respondents as suggested by Hainmuller et al. (2014).
Results
To test hypotheses one, I first aggregated candidate religion into two categories, religious (Christian, Catholic, and Evangelical) and nonreligious (Atheist, Agnostic, or None). Conjoint category aggregation is done for clarity and simplicity; however, all substantive results hold if the categories are left unaggregated. Second, I subsetted respondents to those who identified as religious.
6
Religious identification was measured with a standard religious identification question, show in Figure 2. Results were then calculated as the effects of profile or candidate religion on the likelihood of selection using the Average Marginal Component Effects (AMCE). If hypothesis one is correct, we should see a statistically significant and positive coefficient for religious versus nonreligious candidates. Religious identification question. Note. 1–9 were coded as religious respondents for analysis and 10–12 as nonreligious. All results hold if individual religious groups are excluded and if all non-Christian groups are excluded. Separate analysis of non-Christians religious respondents was precluded by insufficient data in the context of a conjoint. A separate analysis using religiosity is presented in the appendix and shows similar results.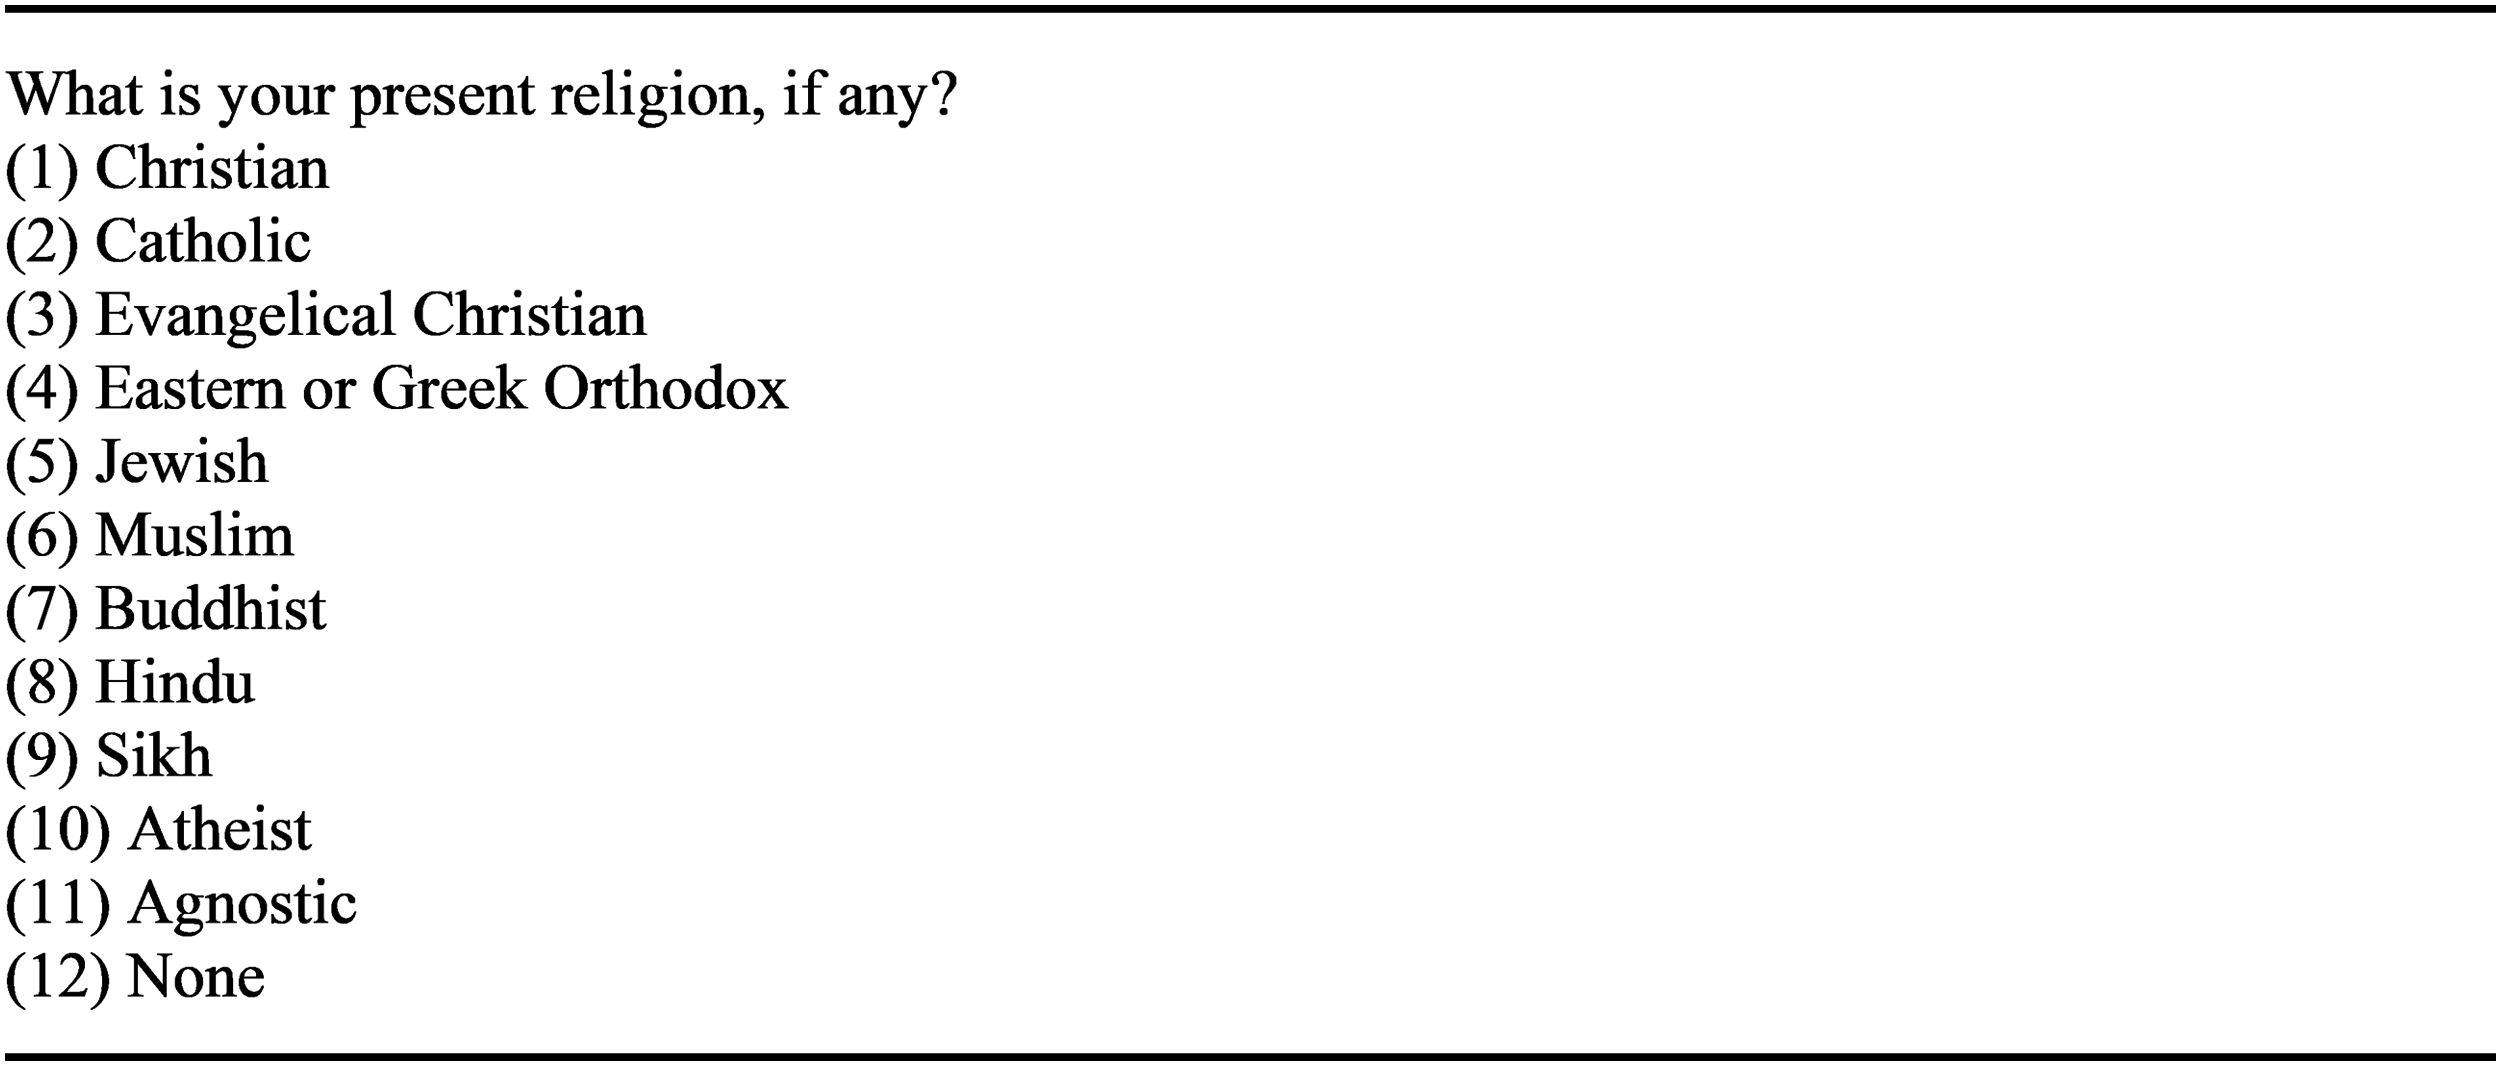
Analysis 1 confirms hypothesis one and shows that religious respondents are less likely to support nonreligious candidates. Figure 3 shows the average marginal component effects (converted to a percentage) for religious versus nonreligious candidate selection among religious respondents. Relative to a religious candidate, nonreligious office seekers were 3% less likely to be selected by religious respondents.
7
Based on these results it is clear that religious voters negative views of the nonreligious do indeed manifest in vote choices and provide a significant disadvantage for nonreligious candidates seeking office. Nonreligious office seekers can expect to suffer a significant electoral penalty by religious voters. Does this effect apply to all nonreligious office seekers, whether they are atheists, agnostics, or simply have no religious identification? Religious respondents with binary conjoint religious categories. Note. N = 1964. Reported effects can only be interpreted versus the baseline value, not against each other.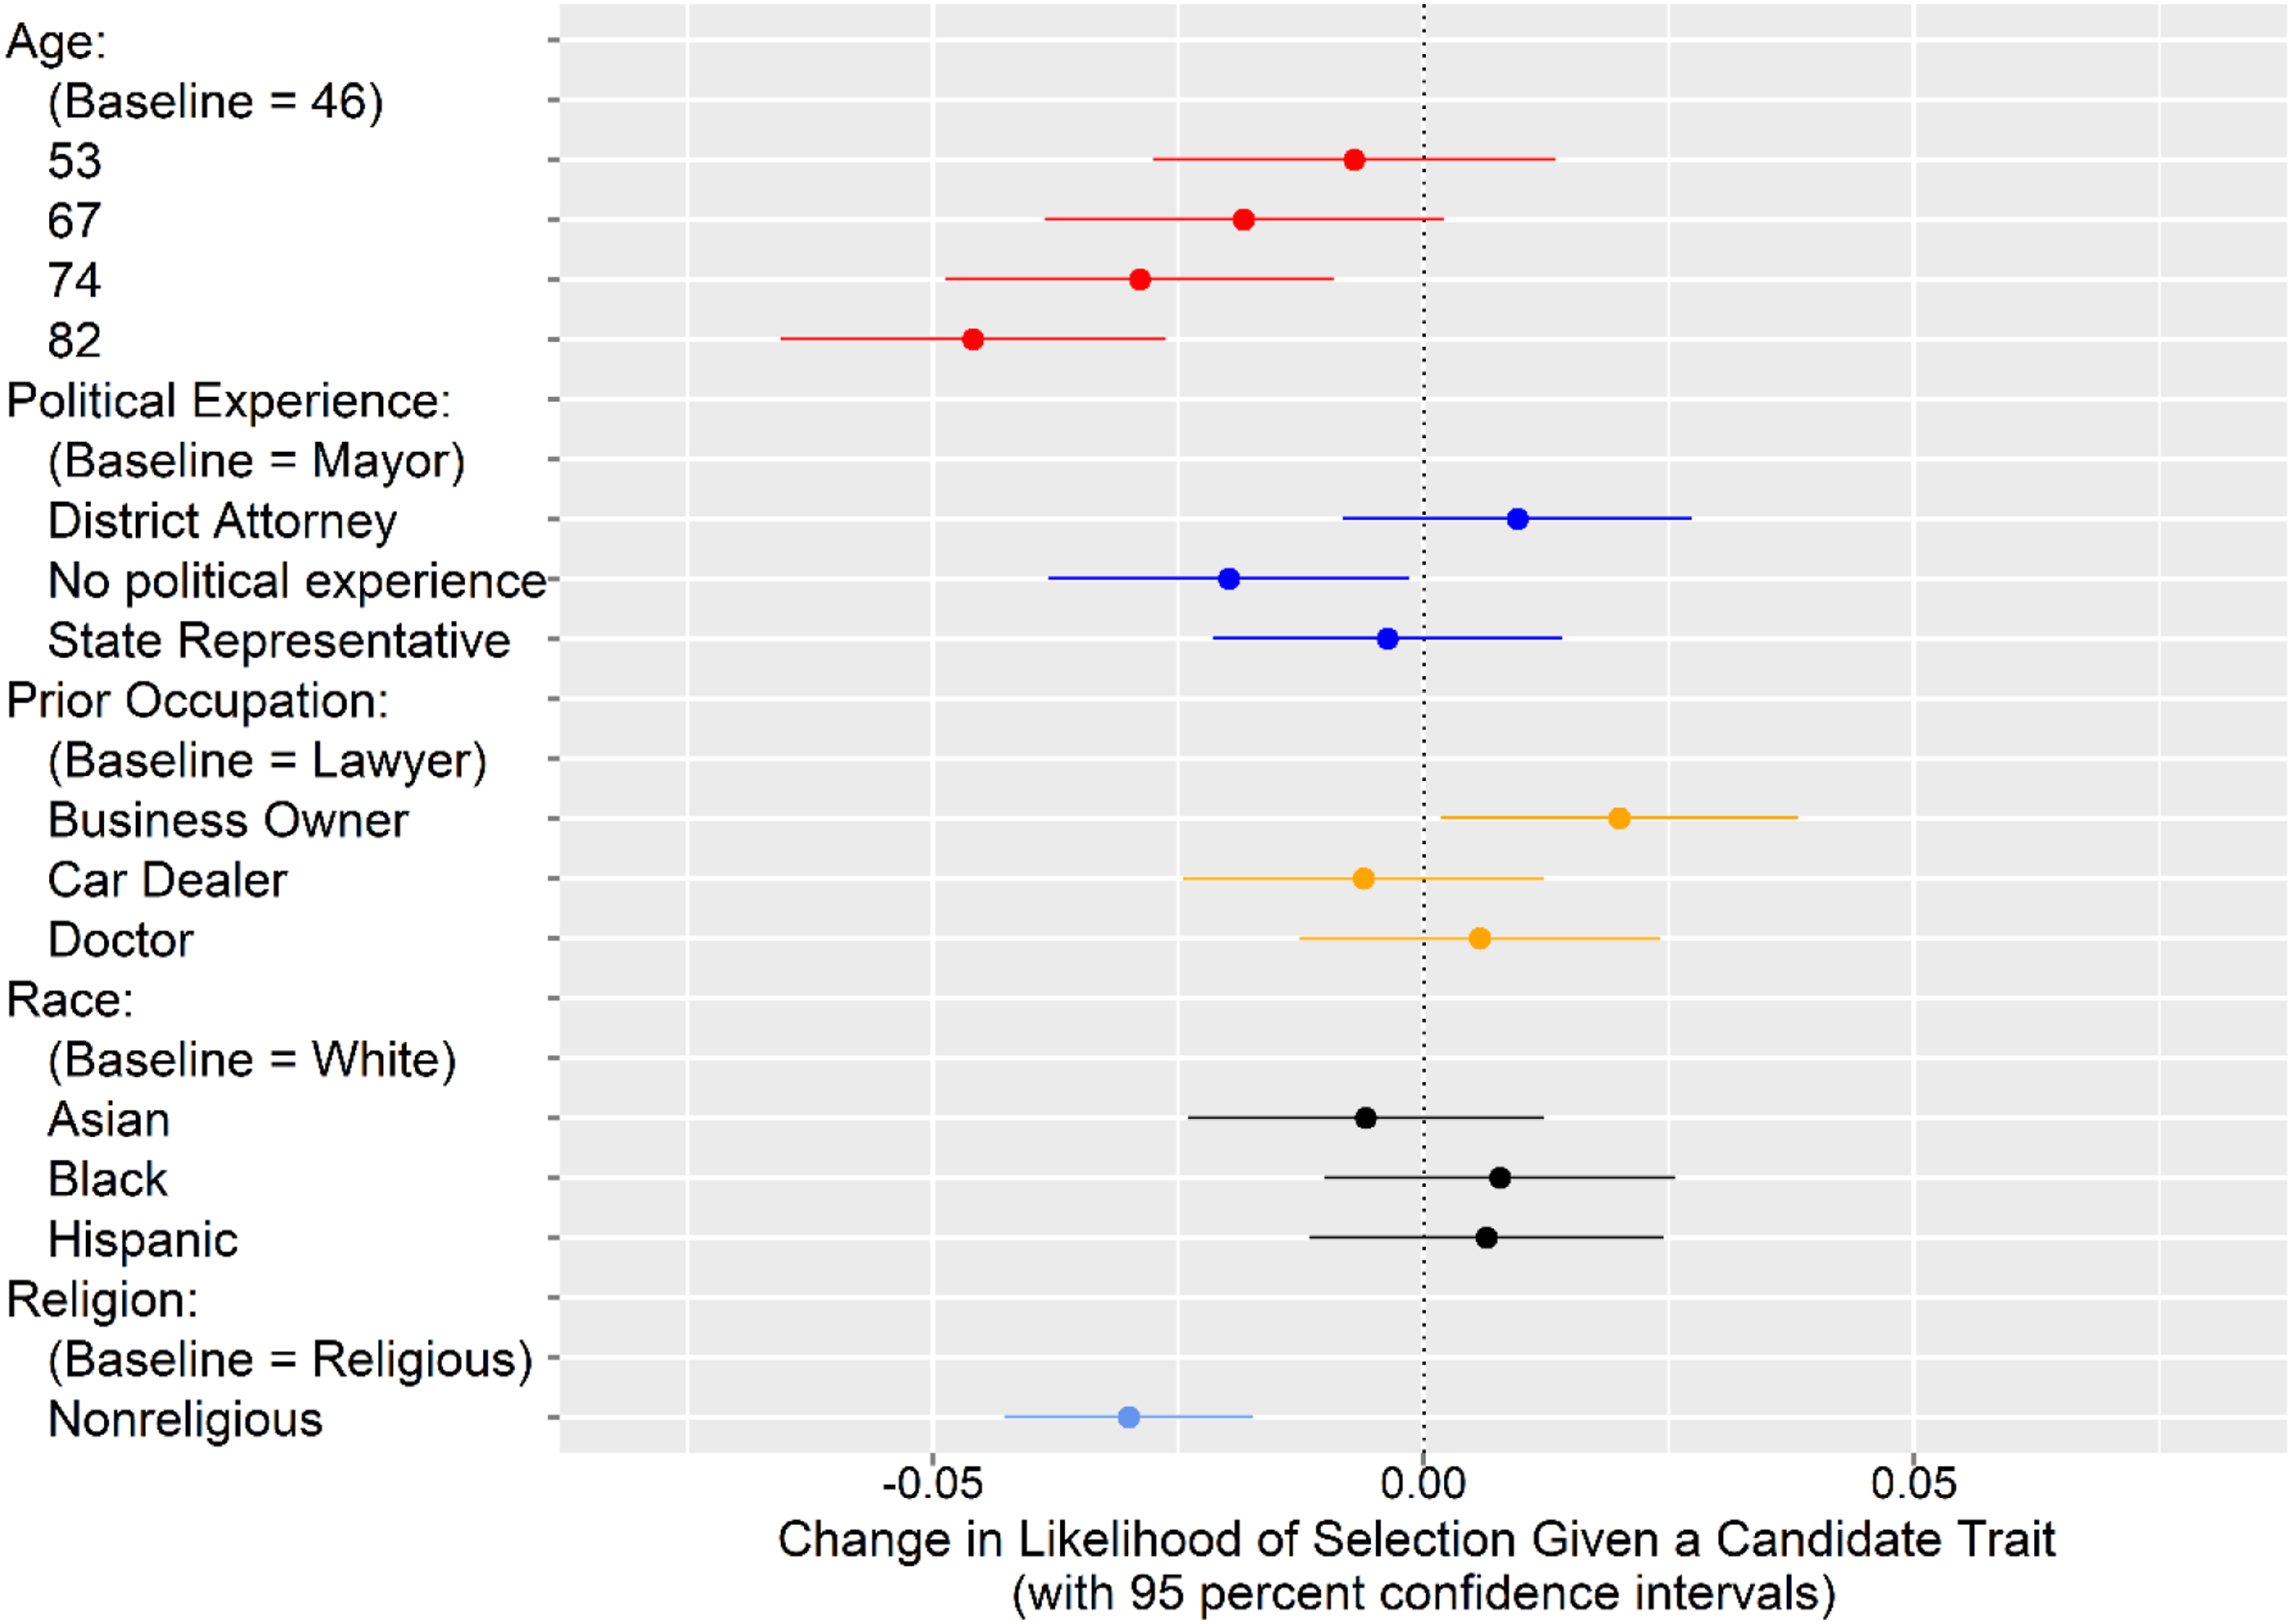
To test hypotheses two, I first aggregated religious candidates into a combined category, “Religious” (Christian, Catholic, and Evangelical). Atheist, Agnostic, and None were left unaggregated. As before, category aggregation among religious identities is done for clarity and simplicity; all substantive results hold if the category is left unaggregated. As with analysis 1 I subsetted respondents to those with a religious identity based on their religious identifications. Results were calculated as the effects of profile or candidate religion on the likelihood of selection using the Average Marginal Component Effects (AMCE). If hypothesis two is correct, we should see a statistically significant and positive coefficient for religious versus atheist, agnostic, and none candidates.
Analysis 2 confirms hypothesis two and shows that religious respondents are less likely to support nonreligious candidates regardless of whether they identify as atheist, agnostic, or simply have no religious identification. Figure 4 shows the average marginal component effects (converted to a percentage) for candidates with religious versus atheist, agnostic, and no religious identification among religious respondents. Relative to a religious candidate, office seekers who identify as atheist, agnostic, or have no religious identification were respectively 4.1, 2.3 and 2.6% less likely to be selected by religious respondents. Based on these results, it is clear that religious voters’ negative views of the nonreligious do not depend on nonreligious candidates identifying explicitly as atheists. Furthermore, the estimates are not statistically distinct when estimated separately against each other, so it is likely that religious voters do not make distinctions between the different nonreligious subgroups.
8
This finding validates the common use of atheists as a stand in for the larger group. The results presented here further suggest that findings of bias against atheists likely generalize to the larger nonreligious group. Candidates face an electoral penalty from nonreligious voters regardless of which nonreligious identity they hold. Examined next, is whether nonreligious candidates garner increased support from nonreligious voters. Religious respondents with conjoint religious categories combined. Note. N = 1964. Reported effects can only be interpreted vs the baseline value, not against each other.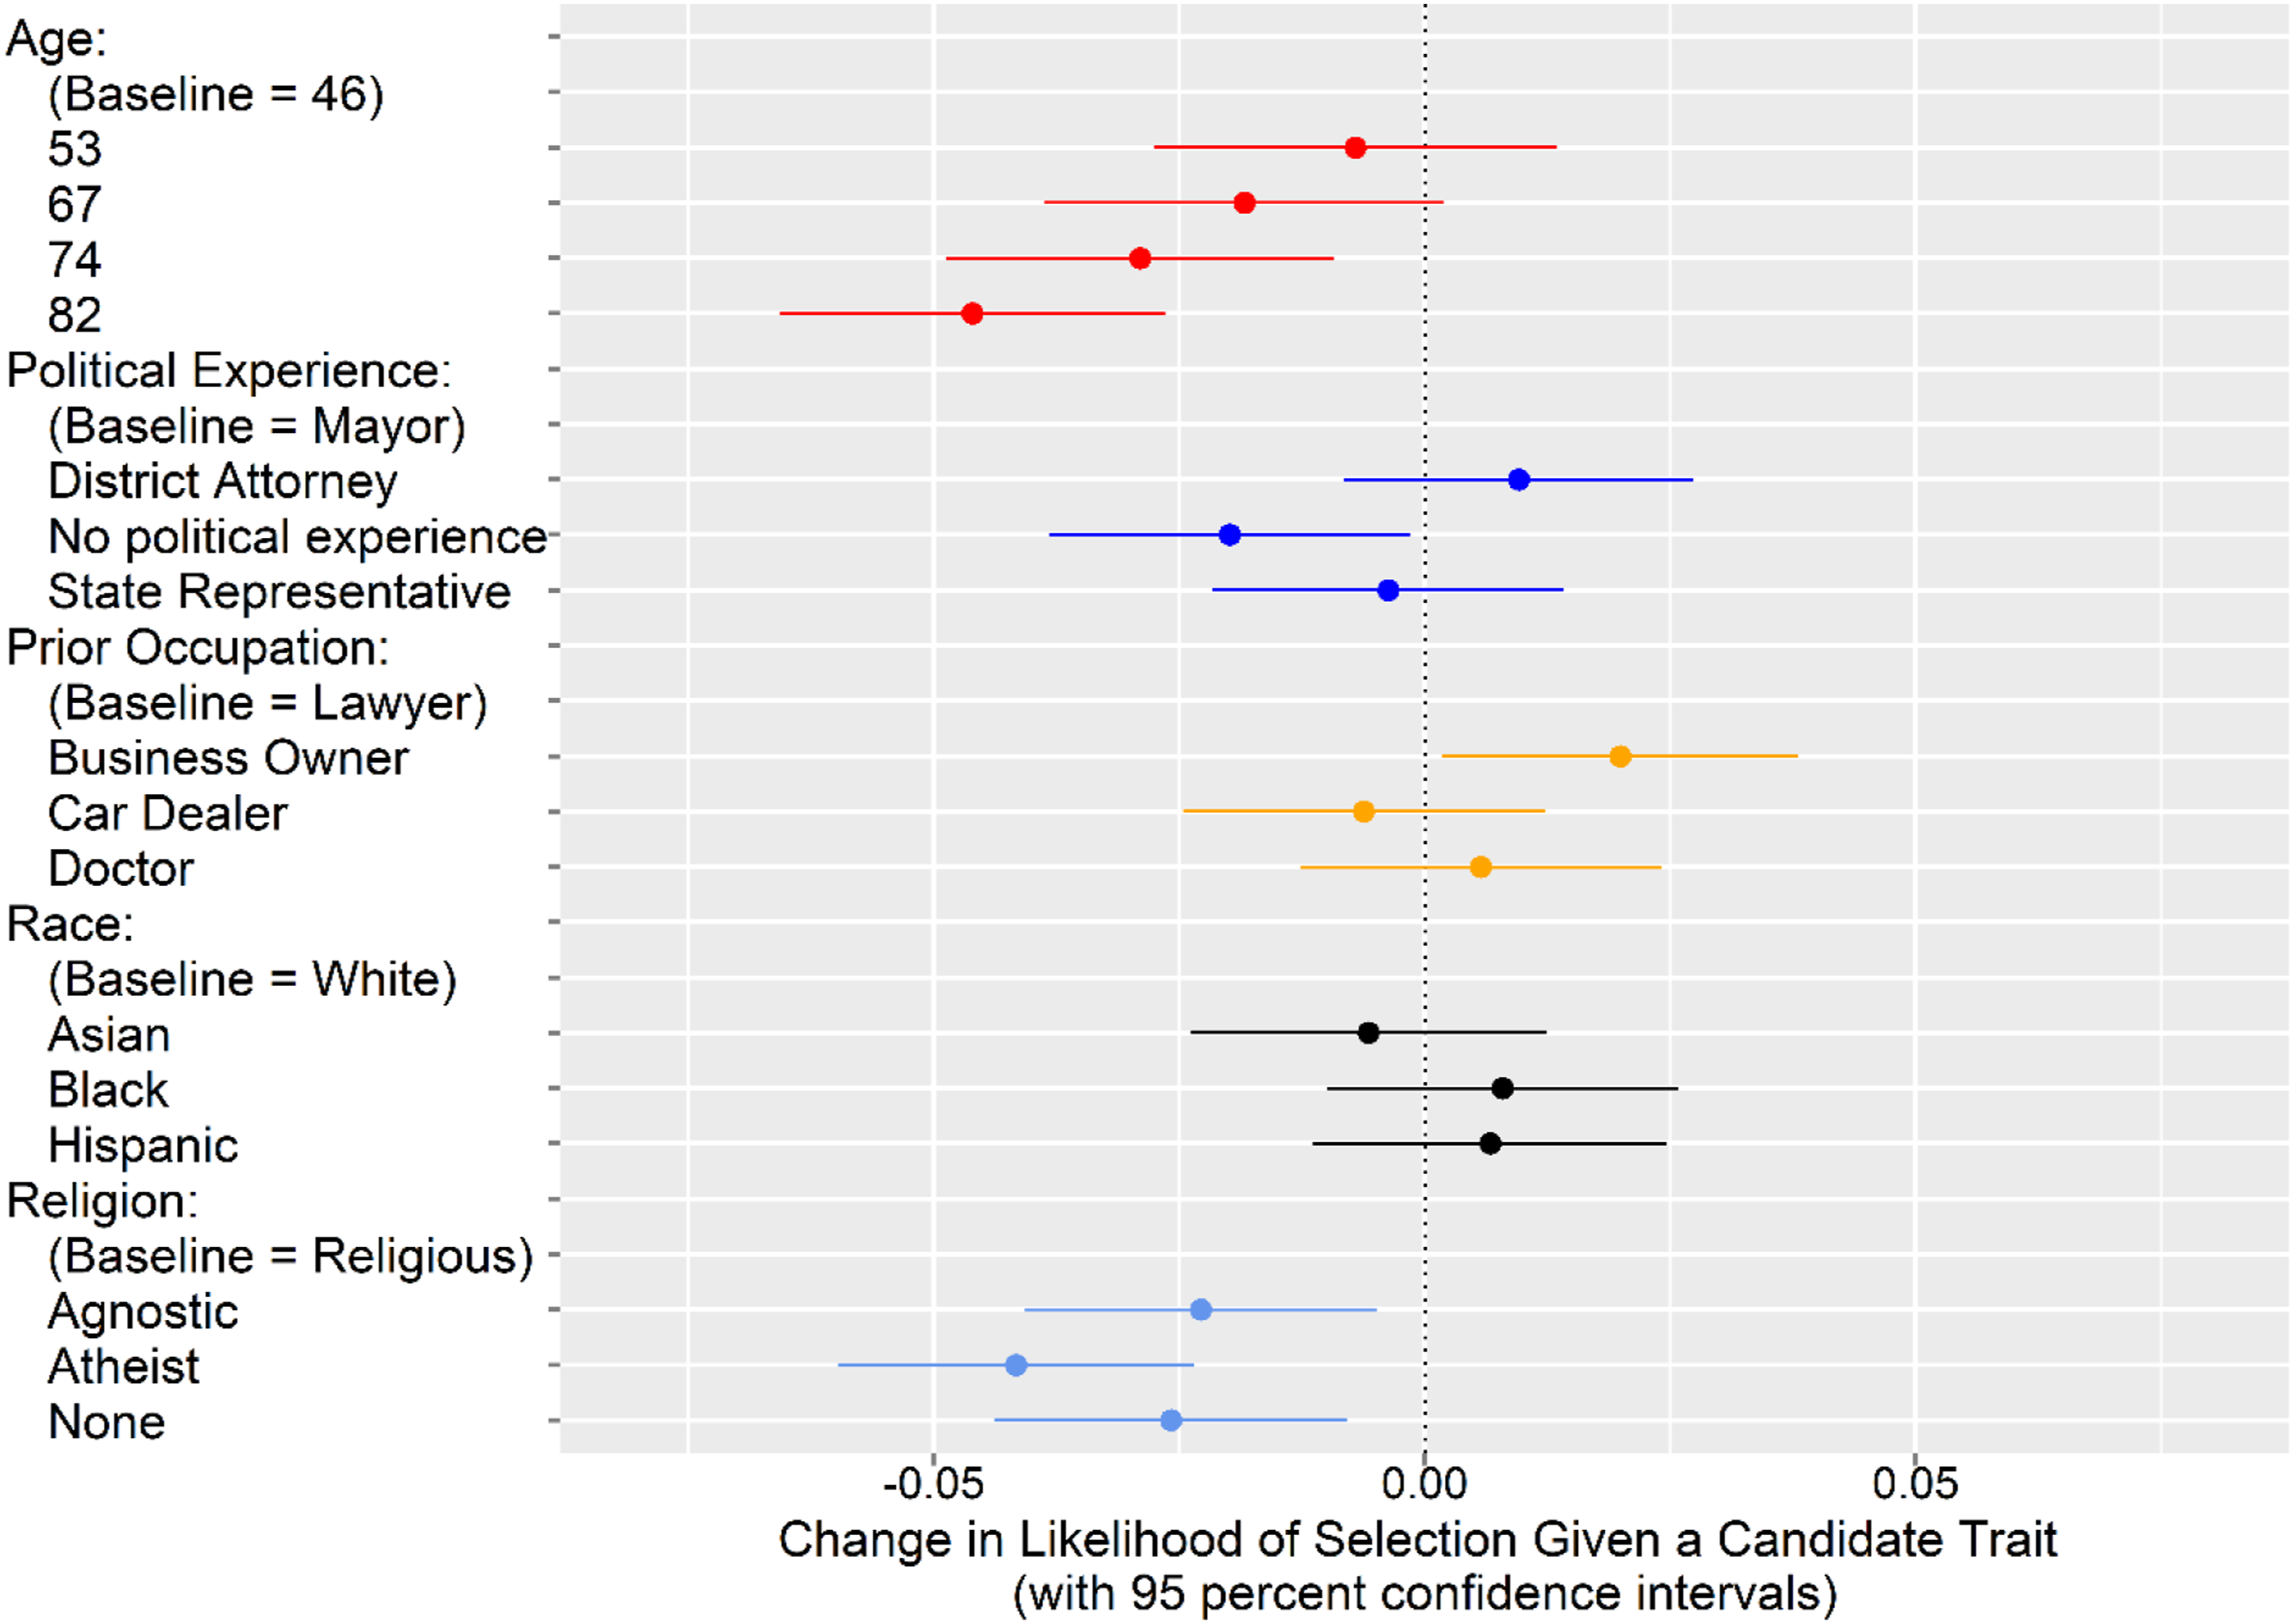
To test hypothesis three, I aggregated candidate religion into two categories, religious (Christian, Catholic, and Evangelical) and nonreligious (Atheist, Agnostic, or None). As with analysis 1 and 2, category aggregation is done for clarity and simplicity; however, all substantive results hold if the categories are left unaggregated. Second, I subsetted respondents to those who identified as nonreligious. Results were then calculated as the effects of profile or candidate religion on the likelihood of selection using the Average Marginal Component Effects (AMCE). If hypothesis three is correct, we should not see a statistically significant coefficient for religious versus nonreligious candidates.
Analysis 3 confirms hypothesis three and shows that nonreligious respondents are not systematically more likely to support nonreligious candidates. Figure 5 shows the average marginal component effects (converted to a percentage) for religious versus nonreligious candidate selection among nonreligious respondents. Although the point estimate shows that nonreligious respondents are 1% more likely to selecting nonreligious candidates, the estimate is not statistically significant using a 95% confidence interval. Therefore, I conclude that relative to a religious candidate, nonreligious office seekers were not systematically more likely to be selected by nonreligious respondents. Based on these results, it is clear that nonreligious voters do not exhibit a systematic ingroup preference for nonreligious candidates. These finding suggest that nonreligious voters do not generally support descriptive representatives. Nonreligious candidates are unlikely to make up for the penalty of religious voters with increased support from the nonreligious. However, this may not be the case for all nonreligious candidates. Nonreligious respondents with binary conjoint religious categories. Note. N = 800. Reported effects can only be interpreted versus the baseline value, not against each other.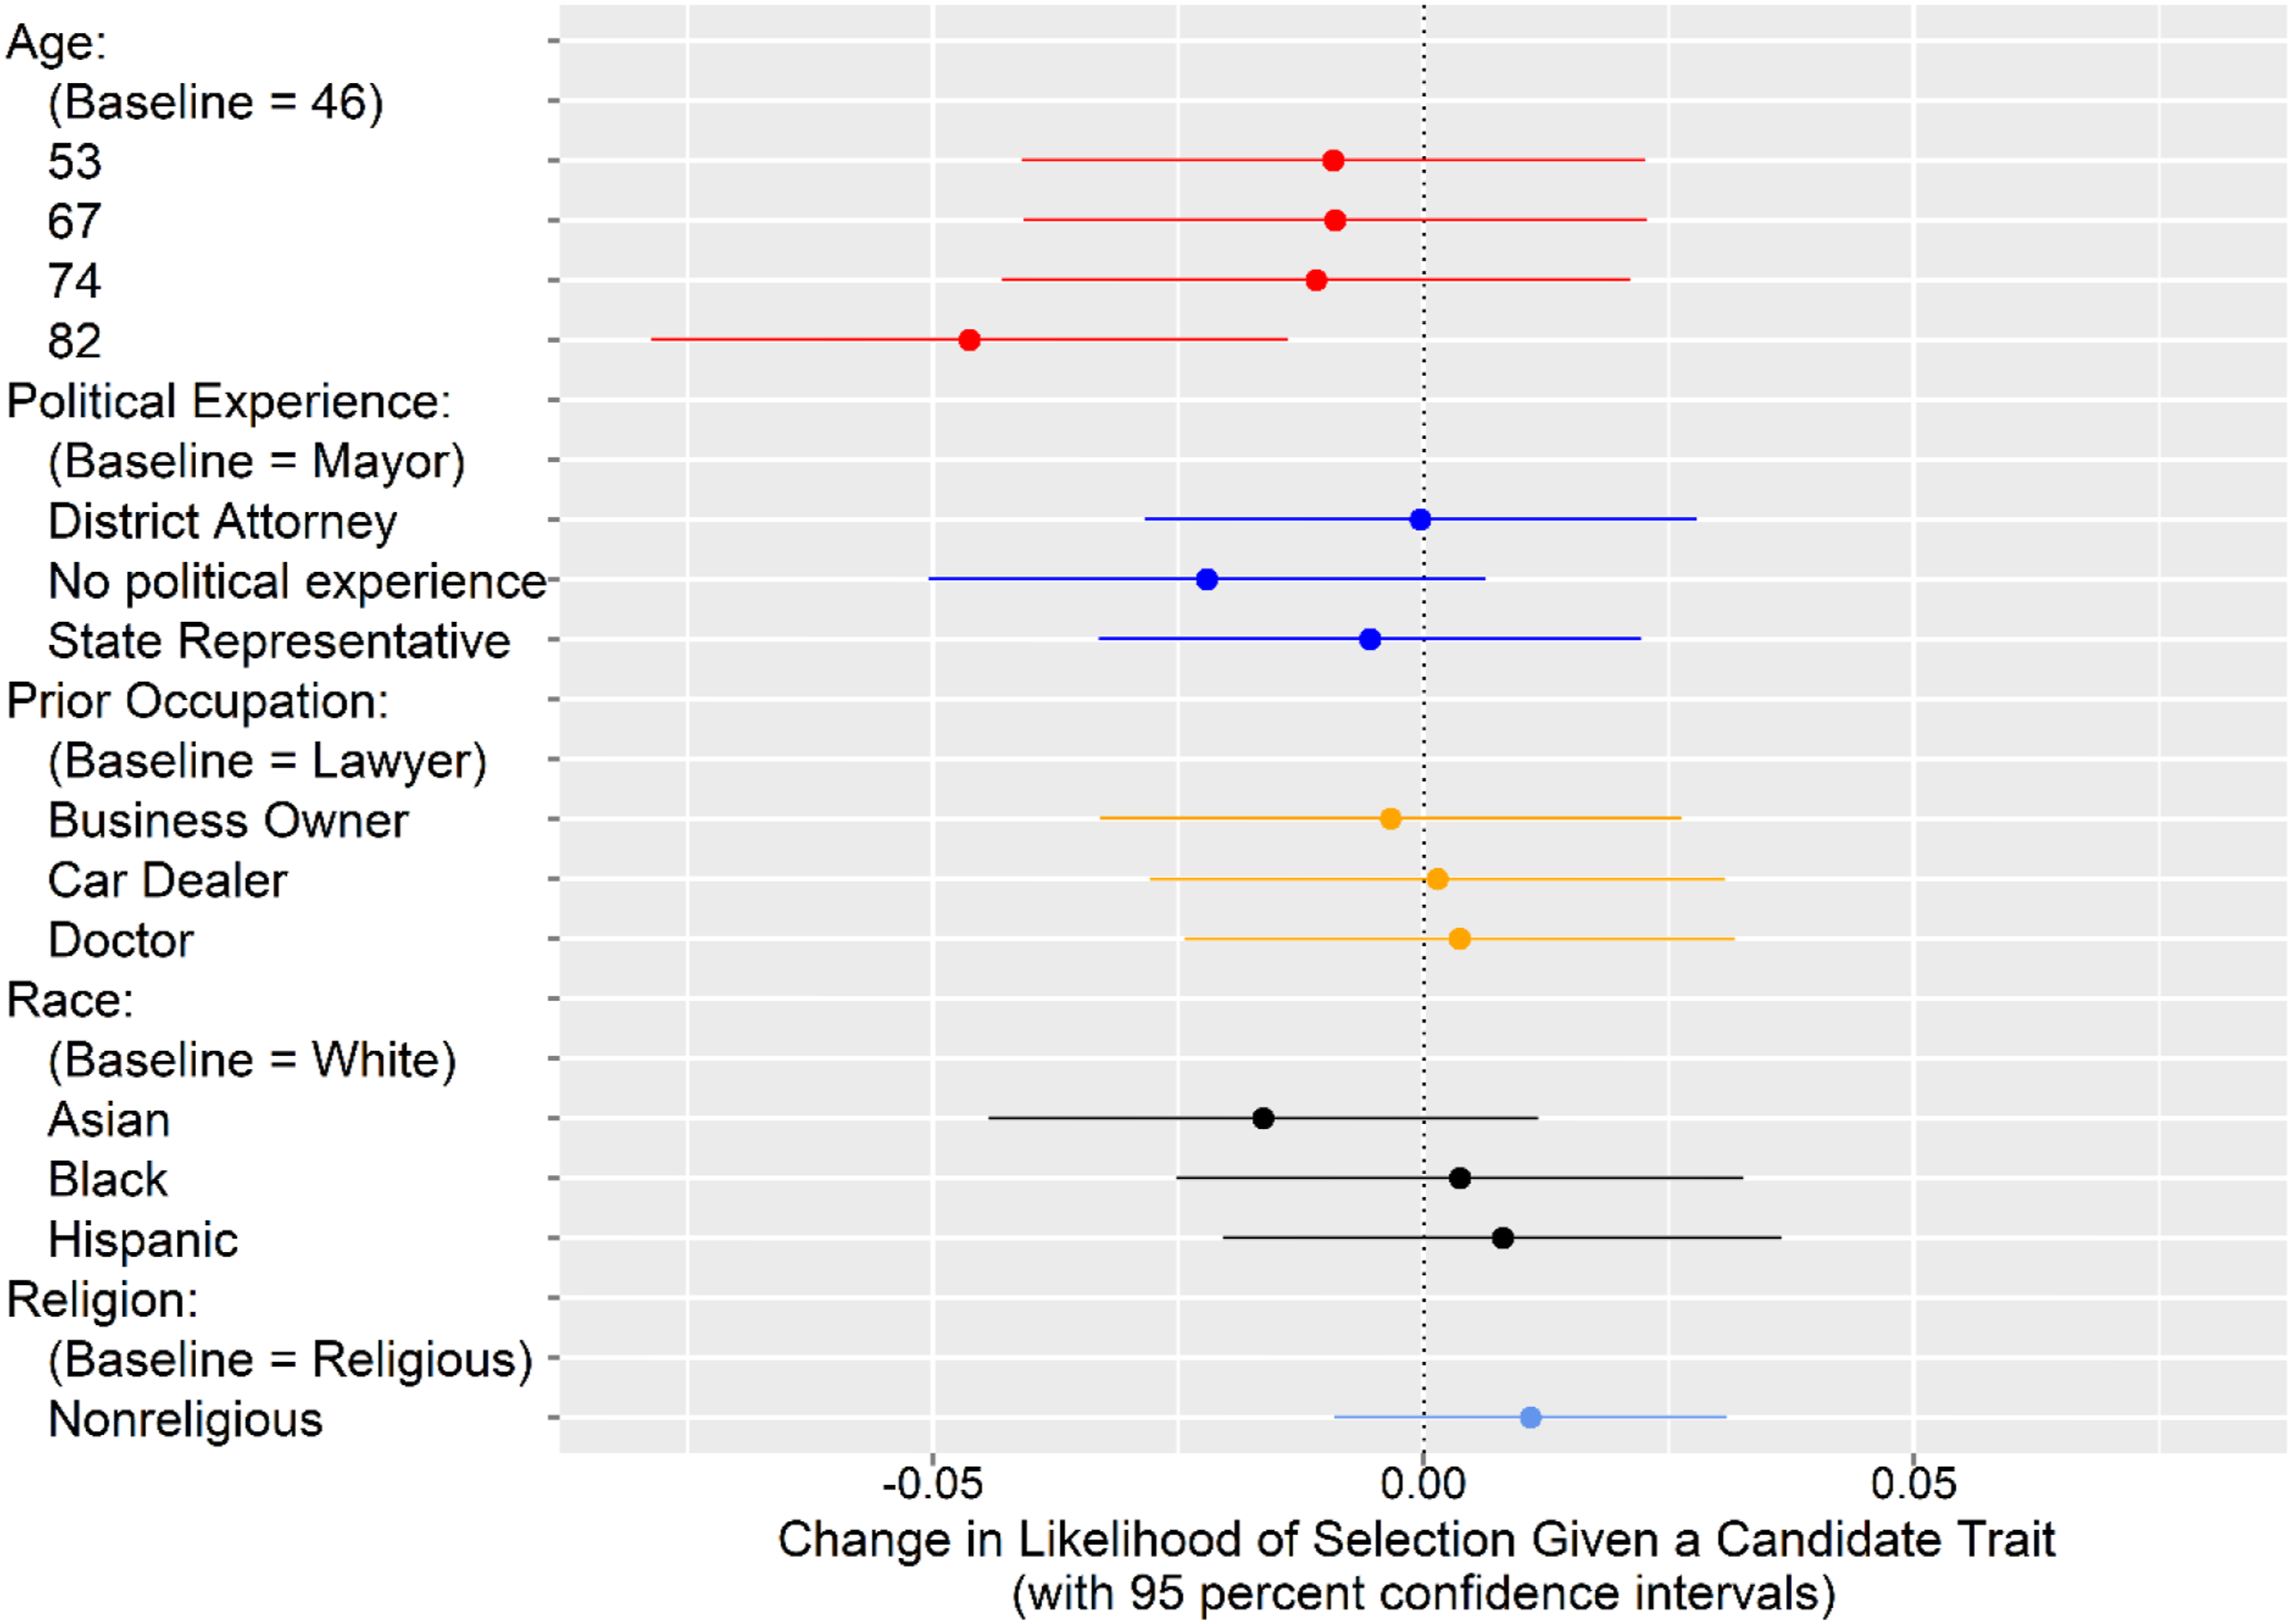
To test hypotheses four, I aggregated religious candidates into a combined category, “Religious” (Christian, Catholic, and Evangelical). Atheist, Agnostic, and None were left unaggregated. As before, category aggregation among religious identities is done for clarity and simplicity; all substantive results hold if the category is left unaggregated. As with analysis 3, I subsetted respondents to those with a nonreligious identity based on their religious identifications. Results were calculated as the effects of profile or candidate religion on the likelihood of selection using the Average Marginal Component Effects (AMCE). If hypothesis four is correct, we should not see a statistically significant coefficient for religious versus atheist, agnostic, and none candidates.
Analysis 4 disconfirms hypothesis four and shows that nonreligious respondents are not systematically more likely to support nonreligious candidates unless that candidate identifies as an atheist. Contrary to my expectations, nonreligious respondents were more likely to prefer one of the nonreligious subgroups. Figure 6 shows the average marginal component effects (converted to a percentage) for candidates with religious versus atheist, agnostic, and no religious identification among nonreligious respondents. No systematic difference in the likelihood of selection is found for candidates identified as agnostic or none. However nonreligious respondents were 3.2% more likely to select atheist candidates. Therefore, I conclude that while nonreligious voters do not exhibit an ingroup preference for nonreligious candidates in general, they do for atheist candidates. The nonreligious are more likely to prefer atheist candidates and do have a preference for descriptive representation when candidates identify as atheists. This finding is contrary to my expectations based on the literature. The implications of this finding are outlined in the discussion section. Nonreligious respondents with conjoint religious categories combined. Note. N = 800. Reported effects can only be interpreted vs the baseline value, not against each other.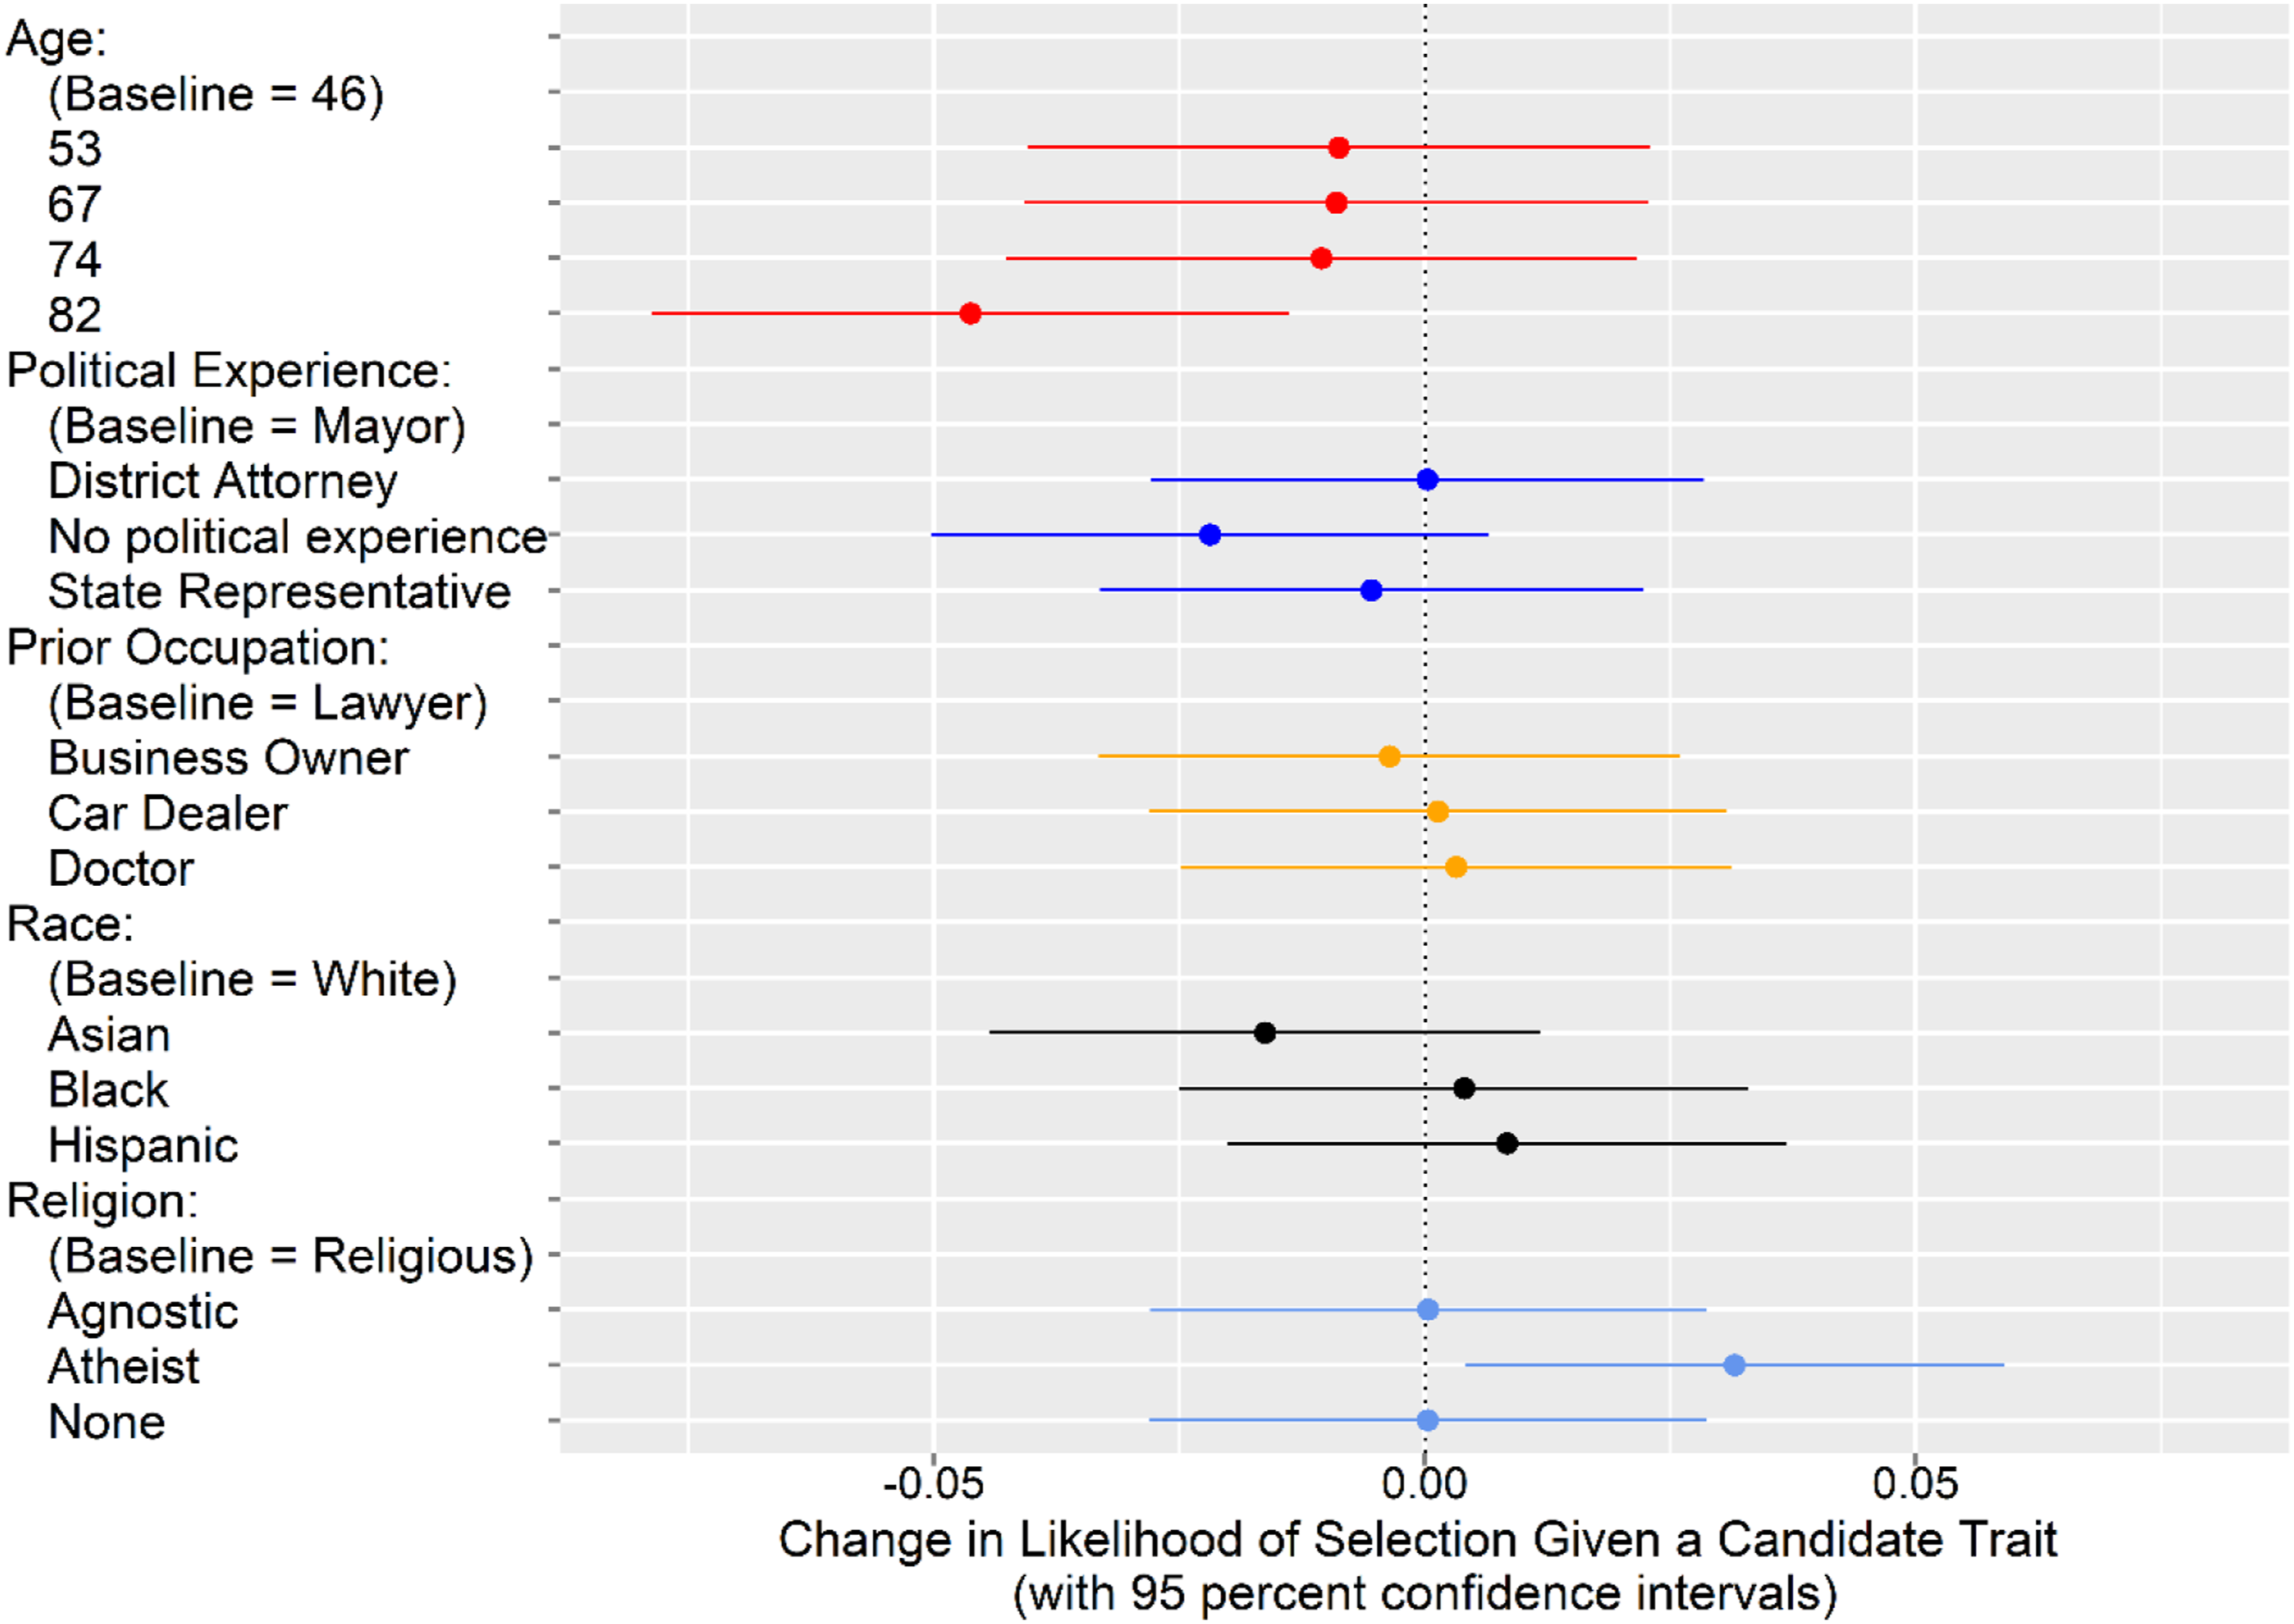
Discussion
As the portion of Americans identifying as nonreligious continues to rise, this groups’ lack of representation will create an increasing gap between the public’s religious views and those of our “ideally” representative government. Furthermore, the exclusion of the nonreligious from government should concern anyone interested in the separation of church and state, or secular government more broadly. It is unlikely that secular government can be maintained if religious identification is a requirement for those seeking power. Particularly in a country that is on track to be majority nonreligious in the coming decades. Understanding why nonreligious persons are excluded from Congress is a crucial first step toward achieving representation. Establishing an understanding of the mechanisms inhibiting representation can aid candidates trying to achieve gains in descriptive representation.
Previous work has established that the public holds negative views of the nonreligious (Saad, 2020) and nonreligious candidates in particular (Madrid et al., 2022). Utilizing conjoint experiments this paper shows that religious voters’ biases against nonreligious candidates are likely the primary reason why a quarter of the US population lacks descriptive representation. This contribution builds on previous work by demonstrating the causal link between the perception voters have about nonreligious candidates (Madrid et al., 2022) and vote choices resulting from those perceptions. Additionally, I show that the religious do not make distinctions between different nonreligious identifications whereas the nonreligious prefer candidates who identify as atheists. These results have direct and straightforward implications for candidates running for office. Unless a candidate is in a district with a substantial nonreligious population, they should conceal their nonreligious identity. In districts with large numbers of nonreligious voters, candidates without religious convictions should explicitly identify as atheists. Open identification is likely to result in an electoral penalty from religious voters. However, because religious voters appear to make no distinctions between nonreligious identifications there is likely to be no additional penalty in identifying as an atheist. Furthermore, losses among the religious could be made up with nonreligious voters but only via open identification as an atheist.
Given the results of this study, it is likely that all nonreligious subgroups are similarly perceived by religious voters. However, existing work largely uses atheists as a stand in for the nonreligious, generally, making it impossible to know if nonreligious groups are treated differently in other contexts. Further work should examine how or whether perceptions of atheists differ from those of agnostics or nones. Additional work is also needed to understand why the nonreligious prefer atheist candidates but not other nonreligious groups. It is possible that atheists are perceived as more valid descriptive representatives. Identification with the most ardent nonreligious group may signal characteristics desirable in a descriptive representative, such as strong mutual ties (Dovi, 2002), capacity to serve as role models (Wolbrecht & Campbell, 2007), or may signal that a lack of religious belief is a more central part of a candidates identity. Determining why nonreligious voters support atheist candidates is the next logical step in remedying the group’s underrepresentation.
An additional extension of this paper could be to compare liberal “tolerant” districts to highly religious districts in order to compare levels of bias directed at candidate across environments. It is likely that highly religious regions of the US have higher bias whereas voters in places like Oakland California (formerly the district of the only ever openly atheist congressperson) are less bias because a large percentage of residents are nonreligious. Examining bias regionally by gathering data on local samples would likely aid in explaining the distribution of state level nonreligious elected representatives as well as the barriers to national representation. This could be done through the use of a conjoint or pairwise design and the recruitment of samples from various regions in the United States. Further extensions could utilize a larger sample to determine if there are specific faith traditions that exhibit higher bias and whether education moderates bias.
This paper does not purport to test the nature of the biases that religious voters hold towards nonreligious candidates. A further interesting extension might utilize a larger sample and altered design to determine what aspects of the biases shown to be held against the nonreligious (Madrid et al., 2022) hold the most sway with religious voters. A further limitation of this paper is the inability to determine if underrepresentation is explained by nonreligious candidates concealing their identity. Although the results presented demonstrate that bias is driving reduced electoral support for nonreligious candidates, how candidates respond to bias is unexamined. Since, religious identity is confined to internal beliefs without any readily identifiable characteristics, there may be a large degree of concealment among nonreligious candidates and representatives. The identity is extremely easy to conceal, as it is entirely a matter of one’s internal beliefs. So, given that representatives, candidates, and party officials are likely aware of the bias against the nonreligious, we should expect a high degree of concealment. Examples of identity concealment among the nonreligious office holders include former congressman Barny Frank (D-MA), who after leaving office came out as nonreligious, former representative Pete Stark 9 (D-CA), who despite being elected in 1973 did not come out as nonreligious until 2007, and Jared Huffman (D-CA), who came out only after being in office and winning reelection to his second term. These three congressmen where able to easily conceal their religious identity for decades while in office and it is likely that other current and past office holders are as well. Strategic concealment of an unpopular identity provides another valid explanation for the lack of openly nonreligious representatives by shifting the question to why candidates and representatives continue concealment despite rising numbers of nonreligious identifiers.
However, this theory is likely unfalsifiable and largely untestable given our inability to gather accurate data on representatives’ religious belief. Consequently, this paper assumes truthful reporting of beliefs by candidates and focuses on examining bias and a lack of ingroup support as explanations for the lack of nonreligious representatives without arguing against the presence or importance of concealment. Indeed, the data and methods utilized could be applied to questions of strategic concealment as well by showing the empirical basis upon which such a strategic decision may be based. Furthermore, a more complete understanding of the bias against nonreligious candidates has the potential to be useful to office holders currently concealing their lack of religious convictions. Future work could examine experimentally examine the propensity of nonreligious persons to conceal their identity in the context of bias from the religious.
Supplemental Material
Supplemental Material - Non-Religious Identity Salience for Candidate Choice
Supplemental Material for Non-Religious Identity Salience for Candidate Choice by Spencer Kiesel in American Politics Research
Footnotes
Declaration of Conflicting Interests
The author(s) declared no potential conflicts of interest with respect to the research, authorship, and/or publication of this article.
Funding
The author(s) received no financial support for the research, authorship, and/or publication of this article.
Supplemental Material
Supplemental material for this article is available online.
Notes
References
Supplementary Material
Please find the following supplemental material available below.
For Open Access articles published under a Creative Commons License, all supplemental material carries the same license as the article it is associated with.
For non-Open Access articles published, all supplemental material carries a non-exclusive license, and permission requests for re-use of supplemental material or any part of supplemental material shall be sent directly to the copyright owner as specified in the copyright notice associated with the article.