
Abstract
A prominent literature argues that moderate candidates perform better in general elections, but a competing literature that emphasizes partisan loyalties contests this. The 2020 Democratic presidential primary represented an opportunity to speak to these debates due to high voter information about multiple moderate and extreme candidates running in the same election. We present results from two national surveys (total n = 102, 425) that asked how respondents would choose in an election between one of the Democratic candidates and Republican Donald Trump. Our evidence is consistent with moderates having an electoral advantage: more moderate Democratic candidates receive more support against Trump than do more extreme candidates. Providing information through plausible attacks did not change these results. Notably, Sanders had the highest support after the moderates, but this was due to an implausibly large increase in intended turnout among young voters. Inconsistent with theories emphasizing the strength of partisan loyalties, Republican voters explain much of this effect.
A prominent perspective in the American politics literature argues that more moderate candidates on average perform better than more extreme candidates in general elections (e.g., Ansolabehere et al., 2001; Canes-Wrone et al., 2002; Hall, 2015; Hall and Thompson, 2018; Hill, 2017). For example, Canes-Wrone et al. (2002, p. 133) find that Members of Congress who cast 3 to 4 additional high-profile votes aligned with the extreme of their party receive 1–3% points fewer votes in the next election. However, skepticism of whether electorates reward candidates with more moderate platforms remains. Much of this skepticism emphasizes the strength of voters’ loyalties to their own party and their stated disdain for the other, arguing partisanship overrides other considerations such as candidates’ policy positions (e.g., Achen and Bartels, 2016; Campbell et al., 1960; Lenz, 2012; Utych, 2020). In a recent review and critique, Fowler (2020) summarizes this literature as arguing that voters exhibit “partisan intoxication.”
In this paper, we speak to this debate on the relationship between ideological extremity and electoral performance with data collected during the 2020 Democratic presidential primary. We analyze two large survey datasets that asked how respondents would vote in a general election between incumbent Republican Donald Trump and one of the candidates for the Democratic nomination. We examine choices between Trump and five of the candidates who were the most plausible nominees during the most highly publicized part of the primary, the first few months of 2020. These five candidates included three generally perceived as more moderate both by respondents to our survey and by political observers more generally: Joe Biden, Michael Bloomberg, and Pete Buttigieg. There were also two candidates seen as more extreme by both respondents to our survey and political observers: Bernie Sanders and Elizabeth Warren. 1
We should not expect evidence from any one election to provide dispositive evidence regarding an enduring debate in political science on the role of ideology in general elections. However, data from the case we consider can inform this debate, as it complements prior empirical work on candidate ideology and vote choice in several ways. First, we are able to conduct comparisons across candidates while holding constant the electoral context. As Hall (2015) discusses, research on candidate ideology faces the challenge that extreme candidates may run in different kinds of elections than moderate candidates (e.g., in different districts or at different times), confounding comparisons between moderate and extreme candidates’ electoral performance. However, as few other studies are able (e.g., Hall, 2015; Hall and Thompson, 2018), this case allows us to hold constant the electoral context because all of the candidates we examine ran in the same election. Second, we are able to examine the case of presidential elections, whereas most existing work on candidate ideology and electoral performance focuses on legislative elections, such as for US House. Due to the small number of presidential elections in US history, candidate ideology in presidential elections has received relatively less attention in prior empirical research (e.g., Cohen et al., 2016). Third, the 2020 Democratic presidential primary featured a relatively large number of candidates whom voters widely understood to be more extreme or more moderate. That is, (a) there was meaningful variation in candidate ideology among candidates for the 2020 Democratic presidential nomination; (b) as we show below, voters appeared to perceive this variation; and, (c) helping reduce concern that our conclusions may be idiosyncratic to a particular candidate, there were multiple more moderate and multiple more extreme candidates that were diverse along many other dimensions that could plausibly be relevant to voters (e.g., age, gender, region, sexual orientation, prior experience). Fourth, the large sample of individual-level survey data we analyze allows us to determine which types of individuals are responsible for the aggregate differences we observe (i.e., to examine treatment effect heterogeneity by individual voter attributes) more precisely than smaller survey-based studies or in studies with only aggregate outcomes. Lastly, unlike much other survey-based research, we are able to examine how voters say they would choose between real candidates in a real election, not hypothetical candidates in a hypothetical election (McDonald, 2020).
All research on candidate ideology and electoral success has weaknesses, and there are several weaknesses of our research design that should be kept in mind. First, our results come from one set of candidates in one election. Although rigorous studies of variation within a particular case can be informative (Fowler, 2013; Lo, 2013), conclusions from the 2020 election may not generalize to other elections (Utych, 2020). Second, as survey responses are ill-suited to measuring turnout decisions (Rogers and Aida, 2014), our data is not well-suited to capturing any effects on turnout from nominating extreme candidates, such as extreme candidates inspiring turnout among outpartisans (Hall and Thompson, 2018; Hill, 2017). We therefore consider how different assumptions about turnout could alter our conclusions. Third, survey responses capture stated preferences that may not correspond with real behavior, such as if respondents answer expressively or strategically (Bullock et al., 2015). For example, as we document below, a meaningful percentage of Sanders supporters report they would abstain from the general election if a more moderate candidate were the Democratic nominee. We cannot be certain the extent to which this is genuine, strategic, or expressive responding, and so we examine the robustness of our conclusions to different approaches to forecasting the likely electorate. Fourth, our survey took place before a Democratic nominee was selected and well before the general election took place. As a result, the media, voters, opposing campaigns, etc. had not yet reacted as they might were each candidate actually nominated, such as by better informing the electorate about the Democratic nominee’s flaws. That is, our results are more appropriately thought of as capturing voters’ partial equilibrium response to candidate ideology among voters who were aware of these differences early on in the election cycle, a question relevant to but distinct from how entire electorates respond to candidate ideology in general equilibrium when the general election takes place. However, to help assess the danger this poses to our conclusions, we examine the robustness of our conclusions by providing some of our respondents with additional information (negative attacks) about the candidates. We find that even among this better-informed sample, moderate candidates outperform more extreme candidates. Finally, our results come from observational analyses. Insofar as we are studying real candidates in a real election, we cannot randomly assign their ideology and candidates may differ in many other ways that could matter for electability. However, by focusing on two candidates in particular — Joe Biden and Bernie Sanders — who share many characteristics (e.g., name recognition, gender, race, age) but differ in ideology, we attempt to at least partially address this limitation.
With these caveats in mind, our findings nevertheless provide further evidence consistent with the prediction that moderate candidates enjoy electoral advantages. Examining respondents’ choices, respondents are significantly more likely to vote for Donald Trump instead of the Democratic candidate in a general election matchup with an extreme Democratic candidate than with a moderate Democrat. Contrary to the expectations of some scholars that partisans are too loyal to their parties to reward moderation from the other party’s candidates (e.g., Achen and Bartels, 2016), we find that Republican partisans significantly contribute to moderate Democratic candidates’ superior performance against Trump: ≈2% of Republicans in our survey answer as if they would vote for Trump if a more extreme Democrat were nominated but would vote for the Democratic candidate were a more moderate Democrat nominated. While Hall and Thompson (2018) find that extremist nominees fare worse in congressional general elections through a mobilization mechanism, these results suggest that in presidential elections, a persuasion or vote-switching mechanism may also operate (Hill et al., 2021).
Data and Methods
Samples Used in Analysis.
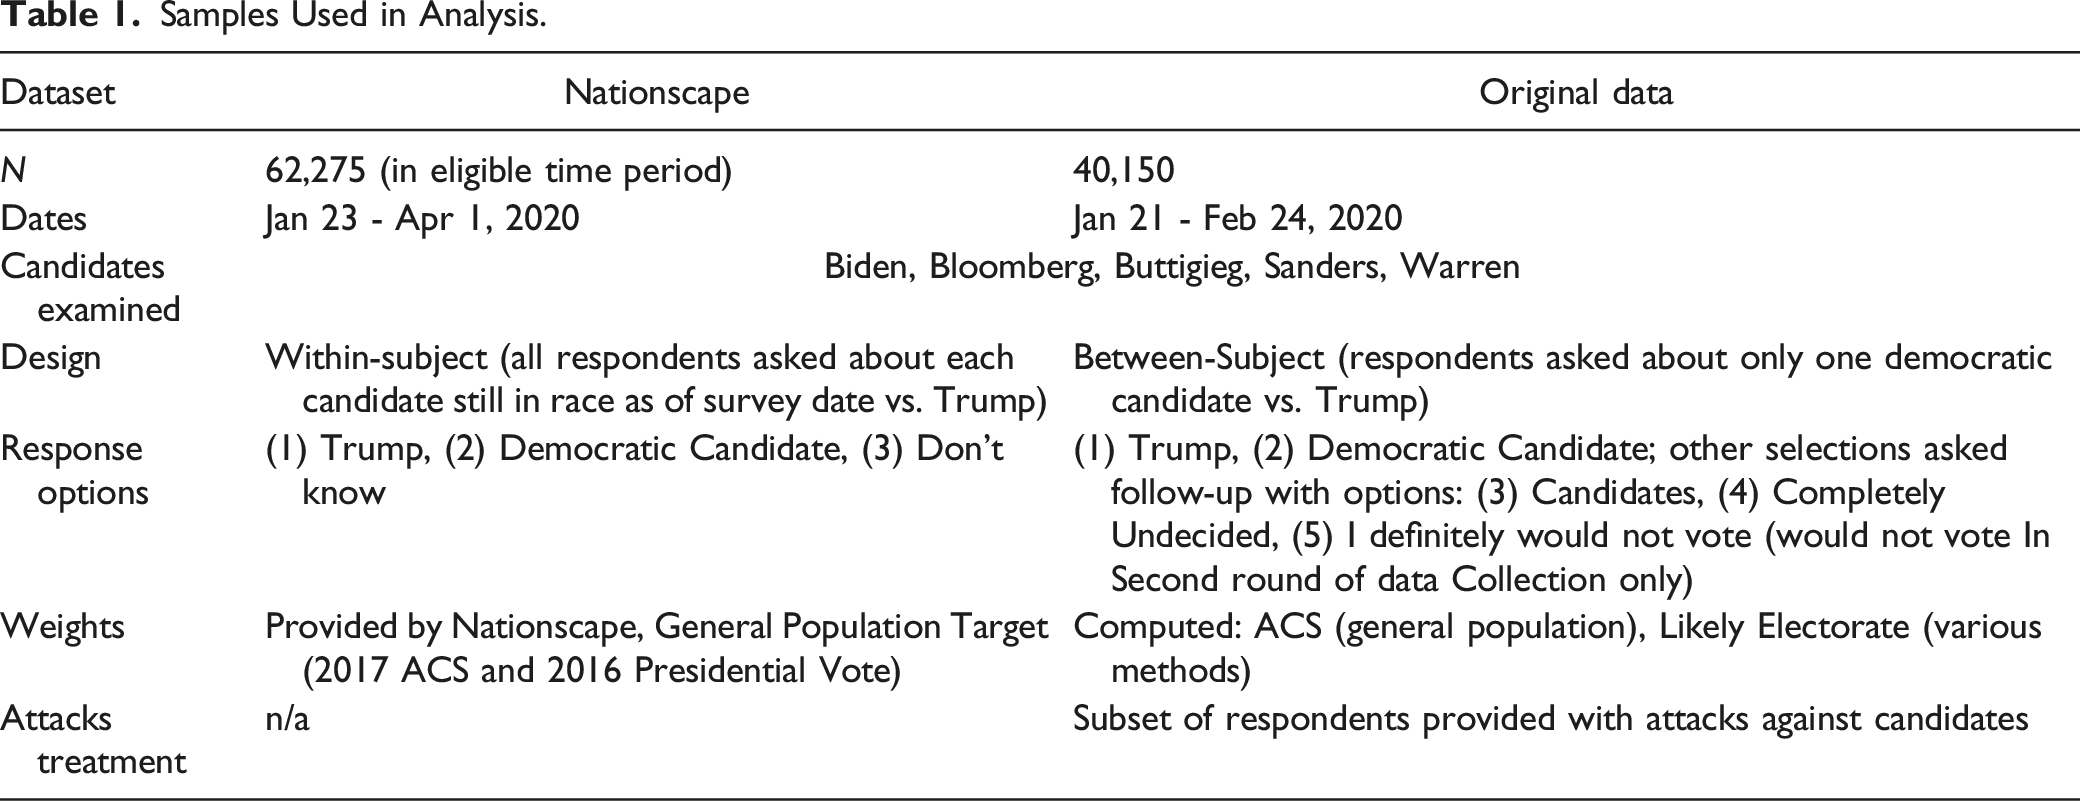
Nationscape Survey
The first survey dataset we analyze is from the publicly available Nationscape project, a large survey sample collected by UCLA and the Democracy Fund (Tausanovtich et al., 2019). Beginning in July 2019, the Nationscape project interviewed thousands of respondents every week using the survey platform Lucid. The project makes available detailed information regarding the representativeness of its samples. 2
The Nationscape surveys contained a large number of questions about a variety of political topics (for further details, see Tausanovtich et al., 2019). Among them, many waves of the Nationscape survey contained questions like the following:
If the general election for president of the United States was a contest between [DEMOCRATIC CANDIDATE] and Donald Trump, who would you support? • [DEMOCRATIC CANDIDATE] • Donald Trump • Don’t Know
There were no follow-up questions for respondents who said they did not know how they would vote.
Each respondent was asked about several Democratic candidates. E.g., the same respondents were asked how they would vote between Joe Biden and Donald Trump and between Bernie Sanders and Donald Trump. The order of the candidates were randomized for each respondent.
We use data starting in Nationscape’s 28th survey wave, which began on January 23, 2020, the week before the Iowa caucus. We selected this cutoff date because it coincides with the beginning of our second survey sample, making the two more comparable, and because it means the data covers the period of the campaign when there was the most media coverage of the candidates. We use the data until the survey’s 37th wave, which ended April 1, 2020, the week before Bernie Sanders dropped out of the race, when Biden became the presumptive nominee.
Nationscape only asked respondents how they would choose between Trump and Democratic candidates who had not yet dropped out as of the day of the survey, so all the responses describe candidates still in the race as of the survey date. 3
Our analyses use the survey weights provided in the Nationscape data. The Nationscape project computed these weights using the 2017 ACS as well as several other variables, such as 2016 presidential vote and the urban-rural mix of the respondent’s home zip code.
To match our original survey (described below) and to focus only on candidates with a plausible chance of winning the nomination as of the survey dates, we focus on how respondents chose between Trump and five of the candidates: Biden, Bloomberg, Buttigieg, Sanders, and Warren. These five candidates were the leading contenders for the Democratic nomination as of early 2020; as Supplementary Table A1 shows, they were far ahead of the remaining Democratic candidates in national polling during this period.
Original Surveys
We also analyze a dataset of original surveys we collected. As part of surveys for other projects, we collected 40,150 unique survey responses during January 21 – February 24, 2020. We collected the responses using the online platform Lucid, which is the same data vendor the Nationscape project used and which Coppock and McClellan (2019) validate as relatively nationally representative. 4
In these surveys, we asked respondents how they would choose in a contest between Donald Trump and one of the five Democratic candidates named above: Bernie Sanders, Elizabeth Warren, Joe Biden, Michael Bloomberg, and Pete Buttigieg. Note that, unlike in the Nationscape survey, in our original survey each respondent was only asked about how they would choose between Trump and one Democratic candidate. We intended for this to reduce strategic responding, as individual respondents did not have the opportunity to indicate that they would vote for the Democratic candidate only if their preferred candidate was nominated but not if another was.
Our surveys began by asking respondents for their informed consent and ensuring that they were paying attention. After dropping respondents who did not consent or who did not pass attention checks, 40,150 remained. 12,275 of these were not shown attacks (described below) and are used in our primary analyses, approximately 2500 observations per candidate.
Next, we asked a series of demographic and baseline political questions. Respondents then read a brief preamble about the upcoming election and we randomly assigned them to one of the five Democratic candidates. In this brief preamble, some respondents saw attacks on the Democratic candidates (described in further detail below). Finally, we asked respondents how they would vote in a contest between Republican Donald Trump and their randomly selected Democratic candidate. If respondents said they were unsure or preferred a third party, we asked them in a branching question if they leaned towards Trump, leaned towards the Democrat, or were completely undecided.
Supplementary Appendix B gives the full question wordings.
During the second half of the survey field period surveying (see Footnote 4), we added a “would not vote” option to our survey question measuring 2020 presidential vote choice. While survey responses are not a reliable predictor of actual turnout (Rogers and Aida, 2014), this option helps us interpret what respondents meant when they said they did not know how they would choose between the candidates (i.e., if they were genuinely undecided, if they planned to vote third party, or if they thought they would not vote).
Weighting
To assess the robustness of our results, we compute multiple sets of survey weights in our original survey data. Our first set of weights uses the general population as the target, computed using the US Census’ 2018 5-Year Estimates American Community Survey (ACS). We constructed weights using age, gender, household income, ethnicity/race, education among Whites, 5 and region. We also compute a second and third set of weights that weight to the demographics of the 2016 electorate, as computed from the 2016 Cooperative Election Study’s (CES) (Ansolabehere and Schaffner, 2017) validated voting information. We compute the second set of weights from the 2016 CES using age, gender, household income, ethnicity/race, and education among Whites and a third, more expanded set using 2016 presidential vote choice, race-by-education interactions, race-by-age interactions, gender, and household income. A fourth set of weights checks the robustness of our findings when using estimates of the demographic composition of the 2016 electorate from Catalist, a political data vendor that maintains a national voter file, instead of the CES. Here we weight on gender, age, ethnicity/race, and education among Whites. Motivated by concerns that Trump’s presidency may have altered turnout patterns, a final set of weights similarly checks for the robustness of our findings by weighting to the demographics of the 2008 and 2012 electorates computed using data from Catalist and the CES. All survey weights are constructed using data from both rounds of surveys with entropy balancing (Hainmueller, 2012).
Attacks Treatment
One limitation of our design is that the survey asks respondents to answer a question probing their general election vote choice well before the general election campaign began. As a result, our conclusions come from survey respondents who are less informed than they likely would be in an actual general election, as the campaigns and media inform them about the candidates (Erikson and Wlezien, 2012; Le Pennec and Pons, 2019). This may call into question the external validity of our findings.
Therefore, we provide more information about the candidates to a random subset of respondents before they are asked to make a vote choice in the survey. While we do not claim this information we provide fully recreates the information environment that voters are in come election day, it nevertheless allows us to probe the sensitivity of our results to a better informed electorate.
Specifically, we provide survey respondents with negative attacks against the Democratic candidate to whom they were randomly assigned. We do this for two reasons. First, as the incumbent, voters are already fairly well-informed about Trump (Broockman and Kalla, 2022). Therefore, to keep the survey succinct, we did not see the need to provide respondents additional information about Trump. Second, we only provide negative attacks against the Democrats, rather than also positive statements, because we were primarily interested in understanding the behavior of Republican survey respondents: do they become less supportive of Democratic candidates as they become more familiar with their weaknesses?
To do this, we began by drafting 8–11 attacks per candidate (see Supplementary Appendix C for a list and the wording of how this information was introduced). We drafted these attacks based on examples from each candidate’s prior elections, the ongoing primary election, and our independent research. We do not claim that these statements represent a random sample of all attacks that could be made against each Democratic candidate; however, by collecting a number of statements per candidate, we further improve the robustness of the results.
In the first half of the survey field period, we randomly sampled two of several attacks for each Democratic candidate to show respondents. We then analyzed the survey data to identify which attacks were most effective at reducing support for the Democratic candidate compared to respondents who did not see these attacks. Then, in the second half of the field period, we showed respondents the three most effective attacks on each candidate. However, as we show below, results are similar whether examining the first or second half of the data. Round 1 had 25,231 participants (14,488 of whom were shown attacks) and Round 2 had 14,919 participants (12,937 of whom were shown attacks).
The primary results we present below exclude respondents who were shown attacks against the Democratic candidates. Later in the paper, we present these results as part of a robustness check.
Statistical Models
To analyze the Nationscape data, we stack the data at the respondent-by-candidate level and run regressions like the following
y is coded as −1 if the respondent indicated that they would support Donald Trump; 0 for “don’t know”; and 1 if supporting the Democratic candidate. This coding of the dependent variable allows for a straightforward comparison of the differences in expected vote margins against Trump between the different Democratic candidates.
In our original survey data, we use a similar statistical model, although because we only asked about one candidate per respondent, there is only one observation per respondent. Accordingly, in our original survey data, we run regressions like the following
X i is a vector of controls based on pre-treatment survey questions we use to increase the precision of these between-subject comparisons. α is the intercept term. We use robust standard errors.
The dependent variable y is coded in the same manner as in the Nationscape surveys, although we incorporate our second question asked of those who said they initially did not know who they would vote for as follows: the −1 and 1 categories include respondents who said they leaned towards one of candidates, and those who said they were completely undecided or would not vote are assigned 0.
Results
Perceptions of Candidate Ideology
First, we verify that respondents perceive the expected ideological differences between the candidates. We asked respondents at the end of our survey to place the major candidates and Trump on a 7-point ideological scale. Figure 1 shows that respondents place Bloomberg, Biden, and Buttigieg at more moderate positions on the scale than Warren and Sanders. Moreover, voter knowledge about the candidates’ ideology appeared relatively high; on average, only 23% of voters said they did not know how to ideologically place the Democratic candidates, only slightly higher than the 15% of voters who said they did not know how to place Trump ideologically. Among those placing Trump on the ideological scale, 78% say he is conservative.
6
Placements of Trump and Democratic Candidates on Left-Right Ideological Scale. Note: Each plot shows the distribution of responses to the ideological placement question by candidate. The red square is the mean, calculated excluding respondents who did not know. Below each candidate’s name is the percentage of respondents who did not know how to place the candidate on the ideological scale. These estimates are weighted using the General Population (ACS). Supplementary Figure A1 shows the results by respondent party and Supplementary Table A2 shows pairwise comparisons of the candidates. Supplementary Table A4 shows similar results in a February 2020 Pew survey.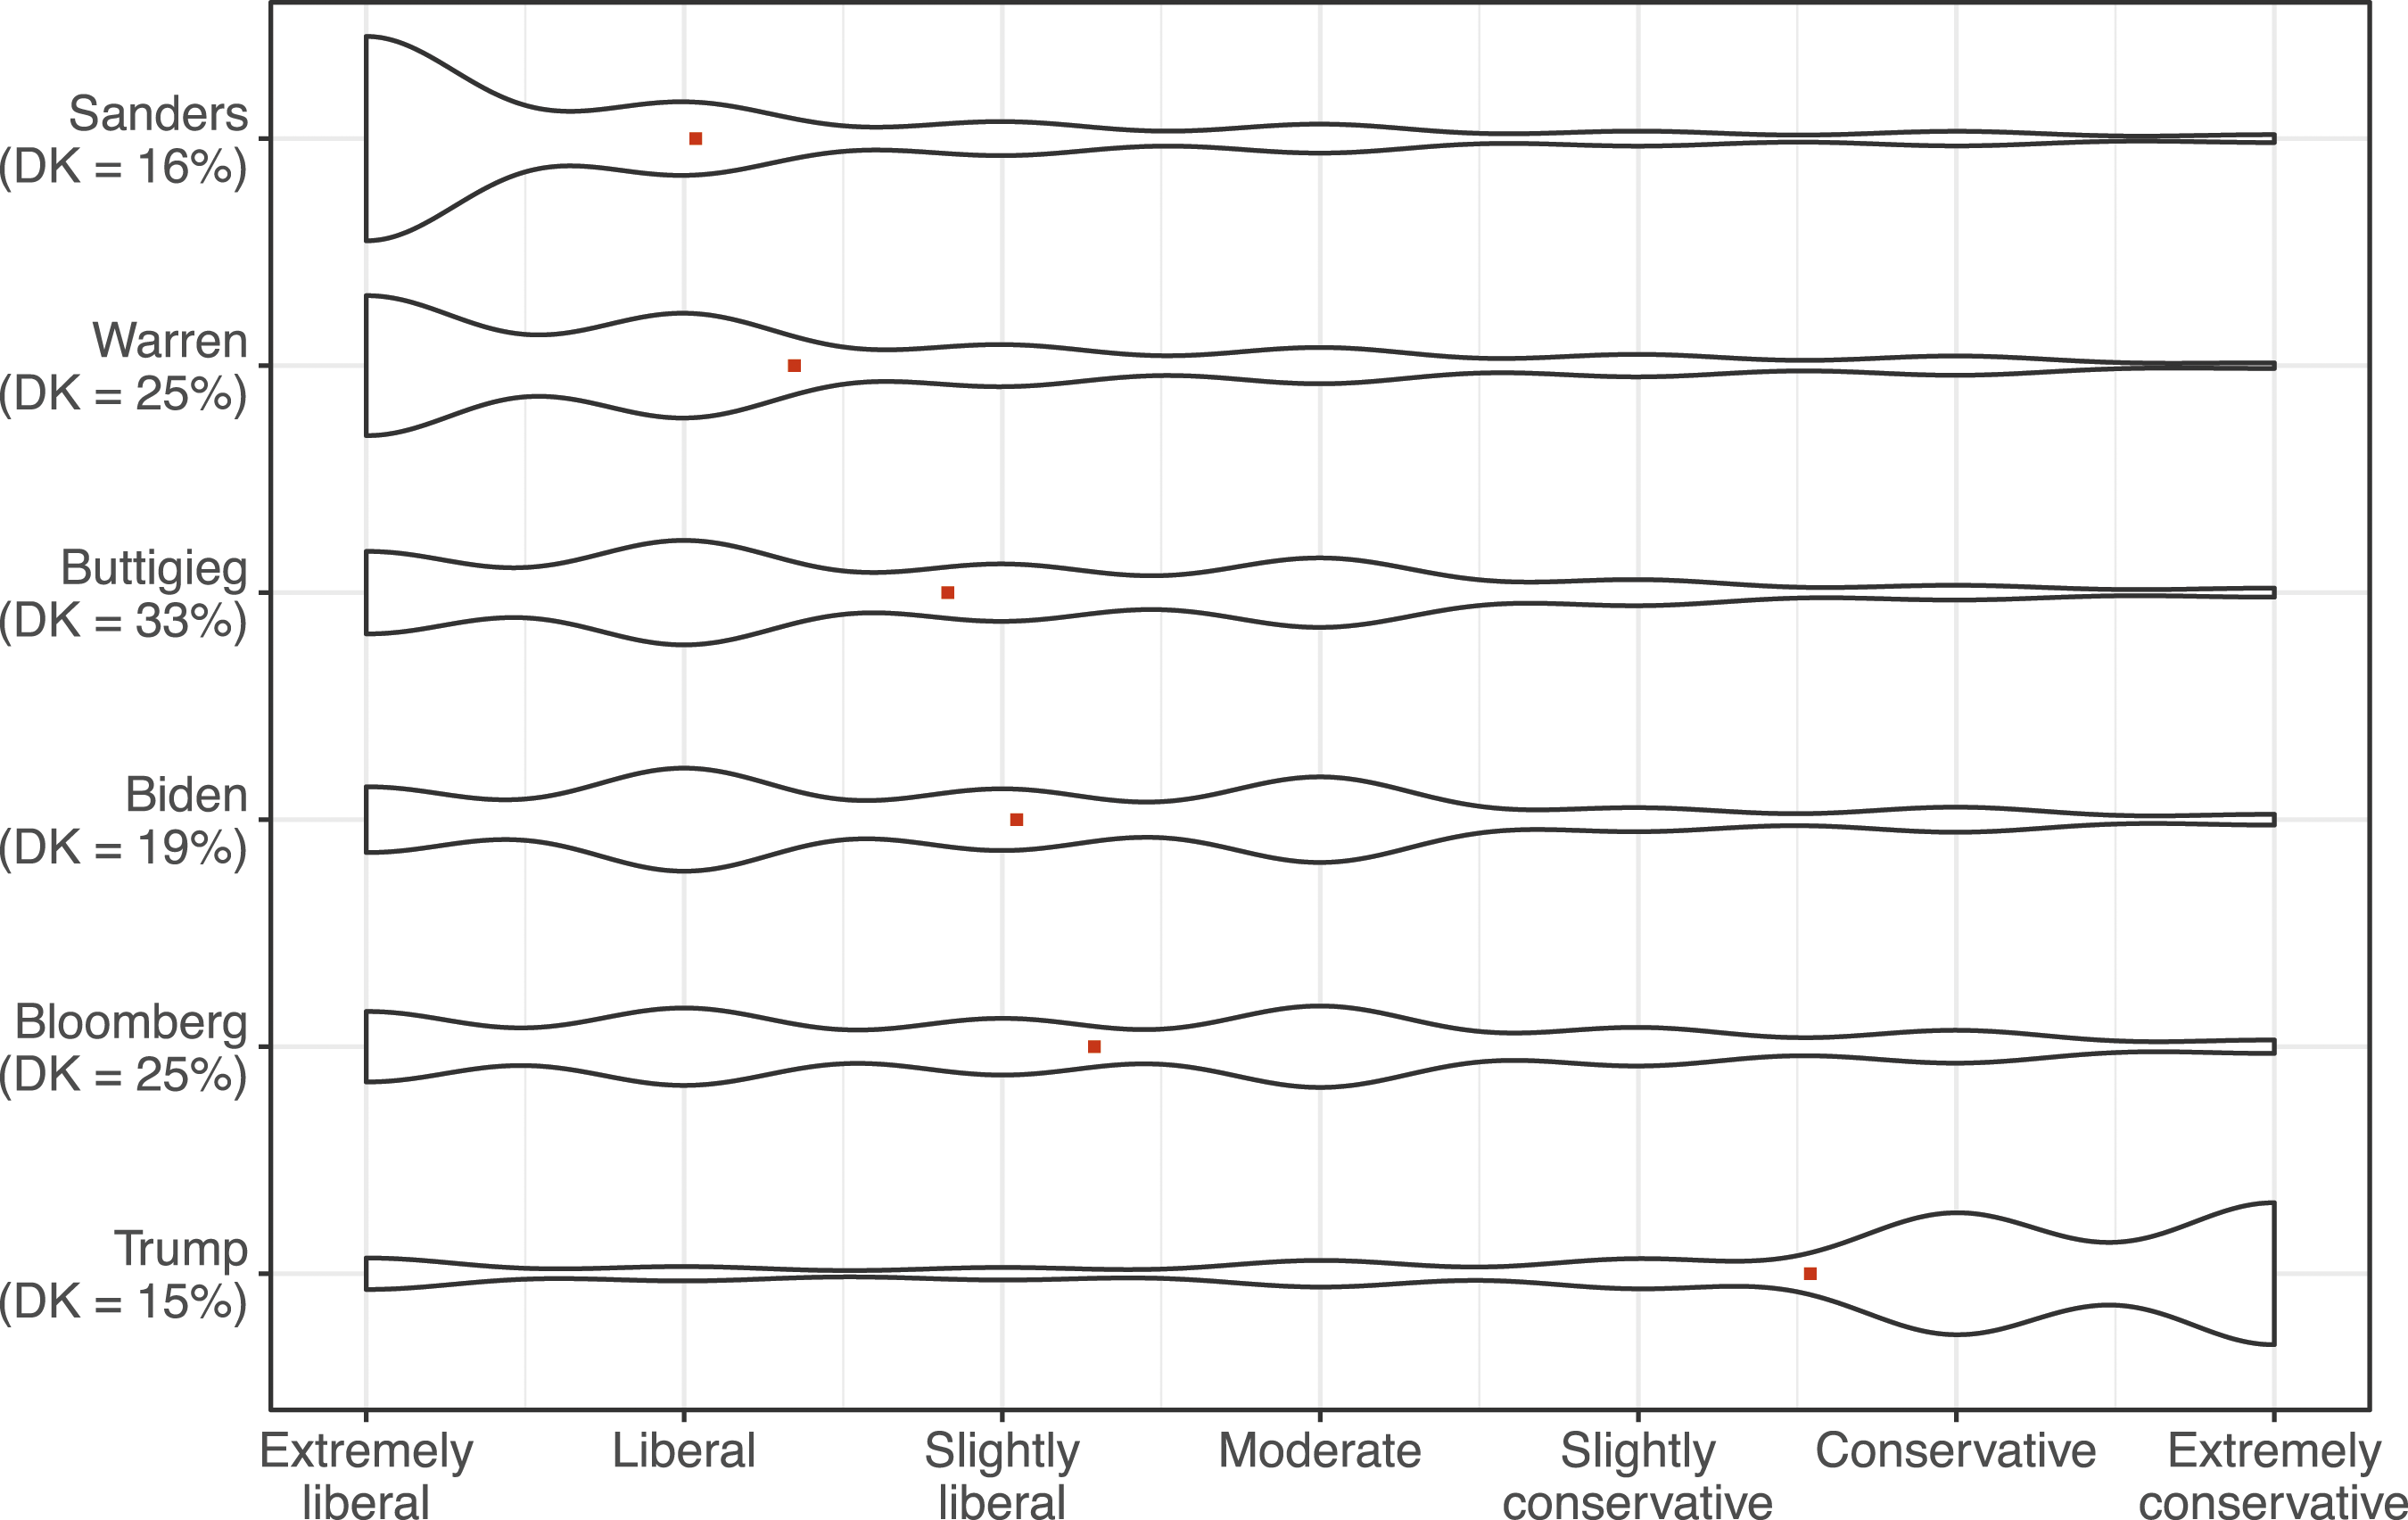
Propitiously for the representativeness of our sample, these levels of ideological knowledge are fairly comparable to other publicly available polling from this time. For example, the 2019 CES asked respondents to rate the ideology of Donald Trump. 21% of respondents answered “Not sure” and 82% of respondents who placed Trump on the ideological scale said he is conservative. Similarly, according to YouGov polling from January and February 2020, around 20% of respondents answered “Not sure” for Trump’s ideology and 75% considered him to be conservative. 7
Voter Support by Candidate
Next, we examine the differences in expected vote margins for Donald Trump when he is against different Democratic candidates (the β coefficients in the models above).
The first row in Figure 2(a) reports the results of a regression where we compare all moderate candidates (Biden, Bloomberg, Buttigieg) to all non-moderates (Sanders and Warren), using equation (1). As described above, we use Nationscape’s provided weights. We find a statistically significant increase in Democratic vote margin when comparing the performance of all moderate candidates to all non-moderate candidates, with moderates performing better by β = .0088, or .88 percentage points (SE = .0028, t = 3.16). Vote Choice – Entire Sample. (a) Nationscape. Notes: Point estimates are β coefficients from the regression given in equation (1). 95% confidence intervals surround point estimates. The regression results from which the coefficients reported in this Figure are drawn are reported in Supplementary Table A7. (b) Original Survey. Notes: Point estimates are β coefficients from the regression given in equation (2). 95% confidence intervals surround point estimates. The regression results from which the coefficients reported in this Figure are drawn are reported in Supplementary Table A8. Nationscape collected data from January 23 to March 26, 2020, with the only category other than the two candidates being “don't know.” Original survey data collected from January 21 to February 24, 2020. Survey options include “don’t know” and “would not vote” categories (see Table 1).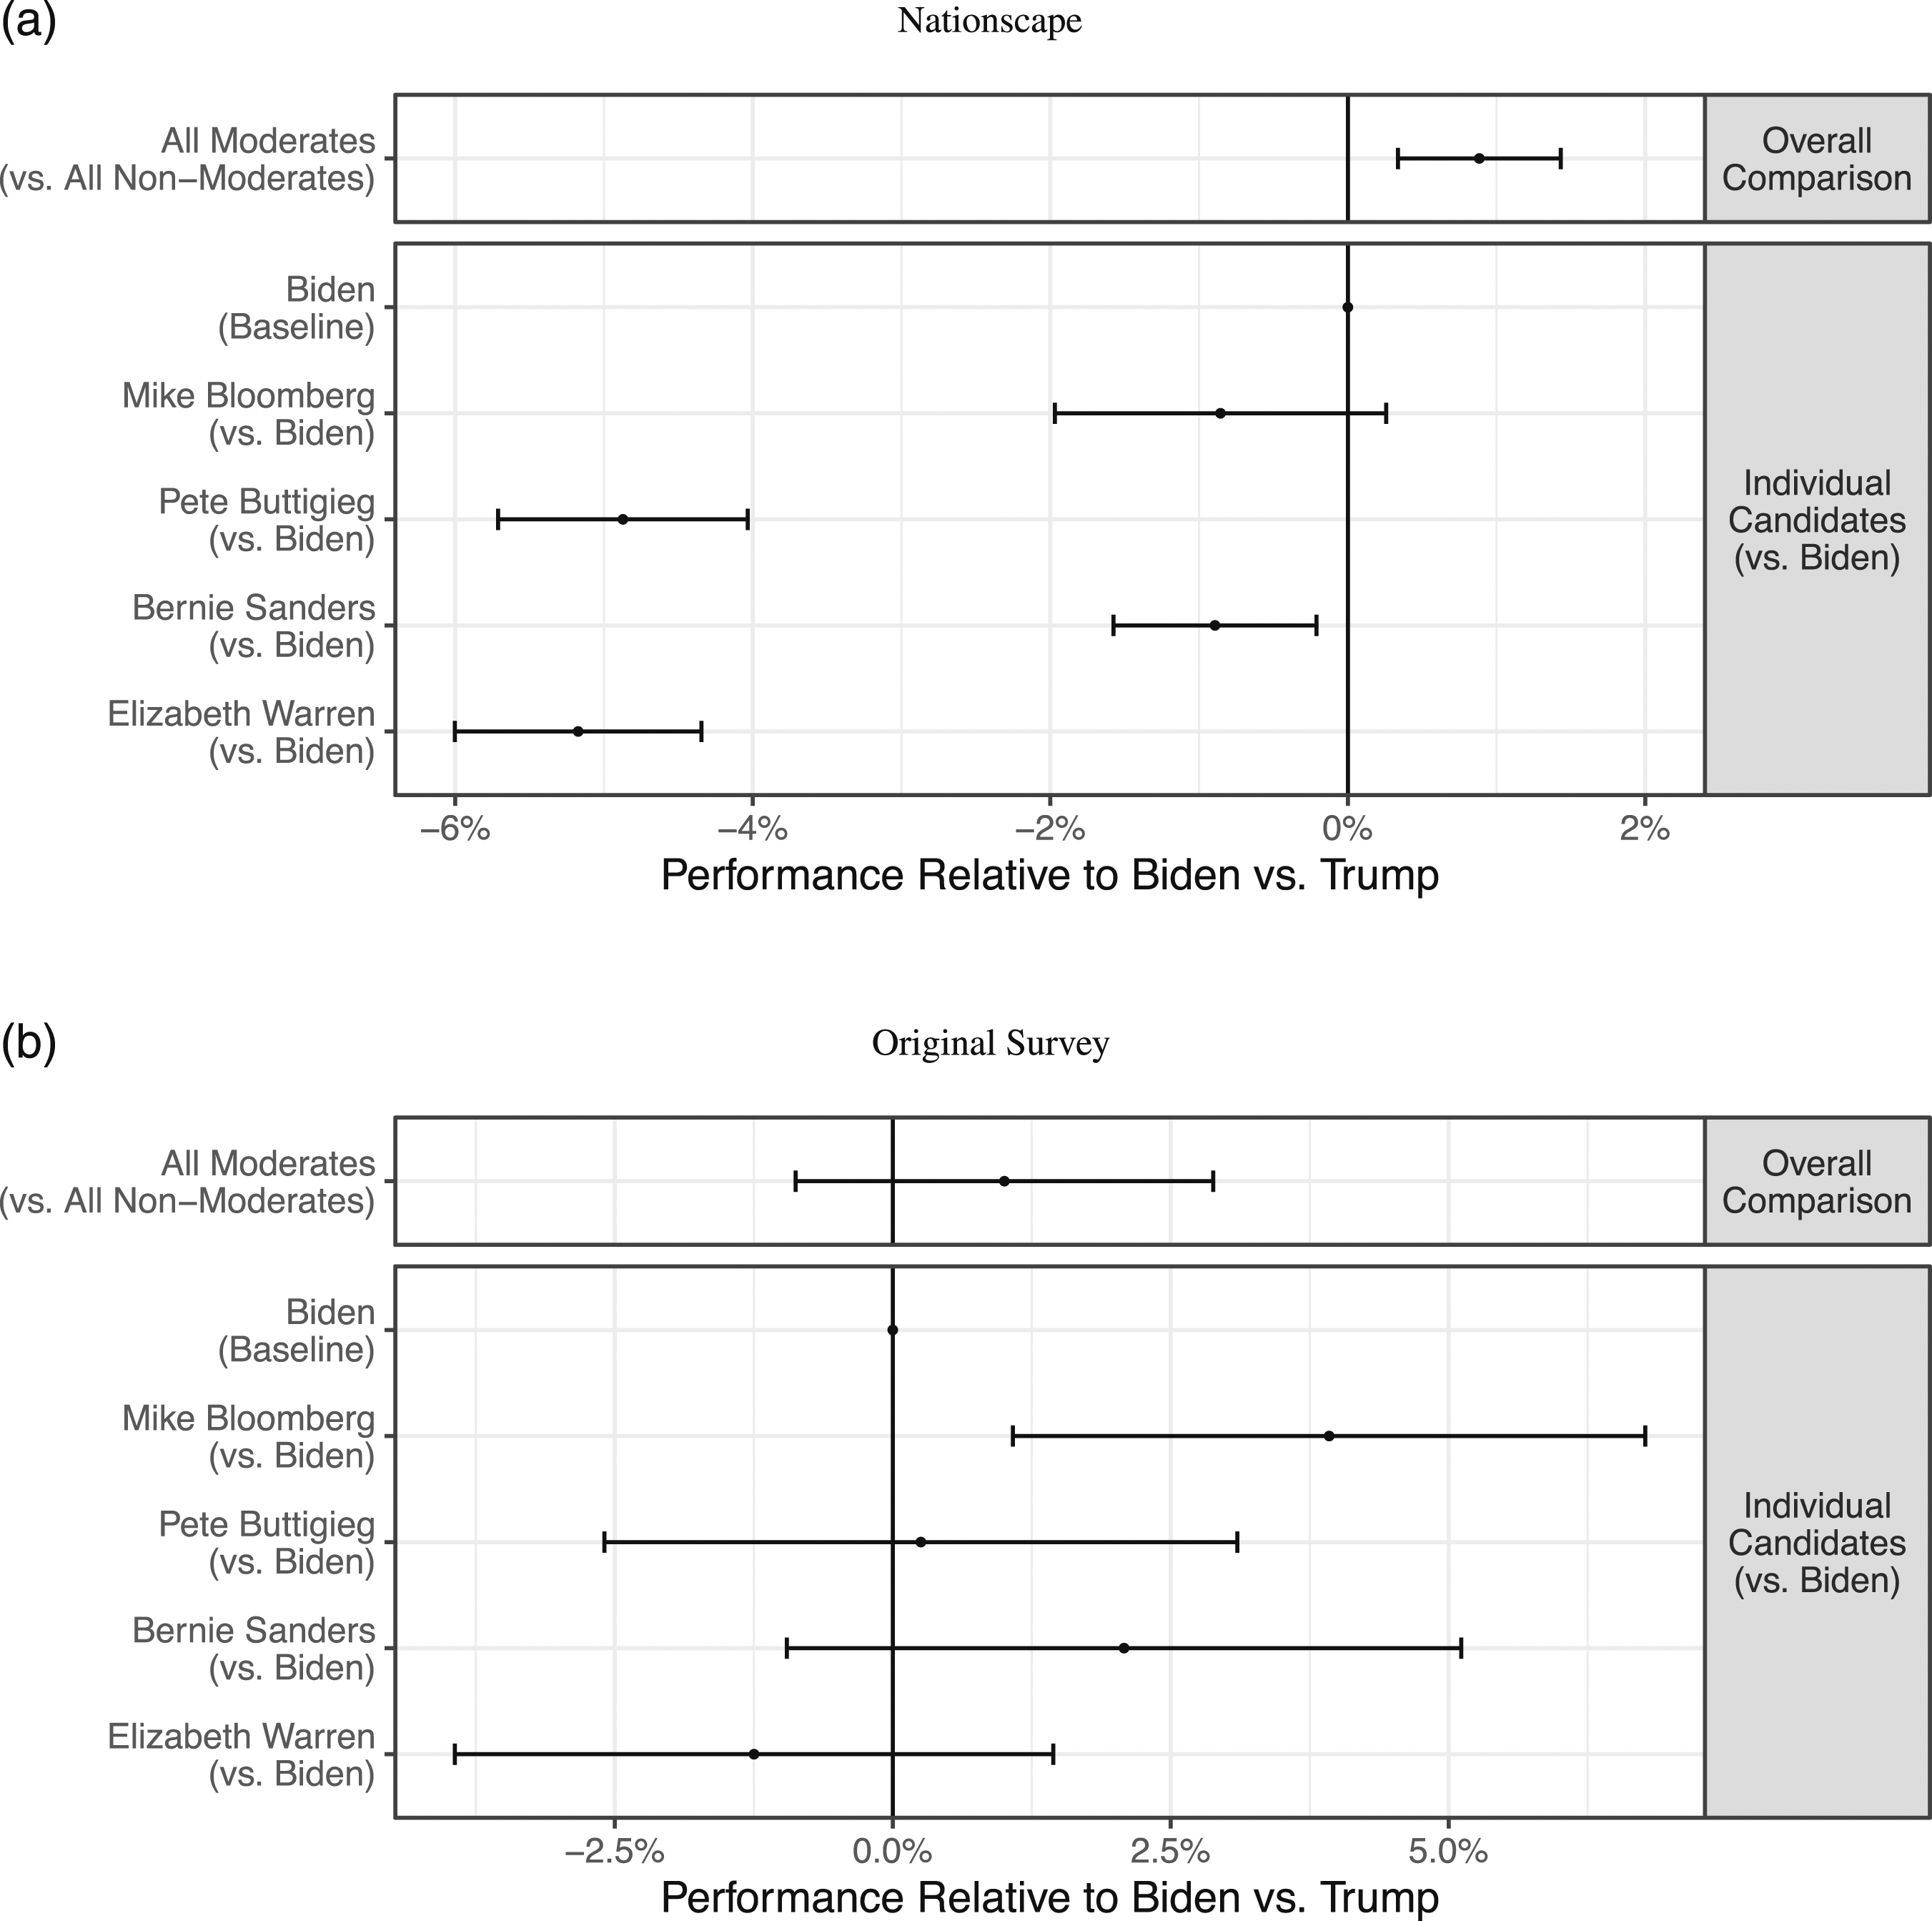
The remaining rows of Figure 2(a) report coefficients from a second regression, again following equation (1), where we make Joe Biden (the ultimate primary winner) the baseline category and compare Biden’s performance against the performance of the remaining candidates.
The comparison between Biden and Sanders is particularly informative in this analysis. Biden and Sanders are both older, white men. As Figure 1 and Supplementary Table A3 show, they have similar degrees of name recognition. Public perceptions of their character traits are also similar; they are evaluated similarly in terms of their leadership skills and stamina (Supplementary Table A5). If anything, Sanders has a likely electoral advantage in being perceived as approximately 10% points more honest and trustworthy than Biden. However, despite these demographic and character similarities, Biden is perceived as substantially more moderate than Sanders (Figure 1 and Supplementary Table A4). 8 The Biden/Sanders comparison is thus a useful case for testing whether moderates perform better than extremists.
As can be seen, Biden performs significantly better against Trump than both Bernie Sanders (β = −.0089, SE = .0035, t = −2.57) and Elizabeth Warren (β = −.0517, SE = .004, t = −12.23). Both Michael Bloomberg and Pete Buttigieg also appear to do worse than Biden, although in the case of Bloomberg the difference is not statistically significant. Overall, then, Figure 2(a) shows that moderates perform better than extremists on average, with eventual nominee Biden performing better than both extremists but with some heterogeneity among the candidates.
Figure 2(b) reports the results of these same analyses but in our original survey data among respondents to whom no attacks were shown. Recall that our original survey data only asked each respondent about how they would vote between one of the candidates and Trump, and so we only have between-subject data. The sample size of our original survey is also smaller. This makes our standard errors larger. Nevertheless, we see qualitatively similar results. Overall, our first regression results shows that we again estimate that the moderates would do better than the extremists. Although it falls short of statistical significance, the result in our original survey is similar in magnitude to the estimate from the Nationscape survey (β = .0100, SE = .0096, t = 1.05).
The remaining coefficients again compare Biden’s performance to the performance of the other candidates. The results are qualitatively similar to the Nationscape data, but noisier. One important difference is that the point estimate for Bernie Sanders, which was significant and negative in the Nationscape data, is now slightly positive in our original data, although not significantly so (β = .02080, SE = .0155, t = 1.34).
In the next section of the paper, we examine the data more closely in two ways, reaching two additional conclusions.
First, we examine what drives the overall superior performance of moderates. We find that moderates’ support is driven by Republican voters who say they would cross party lines to vote for a moderate Democrat but who would otherwise vote for Trump against a more extreme Democratic nominee.
Second, as part of this examination, we show that Sanders’ relatively strong position appears to arise because many young Democrats and Independents claimed they will not vote unless Sanders was the nominee. We show that this is responsible for Sanders’ ostensibly strong performance and that reasonable corrections for likely turnout diminish Sanders’ performance.
Understanding Moderates’ Sources of Support
The Democratic vote margin outcome analyzed in Figure 2 relied on a trichotomous outcome (y from equations (1) and (2)) defined as −1 if individuals said they would vote for Trump, 1 if they said they would vote for the Democratic candidate in the match-up, and 0 otherwise (in Nationscape, this is “Don’t know,” in our survey this is “Completely undecided” or “I definitely would not vote” (in the second round of data collection only)).
In this section we examine which of these three categories drives changes in vote margin for moderates versus for Sanders and among what subgroups. Here, we focus on comparing the moderates’ performance to Sanders’ only, and not to Warren’s, because it is the harder case for our conclusion about moderates’ advantages; Sanders’ position remains somewhat ambiguous from Figure 2 but Warren is consistently the lowest performing candidate. This examination helps bolster confidence that moderates win votes that extremist candidates—even Sanders—do not.
Figure 3 shows the difference between the share of respondents that selected Trump, Don’t know or Neither/Would not vote, and Democratic nominee categories when a moderate instead of Sanders is the nominee in the match-up. In particular, each coefficient in Figure 3 reports the results of a separate regression conducted among the subgroup shown on the left, where we define the outcome y as a dichotomous variable equal to 1 if the respondent selected the category at the top of the graph and 0 otherwise. β then captures the effect of nominating one of the three moderates instead of Sanders. These regressions use the specifications described in Equations (1) and (2) with Nationscape weights or ACS weights for the original survey. For instance, the top-most and left-most coefficient in Figure 3(a) shows that, in a regression in the Nationscape sample, Republican respondents are 2% points more likely to say they would vote for Trump if Sanders is the nominee in the match-up than if a moderate is the nominee in the match-up. Vote Choice by Party: Sanders’ Nomination Increases Votes for Trump, Decreases Votes for Democrats Among Republicans Relative to More Moderate Democrats. (a) Nationscape. Notes: Each coefficient is from a separate regression conducted among the subgroup shown at left and where the dependent variable is 1 if the respondent selected the category shown at top and 0 otherwise. All regressions use the Nationscape included weights. The regressions otherwise are identical to that shown in equation (1). 95% confidence intervals surround point estimates. All regressions use Nationscape’s included weights. The regression results from which the coefficients reported in this Figure are drawn are reported in Supplementary Table A9. (b) Original Survey. Notes: Each coefficient is from a separate regression conducted among the subgroup shown at left and where the dependent variable is 1 if the respondent selected the category shown at top and 0 otherwise. The regressions otherwise are identical to that shown in equation (2). 95% confidence intervals surround point estimates. All regressions use General Population (ACS) weights. The regression results from which the coefficients reported in this Figure are drawn are reported in Supplementary Table A10.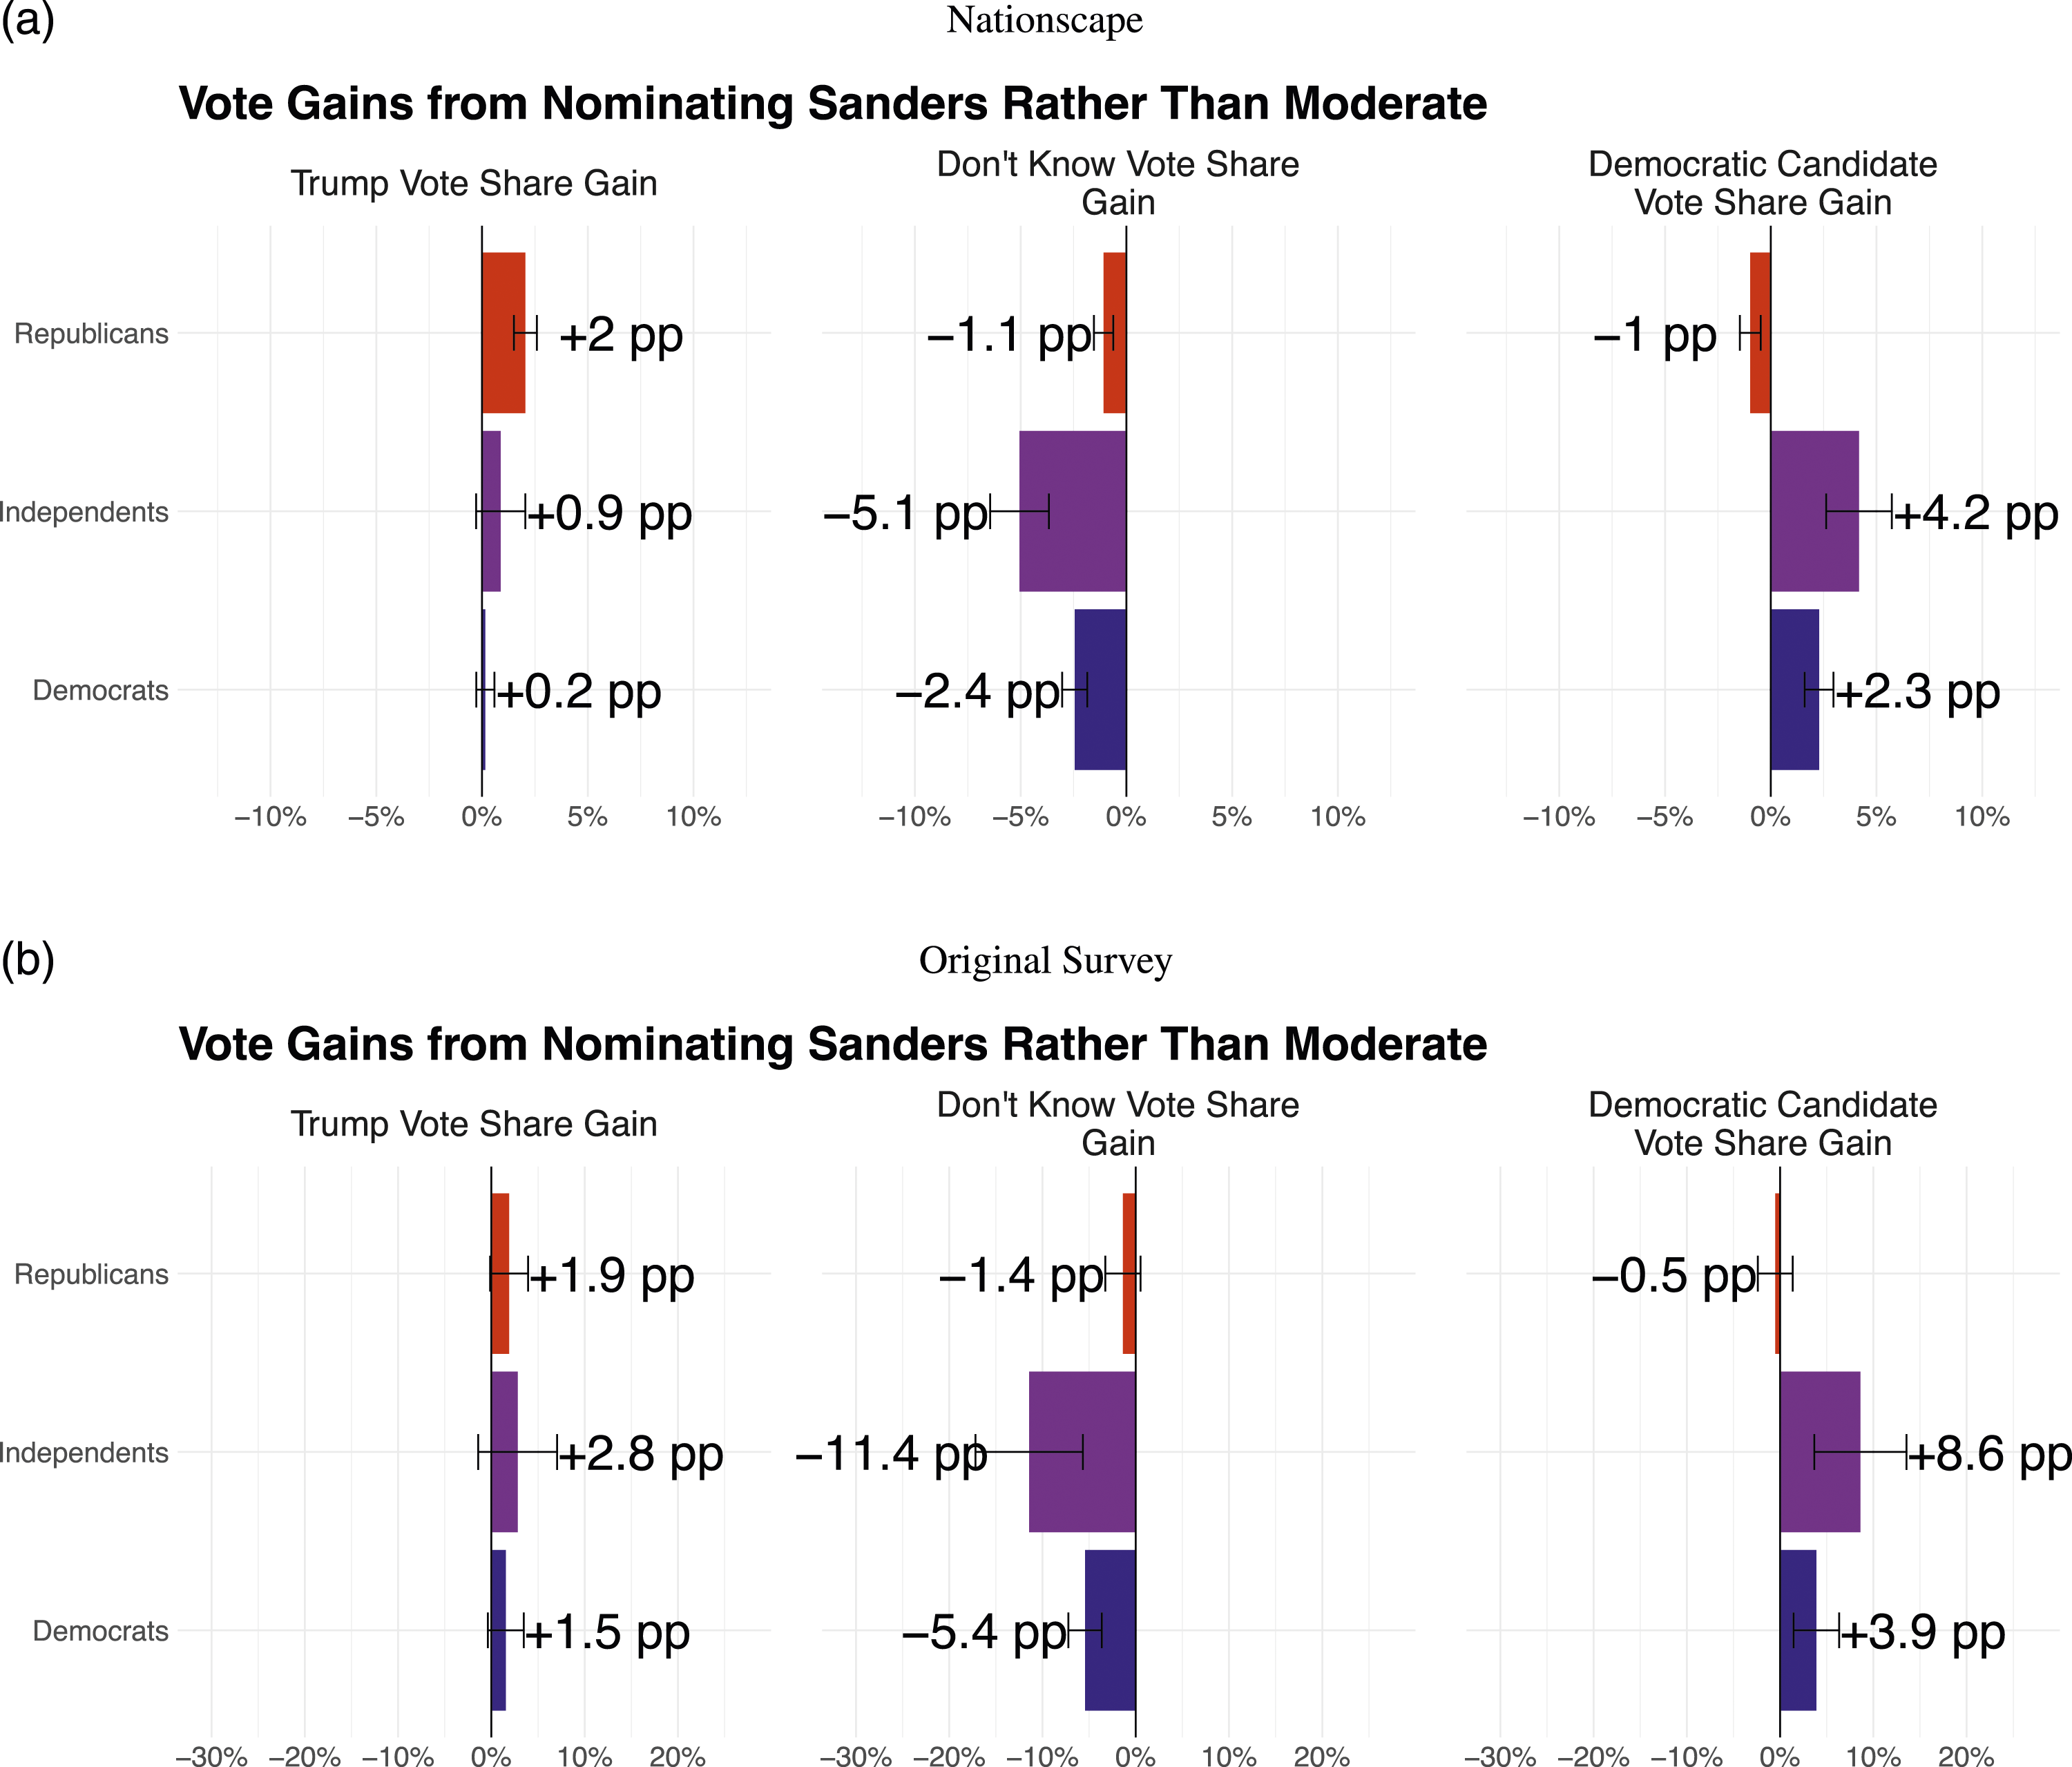
Moderates’ advantage over Sanders is driven by Republicans being more likely to say they would vote for Trump, and less likely to say they would vote for the Democratic candidate, if Sanders is the nominee. The top rows of Figures 3(a) and 3(b) show that these results appear in both datasets. In the Nationscape data, Republicans are 2.0 percentage points more likely to say they would vote for Trump if Sanders is the nominee instead of one of the moderates (SE = .0028, t = 7.40), and 1.0 percentage points less likely to say they would vote Democratic if Sanders were the nominee (SE = .0025, t = −3.81). In our original survey data, the estimates are substantially noisier but similar in magnitude: Republicans are 1.9% points more likely to say they would vote for Trump if Sanders is the nominee instead of one of the moderates (SE = .0104, t = 1.82), and .5 percentage points less likely to say they would vote Democratic if Sanders were the nominee (SE = .0095, t = −.54).
These results are contrary to expectations of many scholars who emphasize the importance of partisanship in American politics but are consistent with the literature on moderate candidates’ advantages: in both datasets, an electorally significant share of Republicans say they will vote for one of the moderate Democrats, but return to saying they will vote for Donald Trump if Bernie Sanders is the Democratic nominee.
Sanders’ Ostensible Sources of Support
Given the advantage among Republicans that moderate Democrats enjoy (as reported in Figure 3), why is Bernie Sanders’ underperformance relative to the moderate Democrats not larger in our primary analysis (reported in Figure 2)? Sanders’ relatively strong position in our primary analysis arises because many Democrats and Independents claimed they will not vote unless Sanders is the nominee. The bottom two rows of coefficients in Figures 3(a) and 3(b) show this finding. In neither case do we find much evidence that Independents or Democrats would vote for Trump if a moderate Democrat were nominated. However, we do find that a large proportion of Democrats and Independents fall into the middle “don’t know” or “undecided”/“would not vote” category if Sanders is not the nominee, whereas they say they would vote for Sanders if he is. In other words, Sanders appears to perform almost as well against Trump as moderates despite his losses among Republican voters because of a large share of Democrats and Independents who say they would only vote for him as the Democratic nominee. However, these voters do not say they would otherwise vote for Trump.
Is this offsetting dynamic plausible? Hall and Thompson (2018, Table 6) find that nominating an extremist candidate may have a positive though statistically insignificant effect on increasing own-party turnout, although this effect is swamped by the much larger increase in opposing party turnout from nominating an extremist. In our data, we cannot rely on validated actual voter turnout because we are estimating counterfactual general election vote intentions. However, investigating which demographic groups convert from saying they are indifferent or would not vote to saying they would vote for Democrats when Sanders is in the head-to-head question can help inform the plausibility that Sanders is equally electable as the more moderate candidates.
In Figure 4, we show that Sanders’ conversion of votes from the neither/would not vote category to the Democratic candidate category is driven in large part by Democrats and Independents under 35 years old.
9
In particular, Figure 4 replicates the same analysis as in Figure 3 but breaks down the results in each panel by different demographic categories instead of by respondent partisanship alone. The top two rows of each panel show that both white and non-white Democrats and Independents under 35 claim they would be far more likely to vote for Democrats, and far less likely to not vote or “don’t know,” if Sanders is nominated. For both, the magnitude of this claimed increase in intent to turn out when Sanders is the nominee is extremely large, or around 11% points on average. Vote Choice by Demographics – Comparing Sanders and Moderate Candidates. (a) Nationscape. Notes: Each coefficient is from a separate regression conducted among the subgroup shown at left and where the dependent variable is 1 if the respondent selected the category shown at top and 0 otherwise. All regressions use the Nationscape included weights. The regressions otherwise are identical to that shown in equation (1). 95% confidence intervals surround point estimates. All regressions use Nationscape’s included weights. The regression results from which the coefficients reported in this Figure are drawn are reported in Supplementary Tables A8–11. (b) Original Survey. Notes: Each coefficient is from a separate regression conducted among the subgroup shown at left and where the dependent variable is 1 if the respondent selected the category shown at top and 0 otherwise. The regressions otherwise are identical to that shown in equation (2). 95% confidence intervals surround point estimates. All regressions use General Population (ACS) weights. The regression results from which the coefficients reported in this Figure are drawn are reported in Supplementary Tables A12–15.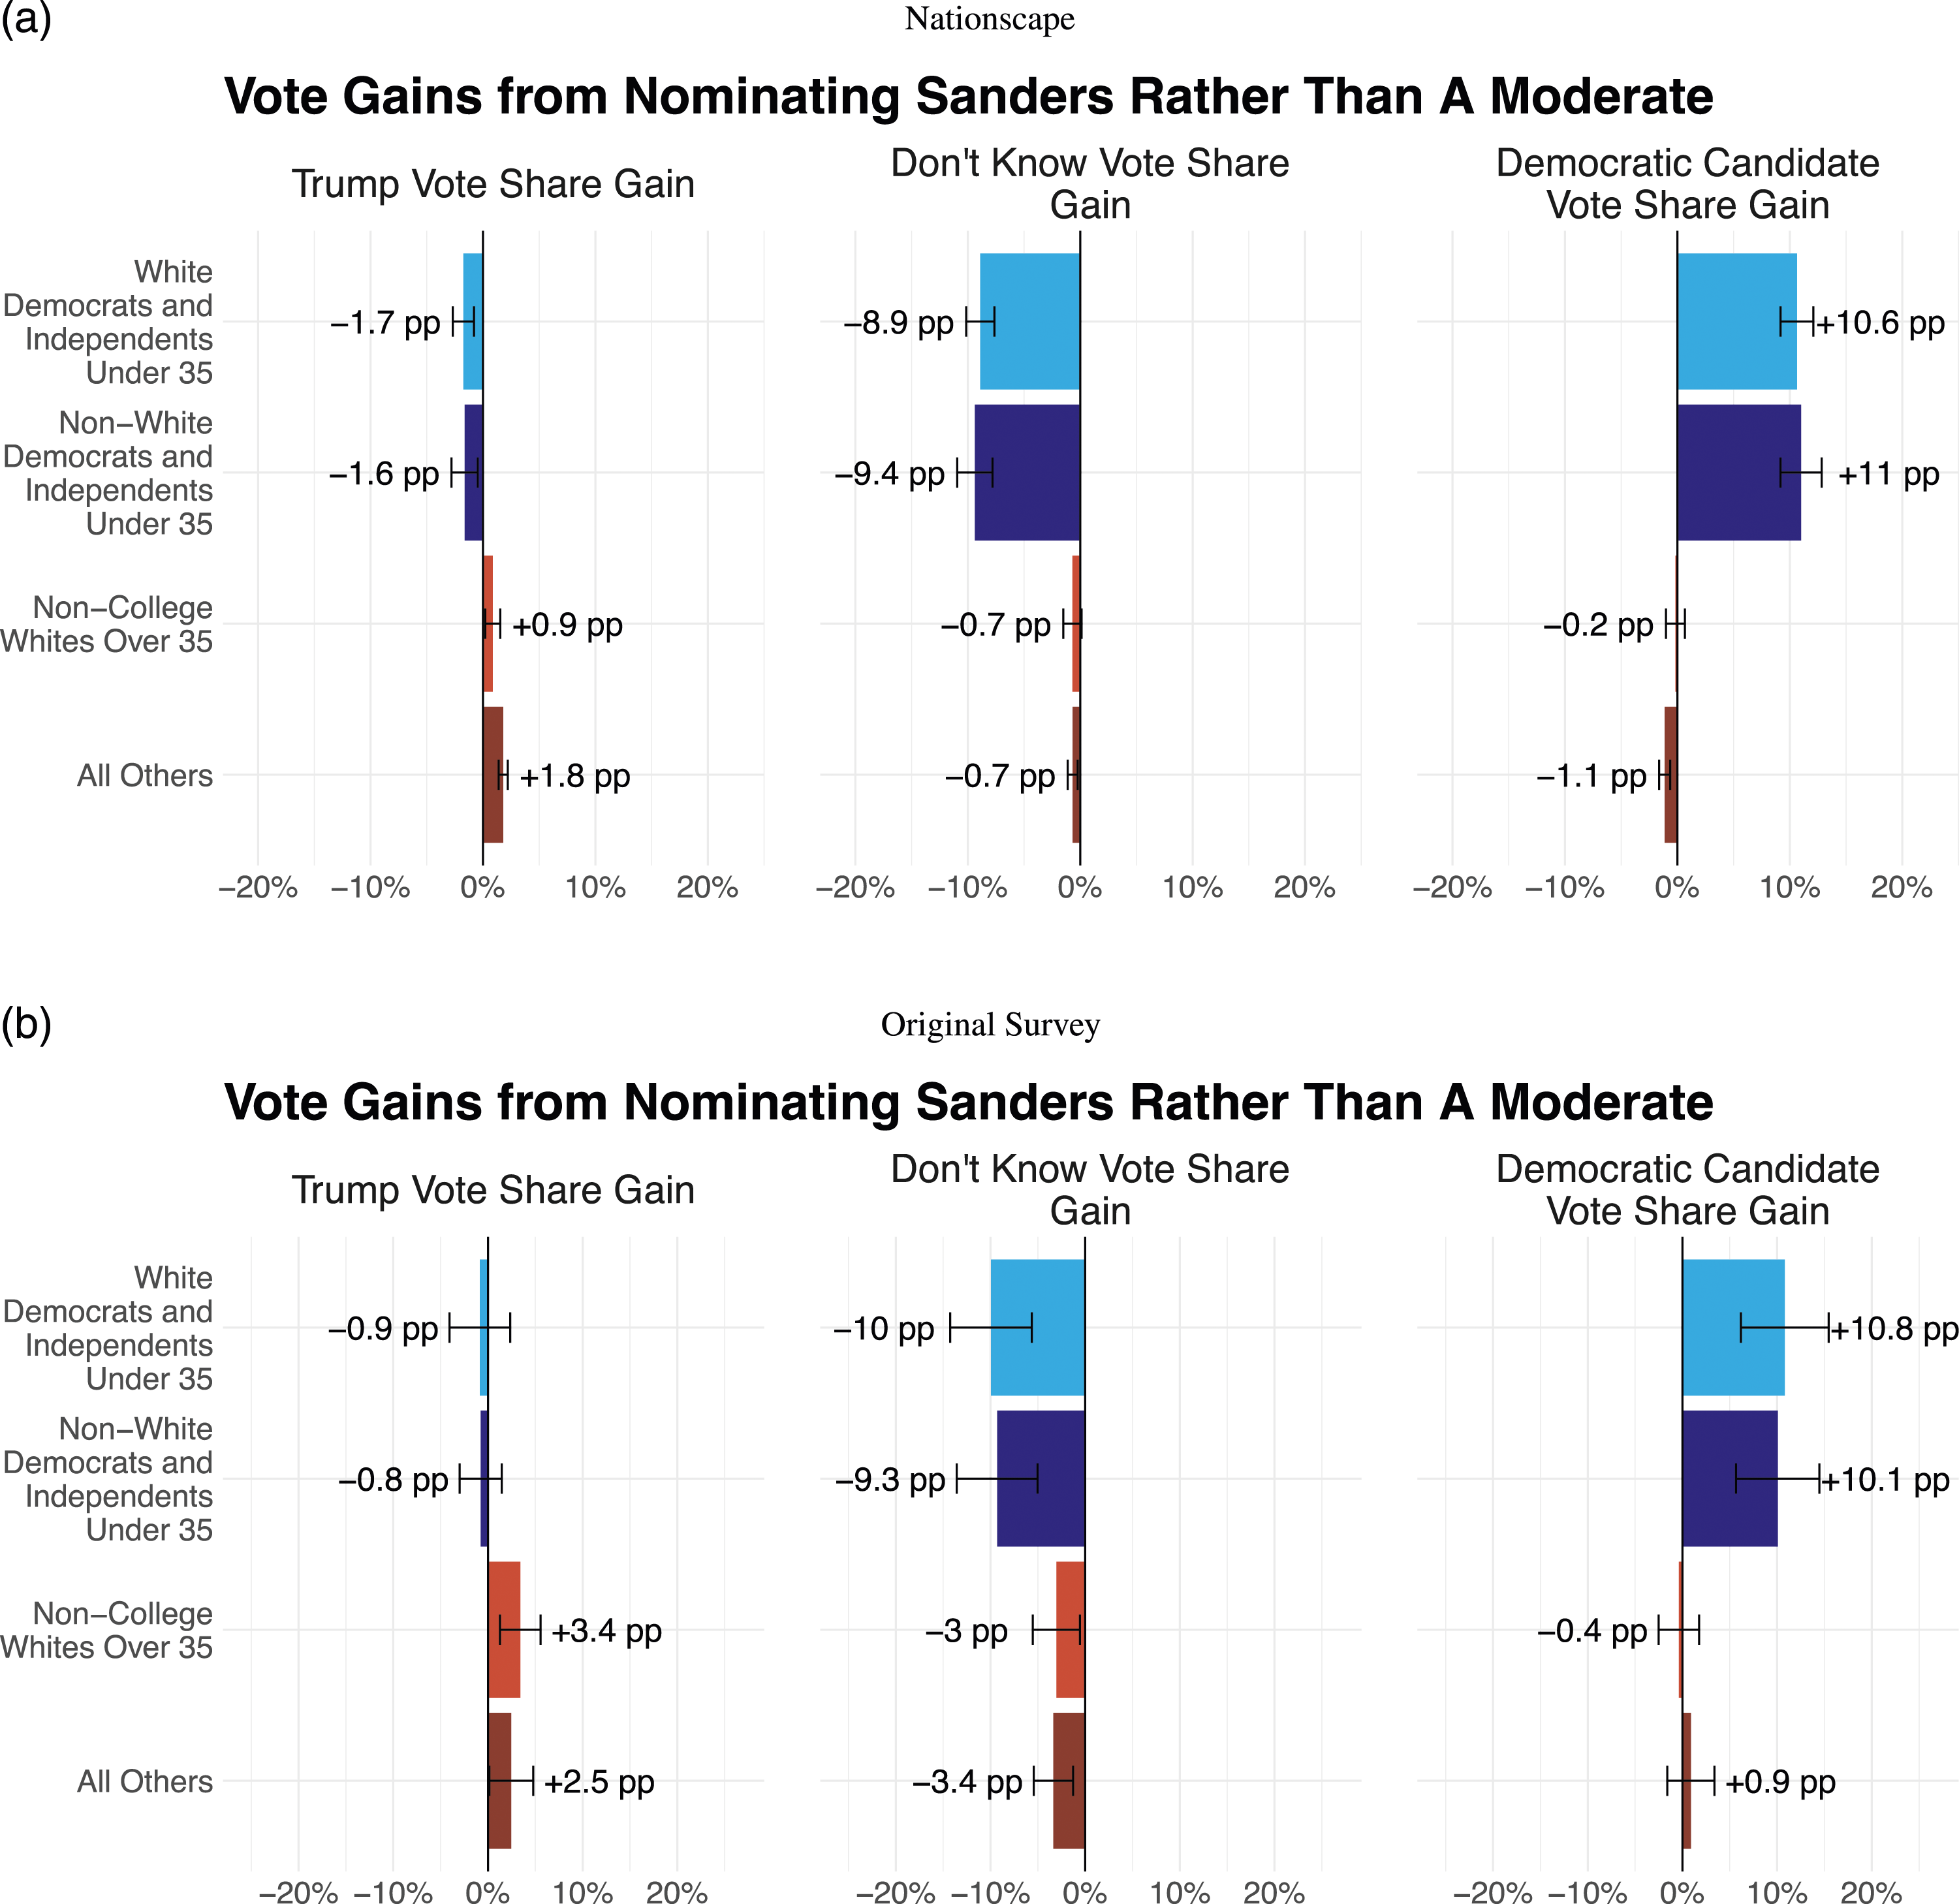
The Nationscape data only provides a single “Don’t know” option, but Supplementary Figure A2 shows that, in our original survey data where more response options are available, these voters are most likely to say that they would not vote if Sanders is not nominated. That is, the shift in support from the middle category to the Democratic category when Sanders is nominated is driven by changes between the “Democratic candidate” and “Would not vote” category.
As some popular commentary speculated that Sanders had unique appeal among older white voters without a college degree, the third row of coefficients in Figure 4 shows that if anything the opposite is the case; in both the Nationscape and our original data, Trump receives more support when Sanders is the nominee. The same holds for the remainder of the samples.
In summary, the conclusion initially suggested by Figure 2 that Sanders appears almost as electable as the moderate candidates despite his losses among Republican voters appears to substantially rest on the supposition that young Democrats and Independents would turn out at approximately 11% points higher rates if he were nominated.
There are two reasons to doubt this would be the case. First, young Democrats and Independents have relatively low baseline turnout rates to begin with, so survey data that weights to the general population rather than prior electorates overstates the importance of their voting decisions. Second, self-reported intent to turn out correlates poorly with actual turnout decisions, suggesting we should not rely on survey-based estimates of turnout (Rogers and Aida, 2014). Indeed, given that the surveys took place during the primary season when Sanders supporters might wish to strategically or expressively respond as if they would not turn out for other Democratic candidates, we may wish to be especially skeptical of self-reported turnout decisions.
To account for both of these points and examine the robustness of Sanders’ apparently strong performance, we conduct an analysis where we adjust for turnout by weighting the sample to historical patterns of turnout and do not rely on respondent’s self-reported turnout intentions. (We are only able to do this in our original data, not the Nationscape data. Given the Nationscape data’s sampling design and the dataset’s inclusion of existing weights, we cannot straightforwardly apply new weights to its existing weights that would adjust for turnout.)
Figure 5 shows the results. Each row in Figure 5 is the result of a separate regression estimated using equation (2). The coefficients shown in the Figure estimate the effect of nominating Sanders instead of a moderate candidate on Democratic vote margin. The first coefficient is a baseline coefficient using the same weights as we use in the rest of the paper, weights constructed with general population as the target (as measured in the 2018 ACS). The remaining rows apply various different approaches for weighting to likely turnout, discarding observations where respondents say they will not vote
10
and weighting the remaining responses. Estimated Effect of Nominating Sanders by Weighting Decision and Handling of “Neither”/“Will Not Vote” Responses. Notes: Each coefficient is from a separate regression conducted using the weights at left. The regressions otherwise are identical to that shown in equation (2), except the coefficient is on an indicator for 1 for respondents shown Sanders and 0 for respondents shown one of the three moderate candidates. 95% confidence intervals surround point estimates. The regression results from which the coefficients reported in this Figure are drawn are reported in Supplementary Table A19.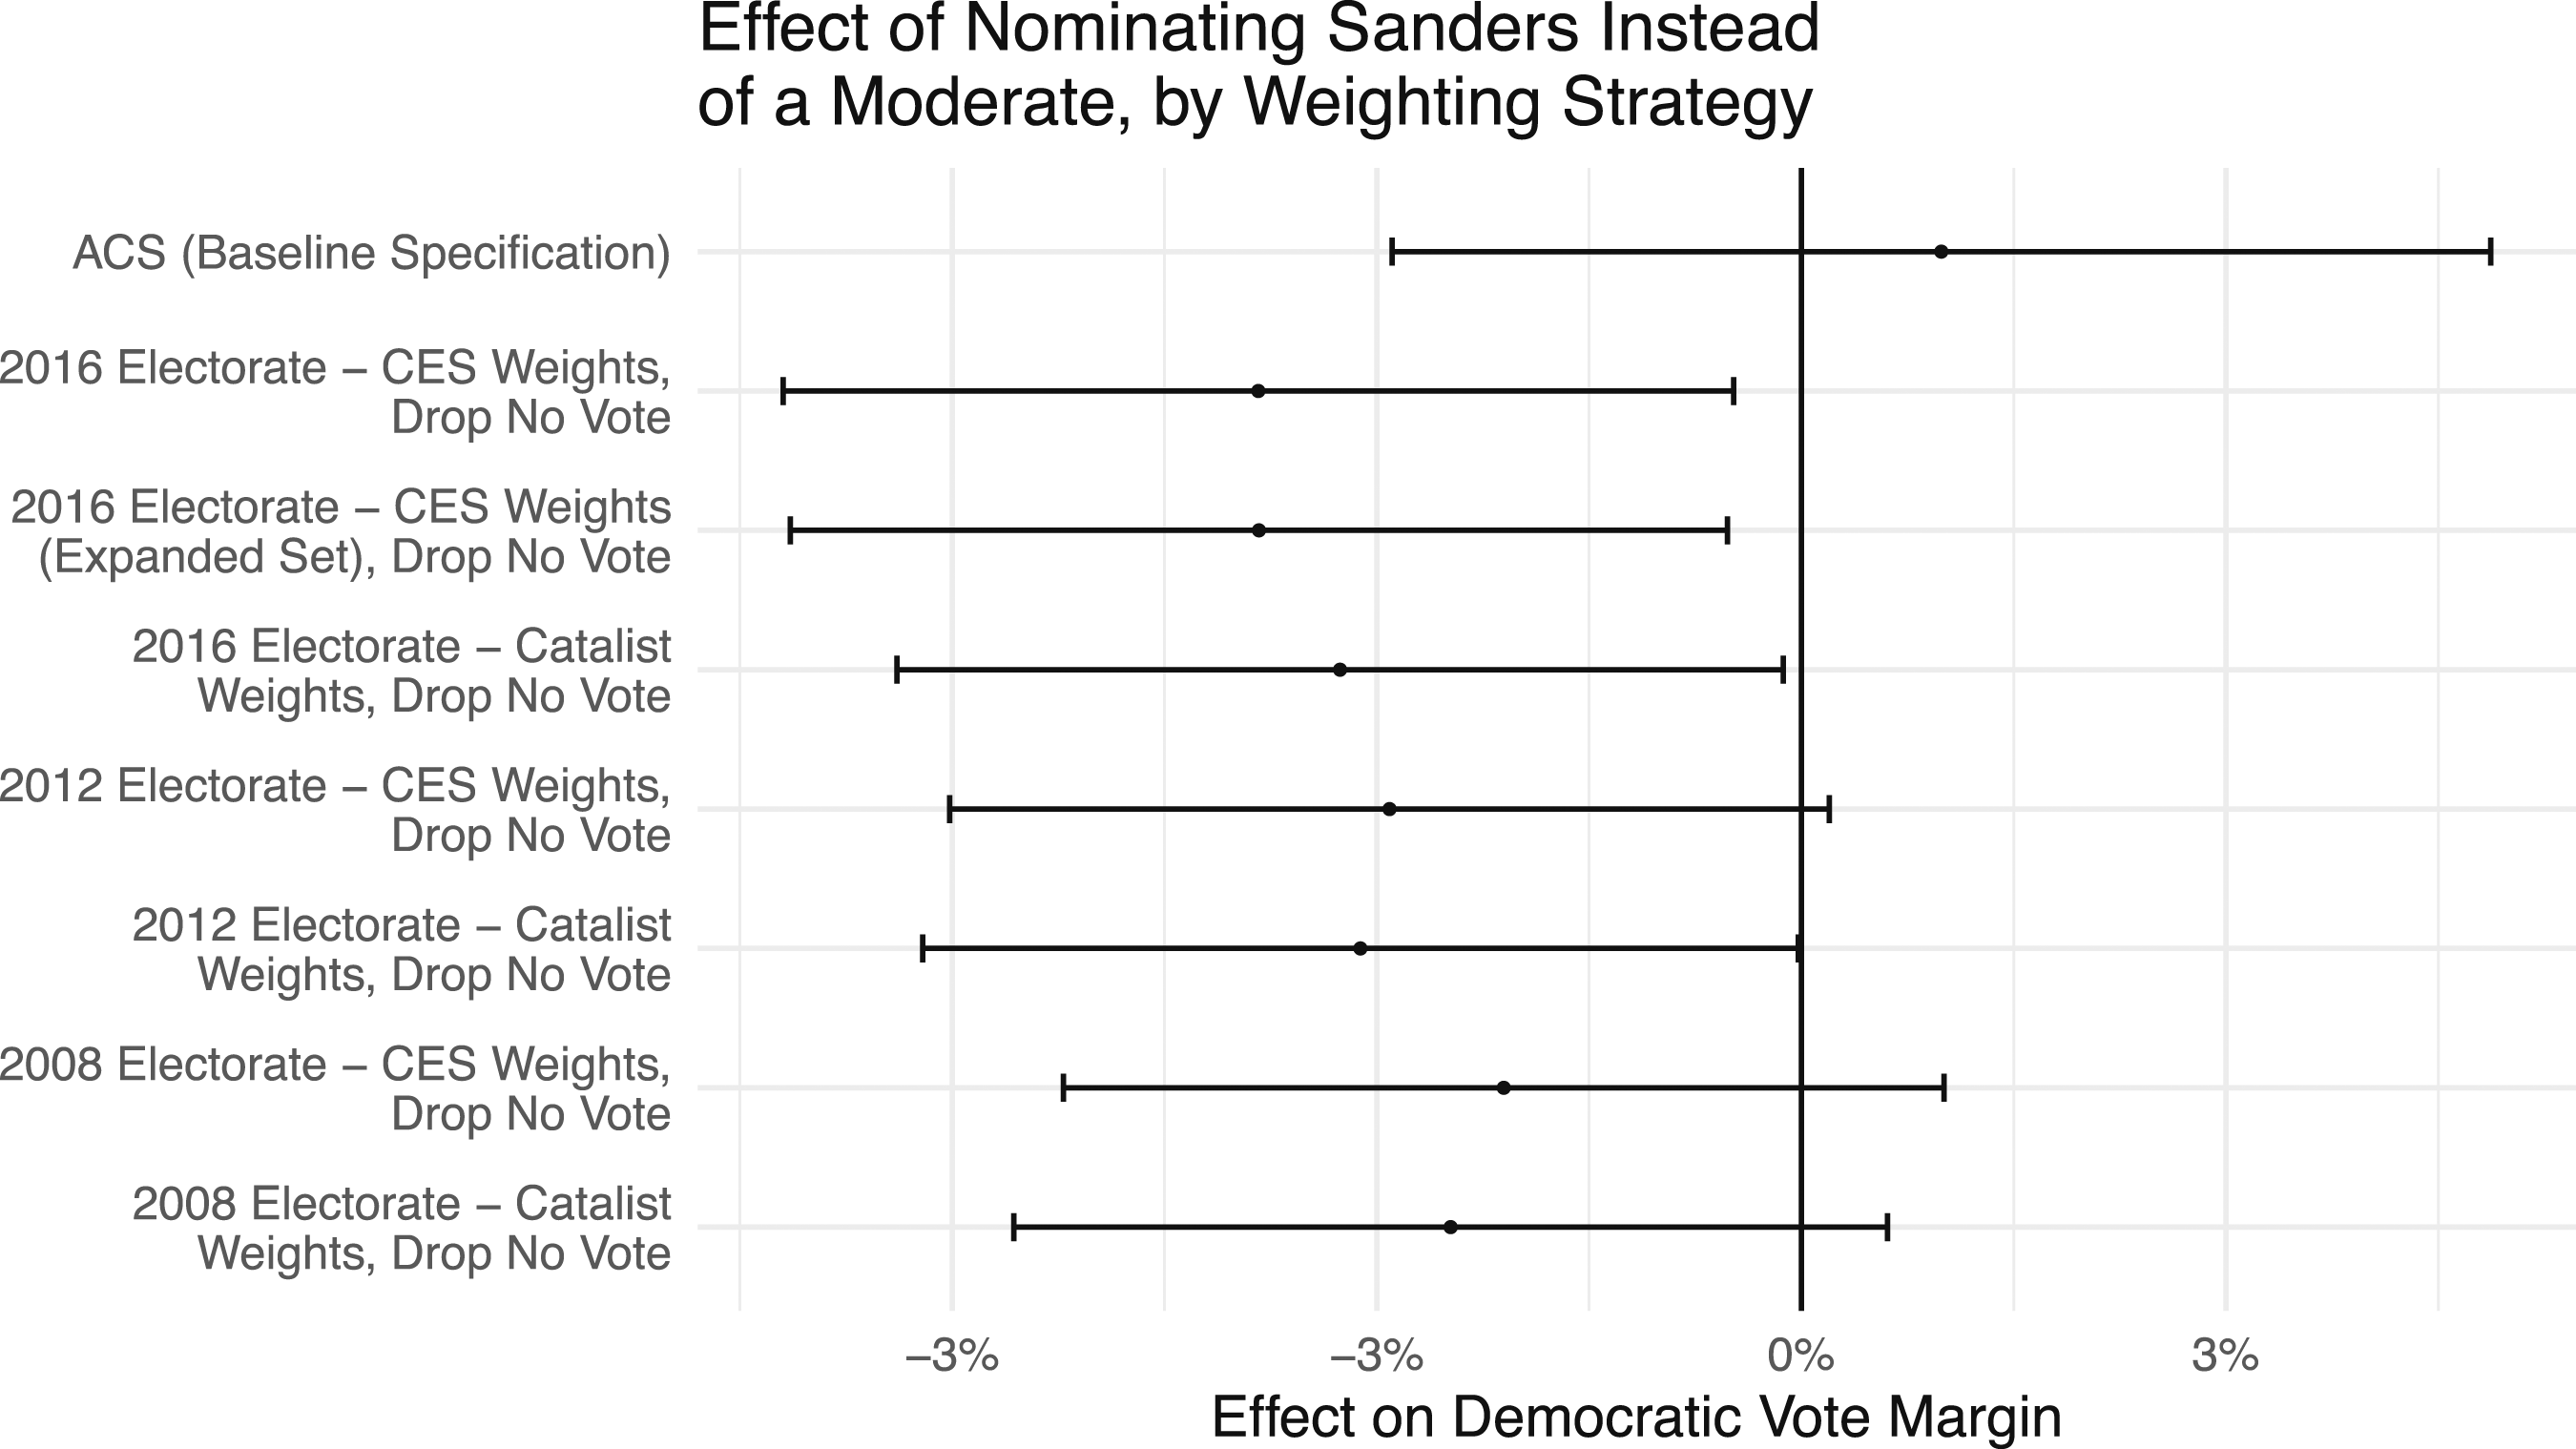
With these adjustments for likely turnout, our best guess remains that Sanders consistently performs worse than the moderate candidates across all of the weights we consider. The “2016 Electorate – CES” row uses the second set of weights we described earlier in the paper, which weight to the 2016 electorate as recorded by the CES, and the following row uses the expanded set of weights from the 2016 CES (the third set of weights we describe earlier in the paper). The following set of weights weights to the demographics of the 2016 electorate as indicated by Catalist. The remaining rows use the same strategy by weighting to the 2012 and 2008 electorates, again as indicated by the CES each year and by Catalist. The results sometimes barely escape statistical significance when the 2012 or 2008 weights are used, but the point estimates are largely similar.
In summary, concluding that Sanders would perform nearly as well as the more moderate candidates on the basis of our survey data appears to require assuming that nominating him would have increased turnout among Democrats and Independents under 35 by approximately 11% points, offsetting his inferior performance among the rest of the electorate.
There is good reason to doubt that nominating Sanders would have increased voter turnout among young Democrats and Independents by this large amount. This 11% point increase would be significantly larger than the aggregate effects of entire presidential campaigns on voter turnout (Enos & Fowler, 2018), larger than the effects of nominating black candidates on black voter turnout (Washington, 2006), larger than the increase in black turnout when Barack Obama ran for President in 2008, 11 and approximately the size of the difference between typical midterm and presidential general election turnout. 12 In addition, turnout in the 2020 Democratic primary itself suggests that a turnout boost of this magnitude would have been fairly unlikely to materialize solely due to Sanders’ presence on the ballot: turnout in the 2020 Democratic primary did not exceed 2008 levels, including among young voters. 13
By contrast, it is plausible that a small number of Republicans and a meaningful number of independents would vote for a Democratic Presidential candidate: according to the 2020 CCES, approximately 5.4% of Republicans and 46.7% of Independents voted for Joe Biden for President (Schaffner et al., 2021).
Results From Attacks Treatment
As an additional robustness test, we present the results from the subset of our original data where we showed negative attacks against the Democratic candidate who each respondent was asked to choose between and Trump. As mentioned above, one limitation of our primary analyses is our original survey asks respondents to state how they would vote in a general election before the general election campaign began, and so when they are less informed about the Democratic challengers than they might be on election day in the general election. By supplying information about the Democratic challengers, we are able to help evaluate the robustness of our findings among more informed survey respondents.
In Figure 6, we show that even after survey respondents read negative attacks against the Democratic candidates, the three moderate candidates continue to have an electoral advantage after weighting to the demographics of a prior electorate. This finding holds across weighting strategies and survey rounds.
14
Estimated Effect of Nominating a Moderate Candidate by Weighting Decision in the Attacks Sample. Notes: Each coefficient is from a separate regression conducted using the weights at left. The regressions otherwise are identical to that shown in equation (2), except the coefficient is on an indicator for 1 for respondents shown one of the three moderate candidates and 0 for respondents shown either Sanders or Warren. 95% confidence intervals surround point estimates. The regression results from which the coefficients reported in this Figure are drawn are reported in Supplementary Tables A20–A22.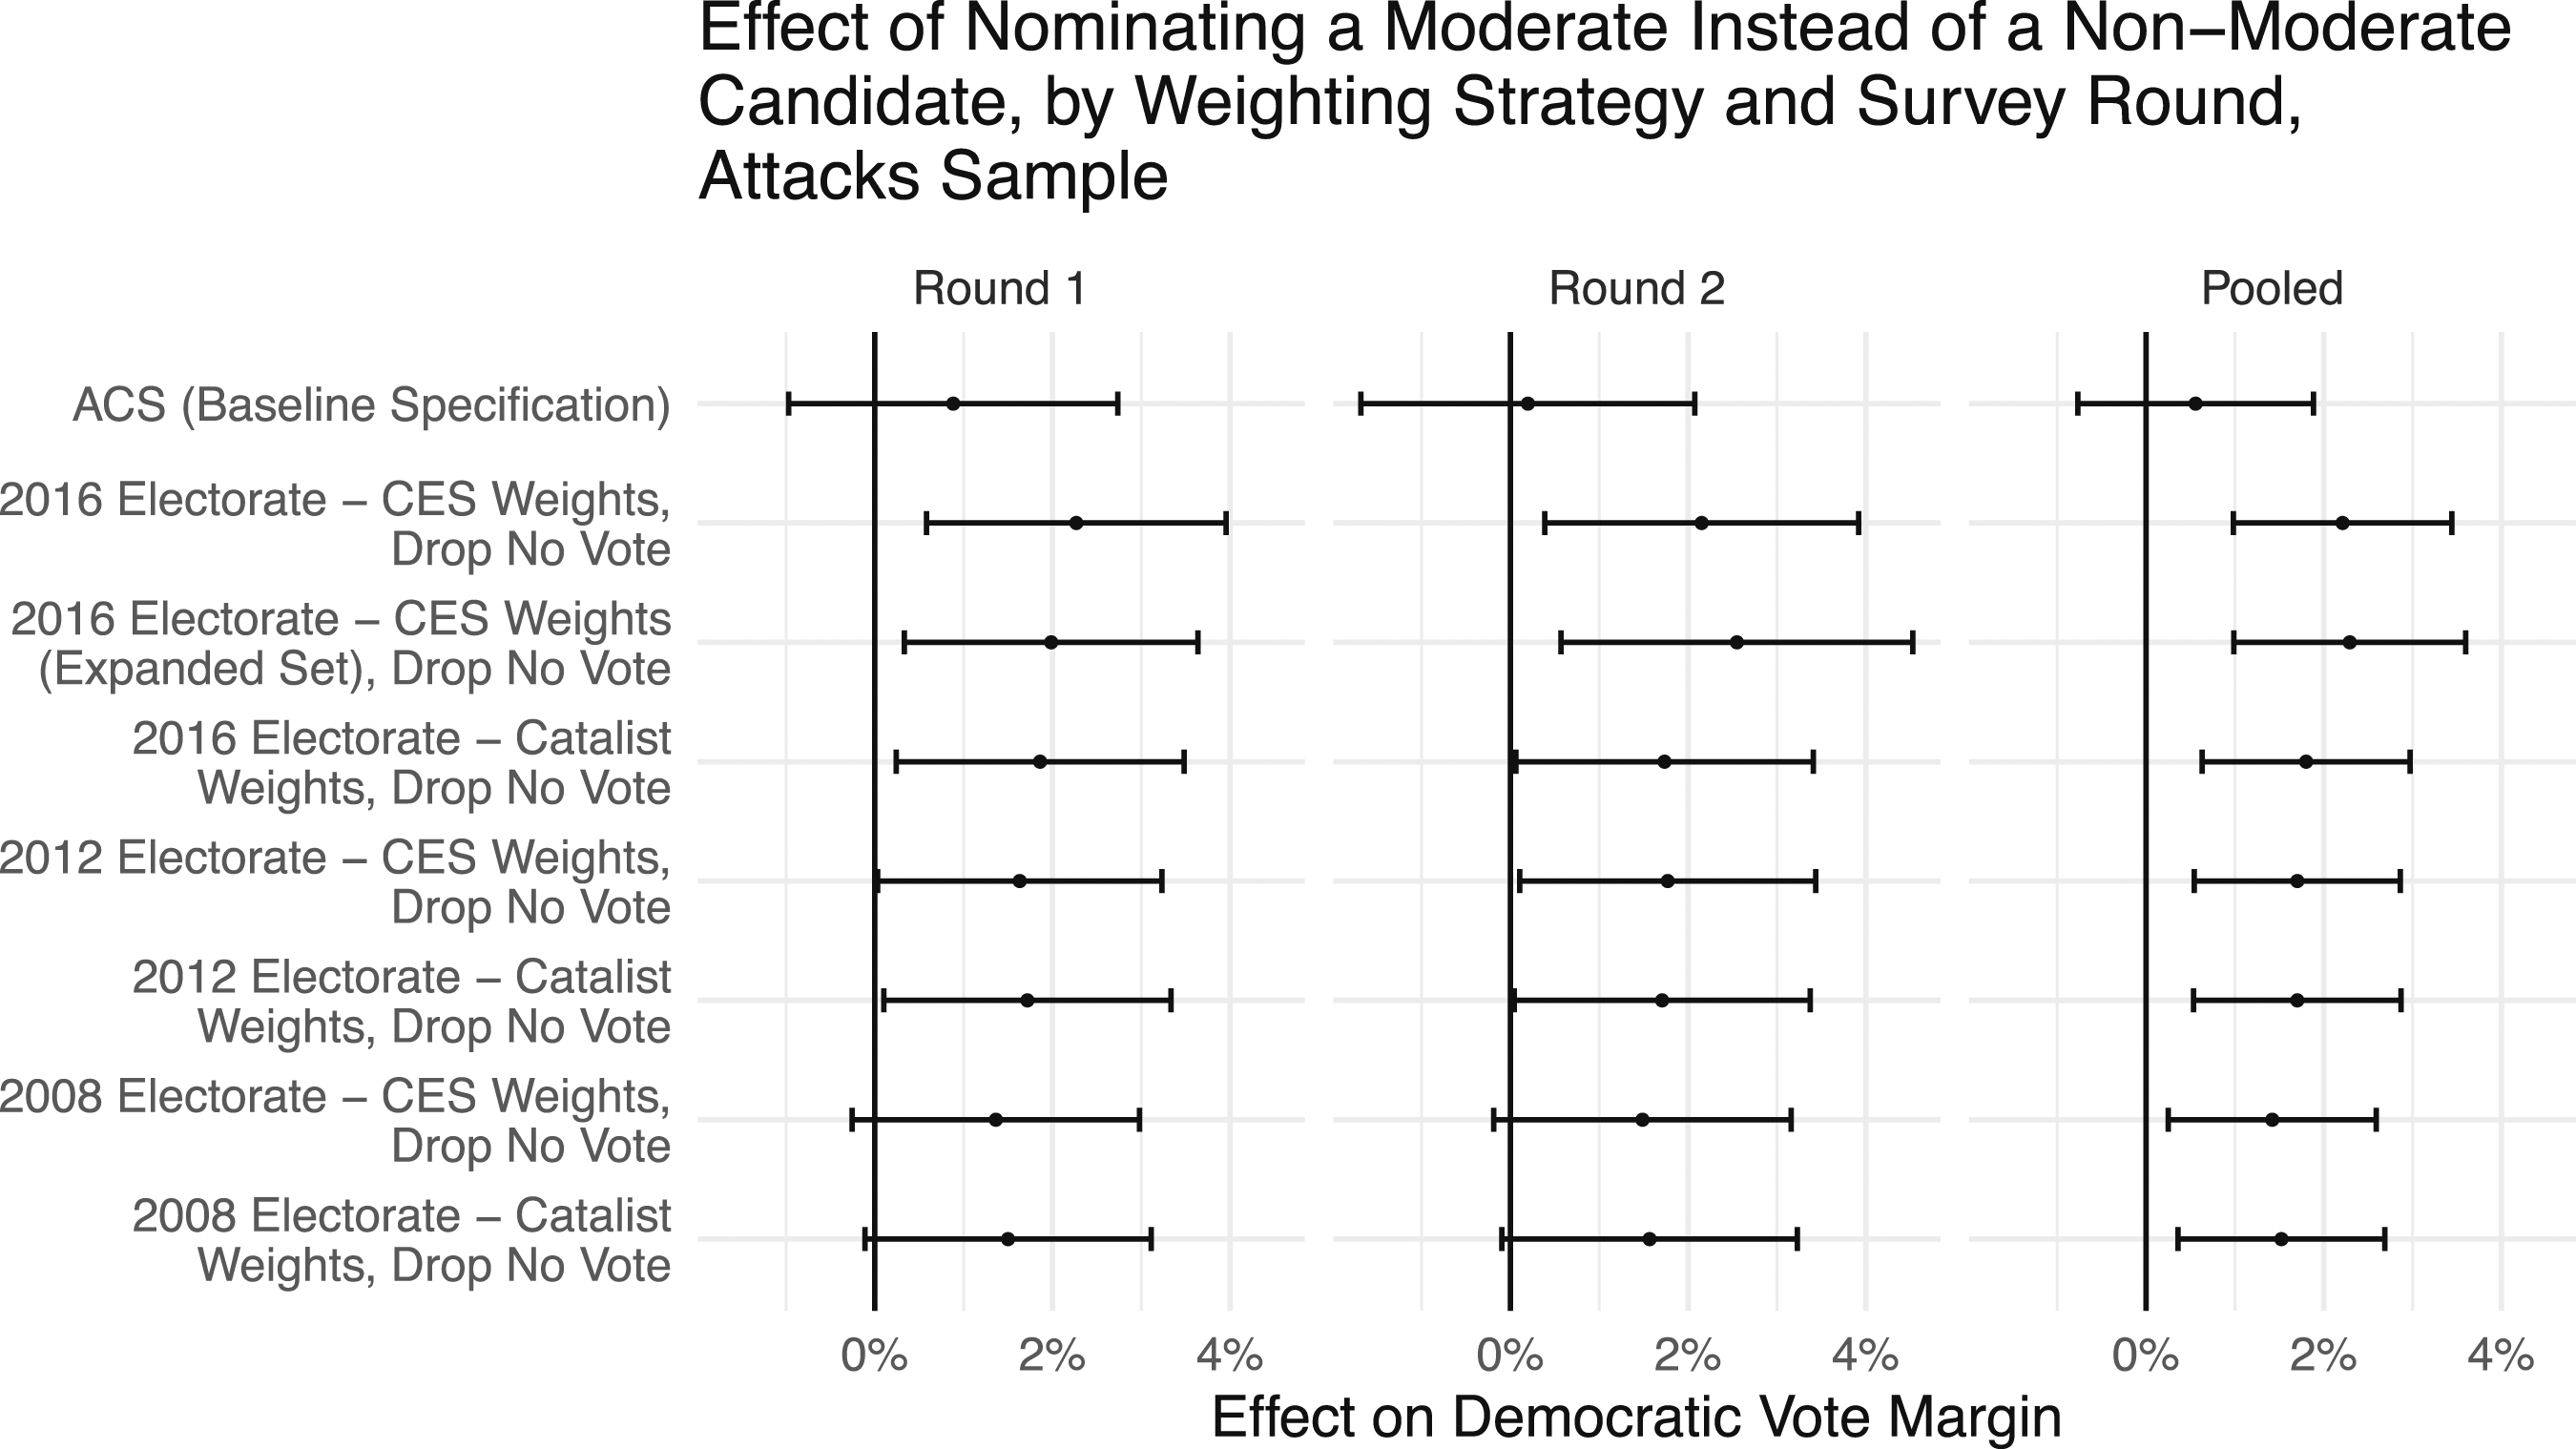
Discussion
A prominent perspective in the American politics literature argues that more moderate candidates perform better in general elections, but this perspective faces skepticism from a large literature that emphasizes voters’ partisan loyalties. In addition, previous empirical research on candidate ideology and voter choice in American politics has largely focused on legislative elections given the paucity of data in other election types. Much of this research has also faced the challenge that extreme and moderate candidates may run in different elections at different times, confounding comparisons across types of candidates. There is also somewhat limited data on whether changes in vote choice (i.e., persuasion) could contribute to any advantage moderate candidates have. To shed new light on the role of candidate ideology in American presidential elections, we exploit the unique circumstances of the 2020 Democratic primary: for a brief period, multiple candidates who were more moderate and more extreme could plausibly have won the same nomination to compete in the same general election; and, as we showed, voters largely recognized the ideological differences between them.
We presented data from both an original survey and an existing survey on how a large sample of voters said they would choose in a general election between one of these candidates and incumbent Donald Trump. Our findings were broadly consistent with expectations from the American politics literature that more moderate candidates should win more support in general elections than more extreme candidates. Incumbent Donald Trump received significantly more support from survey respondents asked to choose between Trump and an extreme Democrat than Trump and a moderate Democrat.
Our findings provide three main pieces of insight into the broader literature on candidate ideology in elections. First, our findings lend further support for a prominent perspective in the American politics literature that has argued moderate candidates perform better in general elections, and provide new evidence that this holds in the context of presidential elections. Second, our findings that outpartisans (in this case, Republicans) drove this advantage by crossing party lines to say they would support an outpartisan moderate candidate (in this case, a Democrat) but not an extreme candidate are inconsistent with claims in the literature that partisan loyalties completely override voters’ concerns with candidates’ policy positions (for review and critique, see Fowler, 2020). Third, this same finding suggests that, at least in presidential elections, moderate candidates’ advantages may arise in part from a persuasion or vote-switching mechanism. The existing literature on candidate ideology in elections has generally relied on actual election returns which, while having many advantages, make it difficult to determine whether changes in turnout or persuasion are responsible for moderate candidates’ electoral advantages (for general discussion, see Hill et al., 2021). While Hall and Thompson (2018) find that turnout patterns best explain this electoral penalty in congressional races, their standard errors are large enough that small but significant persuasion effects would be hard to detect. In the case of the 2020 presidential election, we find evidence for a persuasion or vote-switching mechanism: a small, but electorally consequential percentage of Republican voters indicated they would vote for Trump against a more extreme Democratic candidate but that they would otherwise vote for a more moderate Democrat. In summary, both a turnout (per Hall and Thompson, 2018) and a persuasion mechanism might operate in granting moderates an electoral advantage.
With this said, we again hasten to re-emphasize the caveats and limitations we noted at the outset, especially that our evidence comes from only one set of candidates in one election, is survey-based in nature and so could be affected by expressive or strategic responding, and is not well-suited to capturing equilibrium effects.
Our data also cannot speak to why ideologically moderate candidates may be more successful at persuading outpartisans to vote for them than ideologically extreme candidates—i.e., the mechanisms underpinning many voters’ preferences for them. We encourage future work to explore how and to what extent policy positions, fundraising, media coverage, candidate quality, and other factors might explain the electoral penalty we find here. For instance, future research should explore to what extent knowledge of candidate ideology conditions the results we found, which we would expect to find if the results were due to voter knowledge of candidate ideology. Unfortunately only a small part of our sample was directly asked about candidate ideology, so we were unable to test this. When parties do nominate ideologically extreme nominees, it would also be helpful to examine whether cross-partisan voting declines, as our results suggest it would.
We close by considering the substantive significance of our estimates. The effect size we observed was small in absolute terms and would be difficult to detect in typically sized surveys. But an effect this small would be enormously consequential in competitive elections. For example, in the 2020 US presidential election, the states of Georgia, Wisconsin, and Arizona were all ultimately decided by less than .63 percentage points on vote margin. If these three states had voted for Donald Trump, which would have required only 1 in 300 voters in these states to change their vote, he would have been re-elected in 2020. It is of course impossible to know whether our estimate that approximately 2% of Republicans would have voted for Trump were Sanders the Democratic nominee would generalize to actual voting behavior in the 2020 US presidential election. However, if even one-half of these 2% of Republicans actually would have engaged in this behavior, all else equal Sanders’ nomination could have resulted in Trump’s re-election.
Supplemental Material
Supplemental Material - Candidate Ideology and Vote Choice in the 2020 US Presidential Election
Supplemental Material for Candidate Ideology and Vote Choice in the 2020 US Presidential Election by David Broockman and Joshua L. Kalla in American Politics Research
Footnotes
Declaration of Conflicting Interests
The authors disclose that they have previously made personal contributions to the presidential campaigns of Sanders, Warren, Buttigieg, Klobuchar, and Castro. The authors declare no further potential conflicts of interest with respect to research, authorship, and/or publication of this article.
Funding
The author(s) disclosed receipt of the following financial support for the research, authorship, and/or publication of this article: The work was supported by the Silicon Valley Community Foundation.
Supplemental Material
Supplemental material for this article is available online.
Notes
References
Supplementary Material
Please find the following supplemental material available below.
For Open Access articles published under a Creative Commons License, all supplemental material carries the same license as the article it is associated with.
For non-Open Access articles published, all supplemental material carries a non-exclusive license, and permission requests for re-use of supplemental material or any part of supplemental material shall be sent directly to the copyright owner as specified in the copyright notice associated with the article.