
Abstract
To date, the Mars 2020 mission’s deep-UV Raman and fluorescence instrument (Scanning Habitable Environments with Raman and Luminescence for Organics and Chemicals [SHERLOC]) has reported potential Raman detections of macromolecular carbon in data collected on the floor of Jezero crater and in Neretva Vallis, a valley incised through the Jezero crater rim and Margin Unit. The crater floor detection is associated with a collocated fluorescence signal that has been interpreted to indicate the presence of small aromatic molecules and/or cerium-bearing phosphates. Previous work has demonstrated that the potential macromolecular carbon detection is similar to data collected from abiotic macromolecular carbon in a martian meteorite. The work described here was performed to support the interpretation of this and any future possible SHERLOC macromolecular carbon detections by comparing the possible G-band to biologically produced macromolecular carbon (kerogen). We report the results of collocated, in situ deep UV Raman and fluorescence measurements of kerogen preserved within Neoarchean and Eocene carbonate microbialites collected with a SHERLOC analog instrument. Our results support the conclusion that SHERLOC has detected macromolecular carbon in Jezero crater that may be of an abiotic or biological origin and suggest that a carbonate mineral may be the source of the collocated fluorescence signal. These findings reinforce the possibility that samples collected during the Mars 2020 mission may hold compelling evidence of ancient microbial life on Mars and the importance of delivering the samples to Earth for laboratory analysis to determine whether the material is biological in origin.
Introduction
NASA’s ongoing Mars 2020 mission seeks evidence of ancient microbial life in Jezero crater, Mars. Jezero crater is 45 km in diameter and contains a sequence of fluvio-lacustrine rocks deposited in an open system lake during Mars’ Noachian period (≈ 4.1 to 3.7 billion years ago), when the planet supported liquid surface water. It was chosen as the site of the Mars 2020 mission for both its history as a potentially habitable paleolake environment and the sedimentary deposits within it. Jezero crater’s sedimentary sequences include fine-grained lacustrine sediments and carbonate-bearing rocks. These rock types have a high potential to preserve both morphological biosignatures, in the form of microbially influenced structures and/or textures, and chemical biosignatures, in the form of organic molecules and/or microbially influenced, induced, or controlled minerals (Farley et al., 2020 and references therein).
Perseverance, the Mars 2020 mission rover, carries a suite of seven science instruments for experimentation, environmental characterization, and the detection of potential biosignatures (Farley et al., 2020). The instrument suite includes the Scanning Habitable Environments with Raman and Luminescence for Organics and Chemicals (SHERLOC) instrument, which generates spatially resolved chemical maps using Raman and fluorescence spectroscopy coupled to microscopic imaging (Bhartia et al., 2021). These capabilities give SHERLOC the potential to identify in situ collocated morphological and potential chemical biosignatures.
SHERLOC uses a deep UV (248.6 nm; DUV) excitation laser, which makes the instrument particularly well-suited for detecting polycyclic organic molecules for two reasons. First, DUV laser excitation naturally separates the Raman spectral emission region from the fluorescence spectral emission region of aromatics, which allows for the simultaneous acquisition and interpretation of Raman scattered photons and fluorescence emissions from organic molecules (Asher and Johnson, 1984). Second, resonance Raman effects, which occur when the transition energy of vibrational modes within a sample material match that of the excitation laser, enhance the intensity of polycyclic aromatic hydrocarbon Raman signals under DUV laser excitation (Asher, 1984). As a result of the spectral separation and resonance effect, DUV laser excitation enables the detection and speciation of trace quantities of simple polycyclic aromatic hydrocarbons, including naphthalene, phenanthrene, and anthracene, as well as pyrene and simple heterocyclic compounds, such as indole and tryptophan, via combined Raman and fluorescence spectroscopy (Asher, 1984; Bhartia et al., 2008, 2012).
However, in the search for collocated morphological and chemical evidence of ancient microbial life in Jezero crater, the organic chemical biosignature most likely to be encountered is fossilized organic matter, or kerogen, as occurs in ancient sedimentary deposits that host evidence of ancient life on Earth (e.g., Schopf et al., 2005). Kerogen is a form of insoluble amorphous macromolecular carbon (MMC) matter that forms when biological material is subjected to heat and pressure due to burial in sedimentary deposits (Durand, 1980). It is important to note that kerogen is spectrally indistinguishable from MMC of abiotic origin, including that which occurs in interplanetary dust particles and martian meteorites (e.g., Hochleitner et al., 2004; Steele et al., 2007). Therefore, additional lines of evidence, such as morphological or isotopic data, are necessary before any potential MMC detection can be considered a potential biosignature (e.g., Meadows et al., 2022; Pasteris and Wopenka, 2003).
The Raman spectrum of MMC, whether abiotic or kerogen, consists of a G (graphitic) band, which originates from all C-C vibrations within the material, and a D (disordered) band, which originates from the breathing mode of sixfold aromatic rings in disordered material (Ferrari and Robertson, 2000). The G-band present in MMC Raman spectra results from energy transfer in PAH bonds and is therefore subject to the DUV resonance Raman effect referenced above. During MMC metamorphism, heteroatoms (such as O, H, N) are lost from the original molecules, and the carbon becomes increasingly ordered in a process of paired graphitization and devolatilization (e.g., Beyssac et al., 2002).
To date, potential G-band detections have been reported in SHERLOC’s measurements on the floor of Jezero crater (Corpolongo et al., 2023; Jakubek et al., 2025; Sharma et al., 2023) and in Neretva Vallis, a valley incised through the Jezero crater rim and Margin Unit (Hurowitz et al., 2025). Previous work has demonstrated that the potential G-band detected on the floor of Jezero crater is similar to the G-band present in SHERLOC data collected from the martian meteorite Sayh al Uhaymir (SaU008) calibration target (Sharma et al., 2023), although it may also be consistent with G-bands in DUV Raman spectra collected from ancient kerogen. To successfully interpret these and future potential SHERLOC G-band detections, it is essential to amass a collection of DUV Raman and fluorescence reference spectra collected from in situ MMC preserved in Jezero crater relevant host rocks. Toward this goal, previous workers have reported the results of DUV Raman measurements made with a 244 nm excitation laser on kerogen preserved in silicified stromatolites from 14 different geological units (Osterhout et al., 2022), on collocated Raman and fluorescence measurements made with a 266 nm excitation laser on kerogen preserved within a range of sedimentary matrices (Shkolyar et al., 2018), and on collocated Raman and fluorescence measurements made on microbial mats composed of kerogen and preserved in cryptocrystalline quartz from the 3.42 Ga Buck Reef Chert bed (Barberton Greenstone Belt, South Africa) with the SHERLOC brassboard instrument housed at the NASA Jet Propulsion Laboratory (Hickman-Lewis et al., 2022). This article adds to those efforts by reporting the results of collocated, in situ DUV Raman and fluorescence measurements of kerogen preserved within Neoarchean and Eocene carbonate microbialites collected with a SHERLOC analog instrument, the Analog Complementary Raman for Operations oN Mars (ACRONM), housed at NASA’s Johnson Space Center.
Microbialites are organosedimentary deposits formed via interactions between microbial communities and detrital or chemical sediments (Burne and Moore, 1987). They are the primary source of collocated morphological and chemical evidence of Earth’s earliest microbial life (e.g., Allwood et al., 2006; Djokic et al., 2017; Hickman-Lewis et al., 2020; Homann, 2019; Lepot, 2020; Noffke et al., 2013; Schopf, 2006). If microbial life ever existed in Jezero crater, it may have contributed to the formation of similar organosedimentary deposits (Farley et al., 2020).
Materials and Methods
We used transmitted light microscopy and visible Raman spectroscopy for microbialite characterization along with DUV Raman and fluorescence spectroscopy for the collection of SHERLOC analog data. The visible Raman, DUV Raman, and DUV fluorescence measurements made at each analysis spot indicated in Figure 1 were approximately collocated but were not collected simultaneously because the instruments did not allow for simultaneous data collection. We targeted the same surface features for each collocated measurement, but the differences in beam type and spot size between the visible and DUV excitation lasers (the visible laser is a 1 to 2 µm spot and the DUV laser is a 50 µm annulus, as described below) made it impossible to collect data from exactly the same sampling volume. We minimized the impact of this variation by targeting features of homogeneous color and texture of at least 50 µm for measurement.
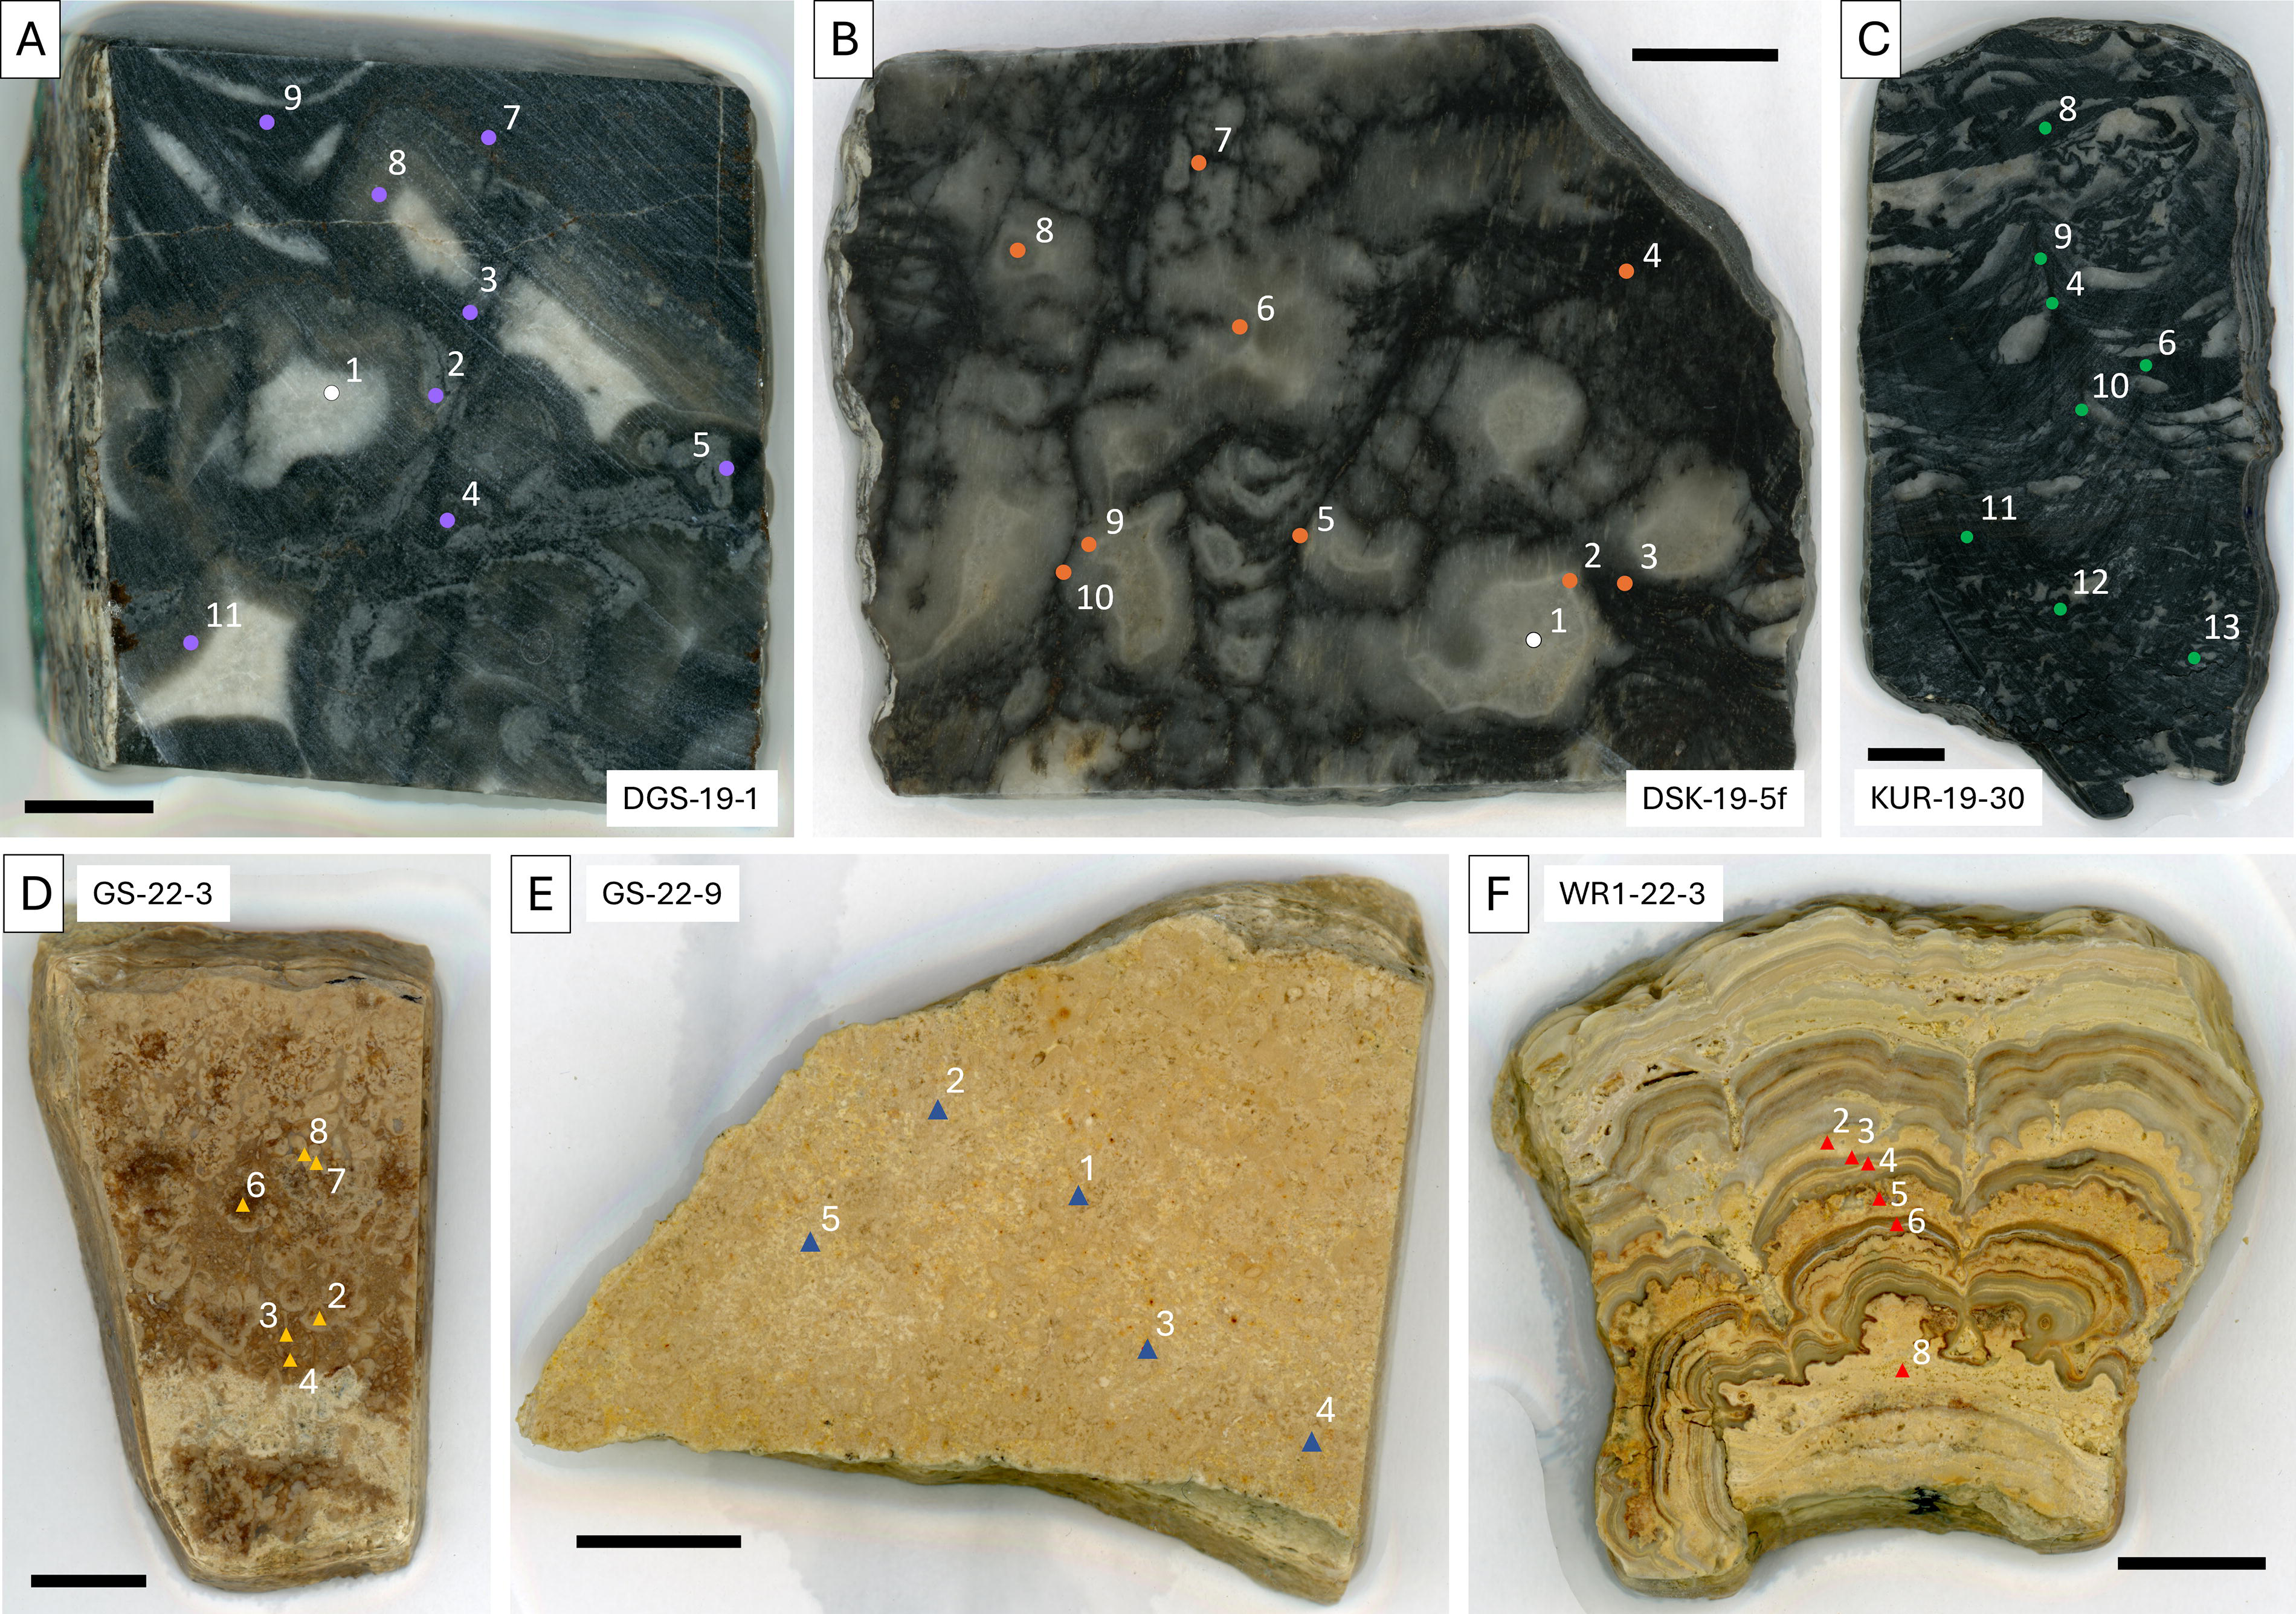
Images of the billets that were analyzed in this study, with analysis spots indicated.
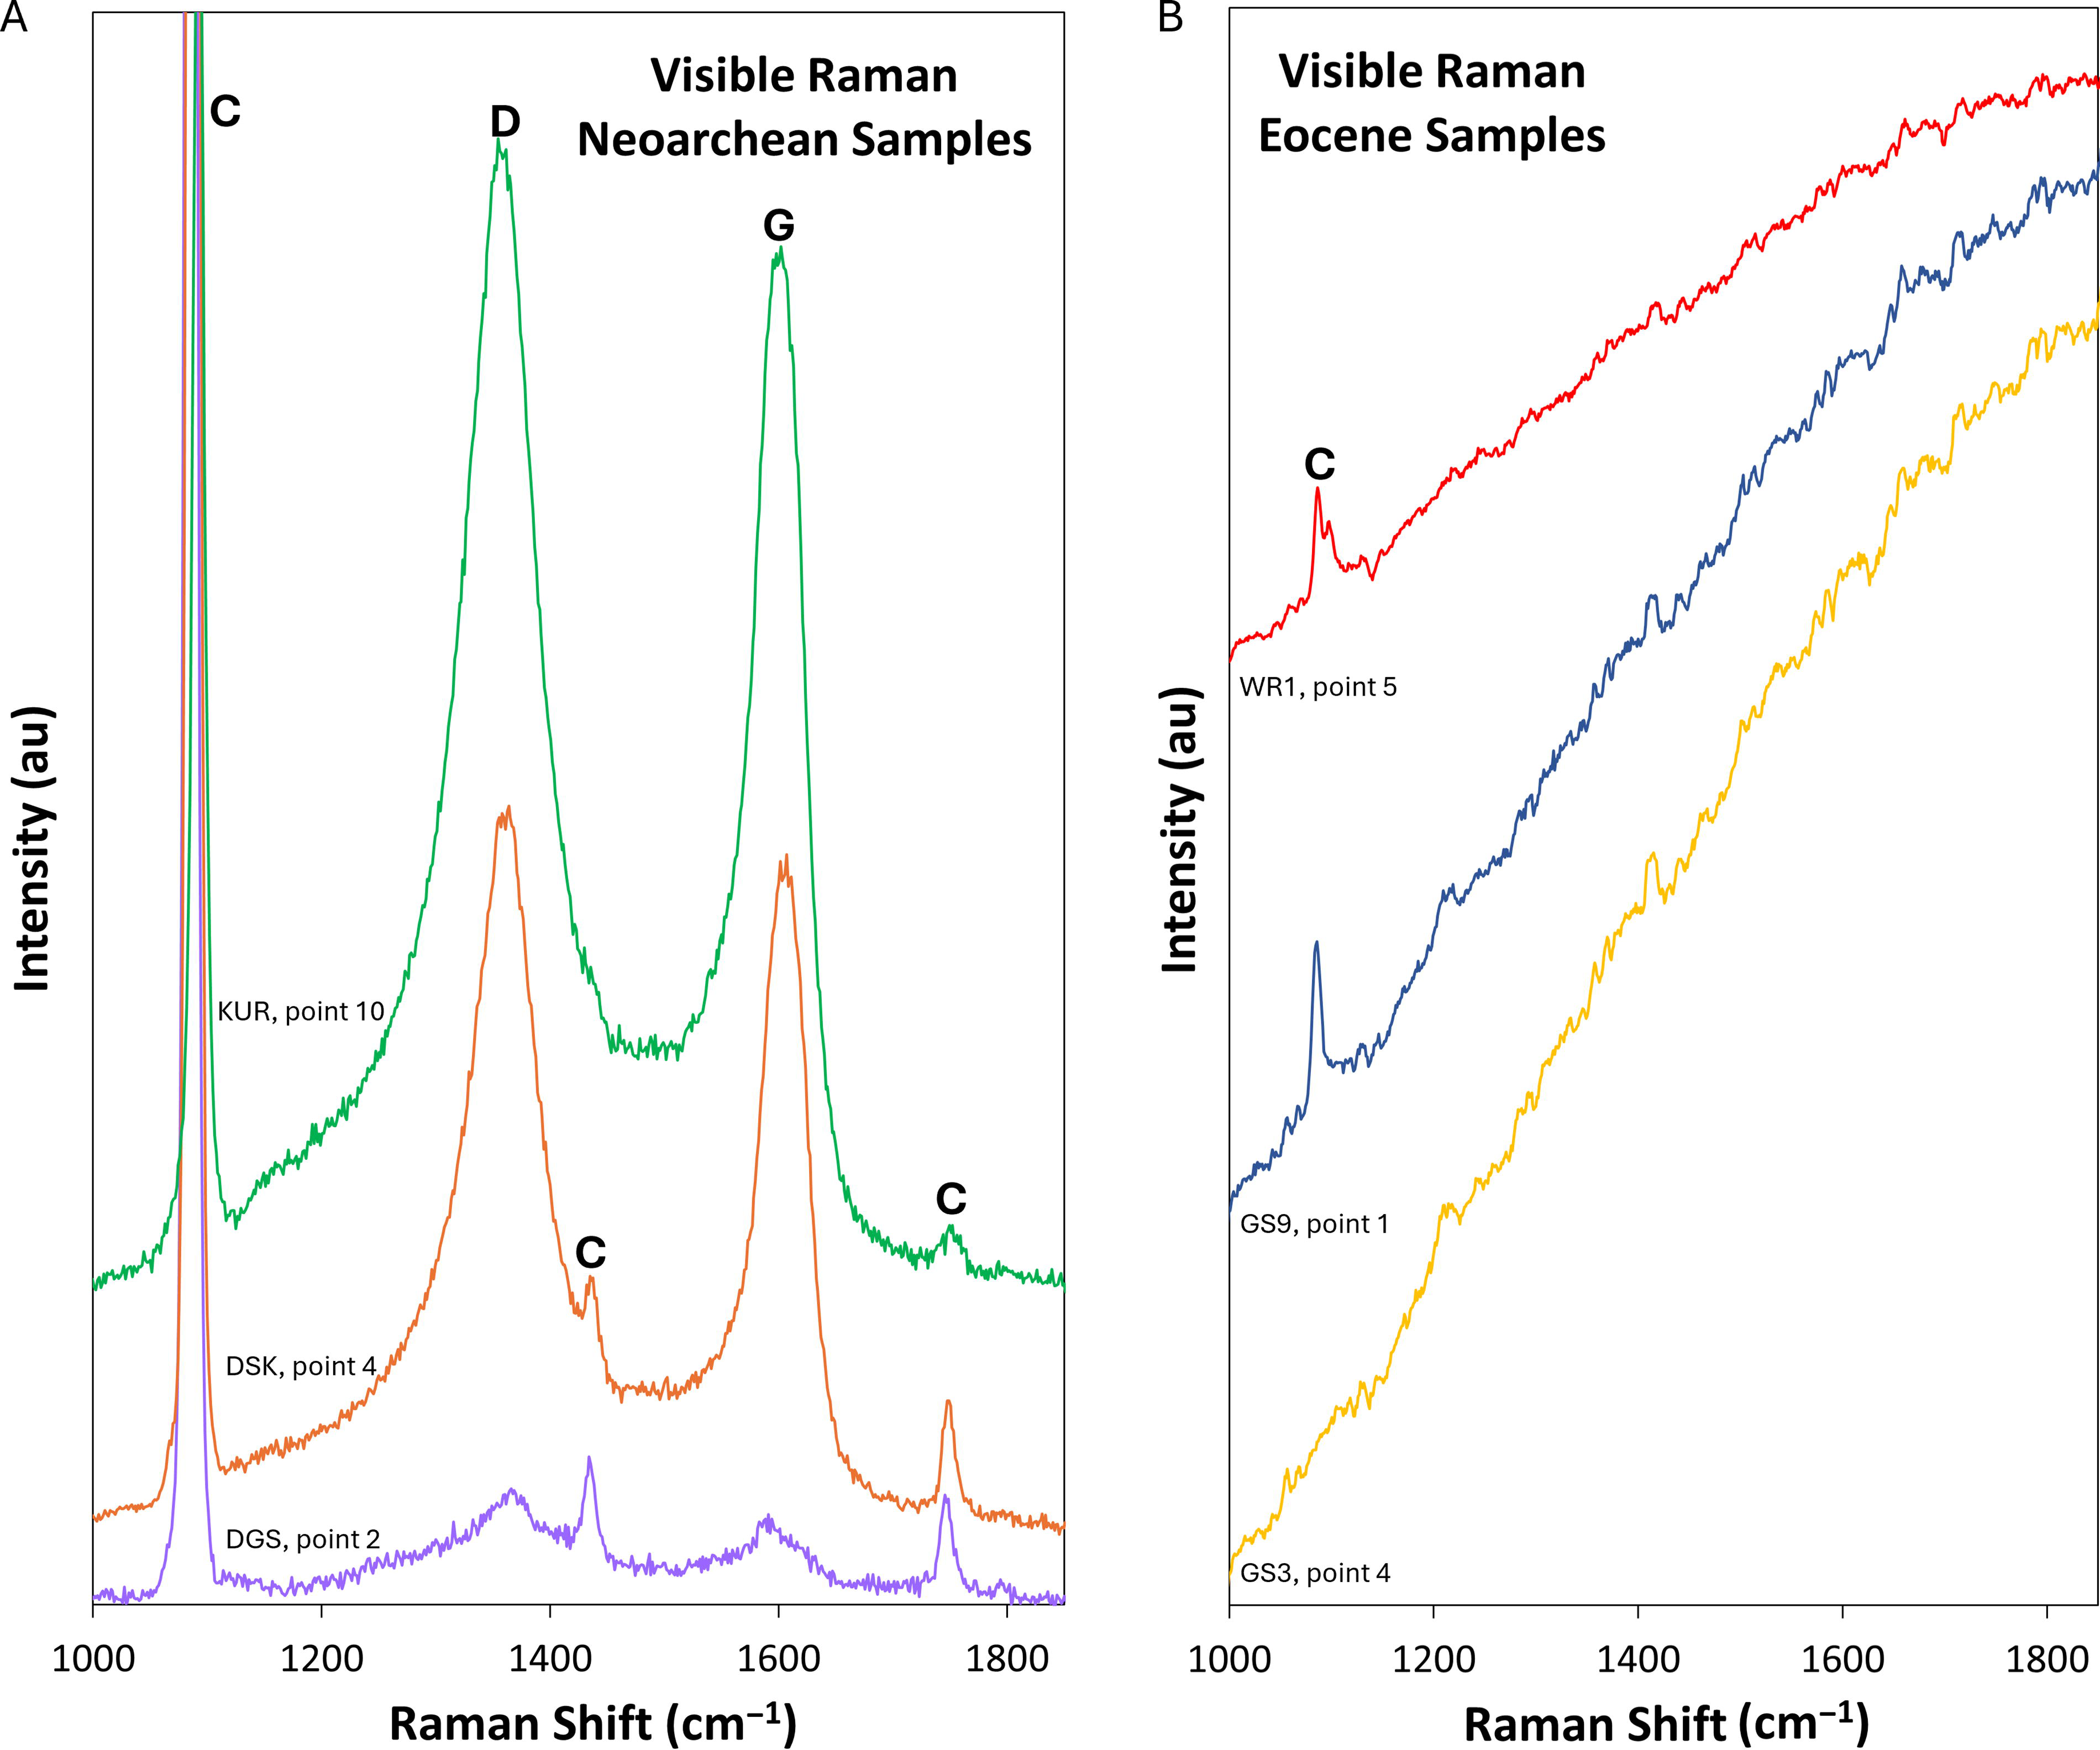
Representative visible Raman spectra. Colors correspond to those of the symbols in Figure 1.
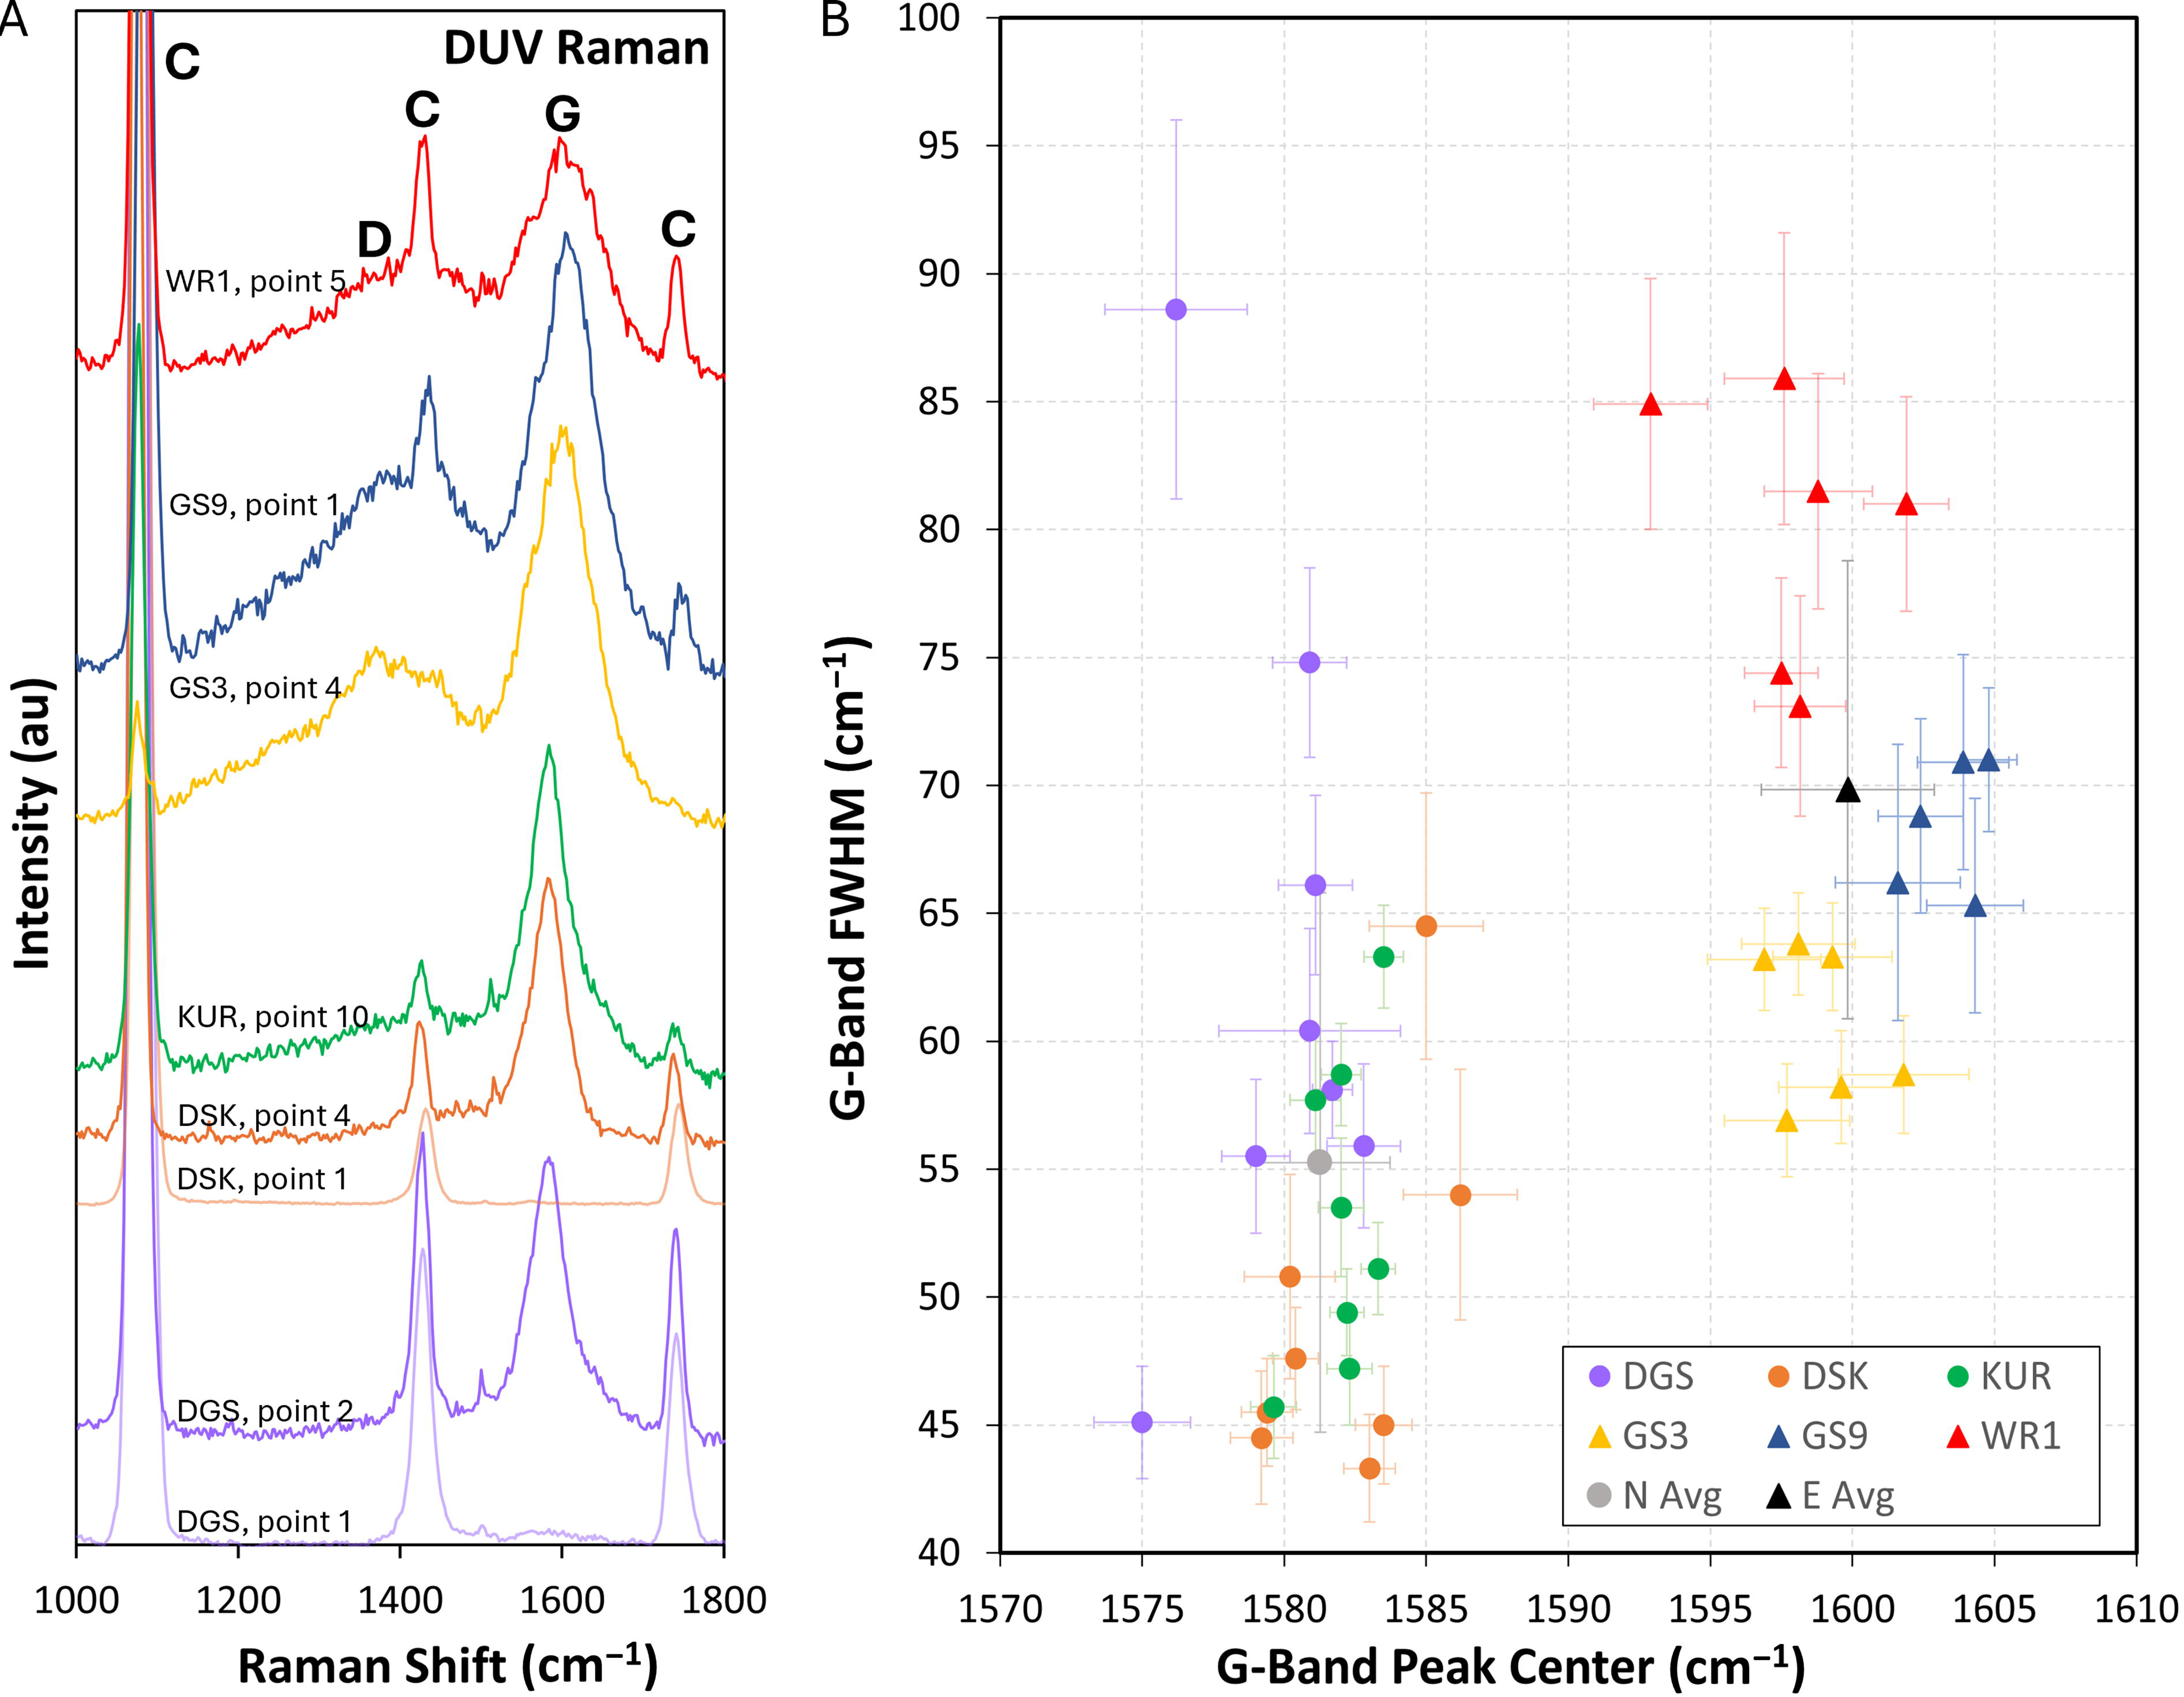
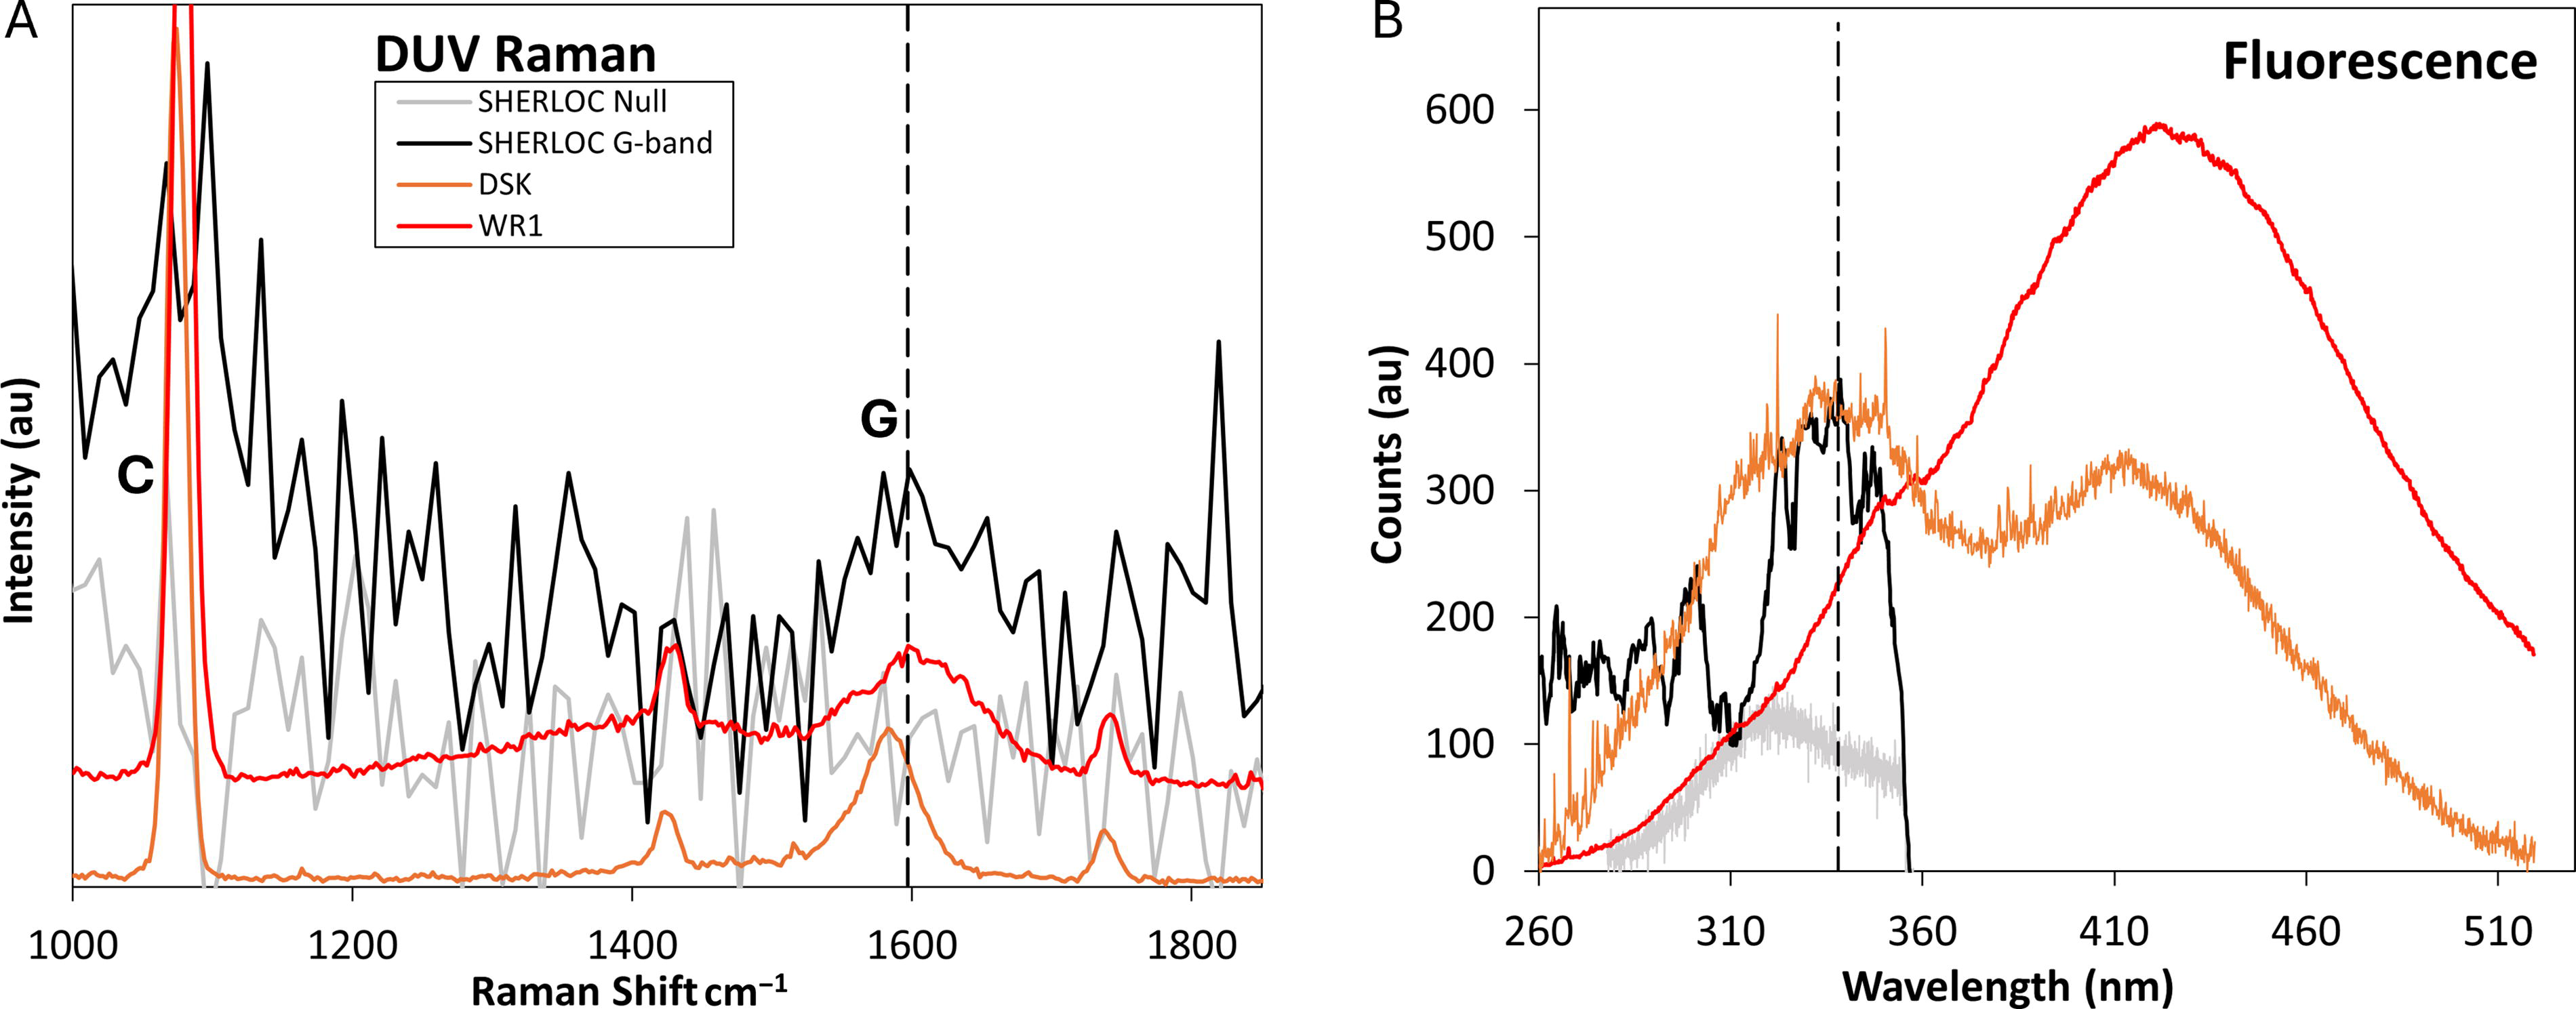
DUV Raman results. Colors correspond to those of the symbols in Figure 1.
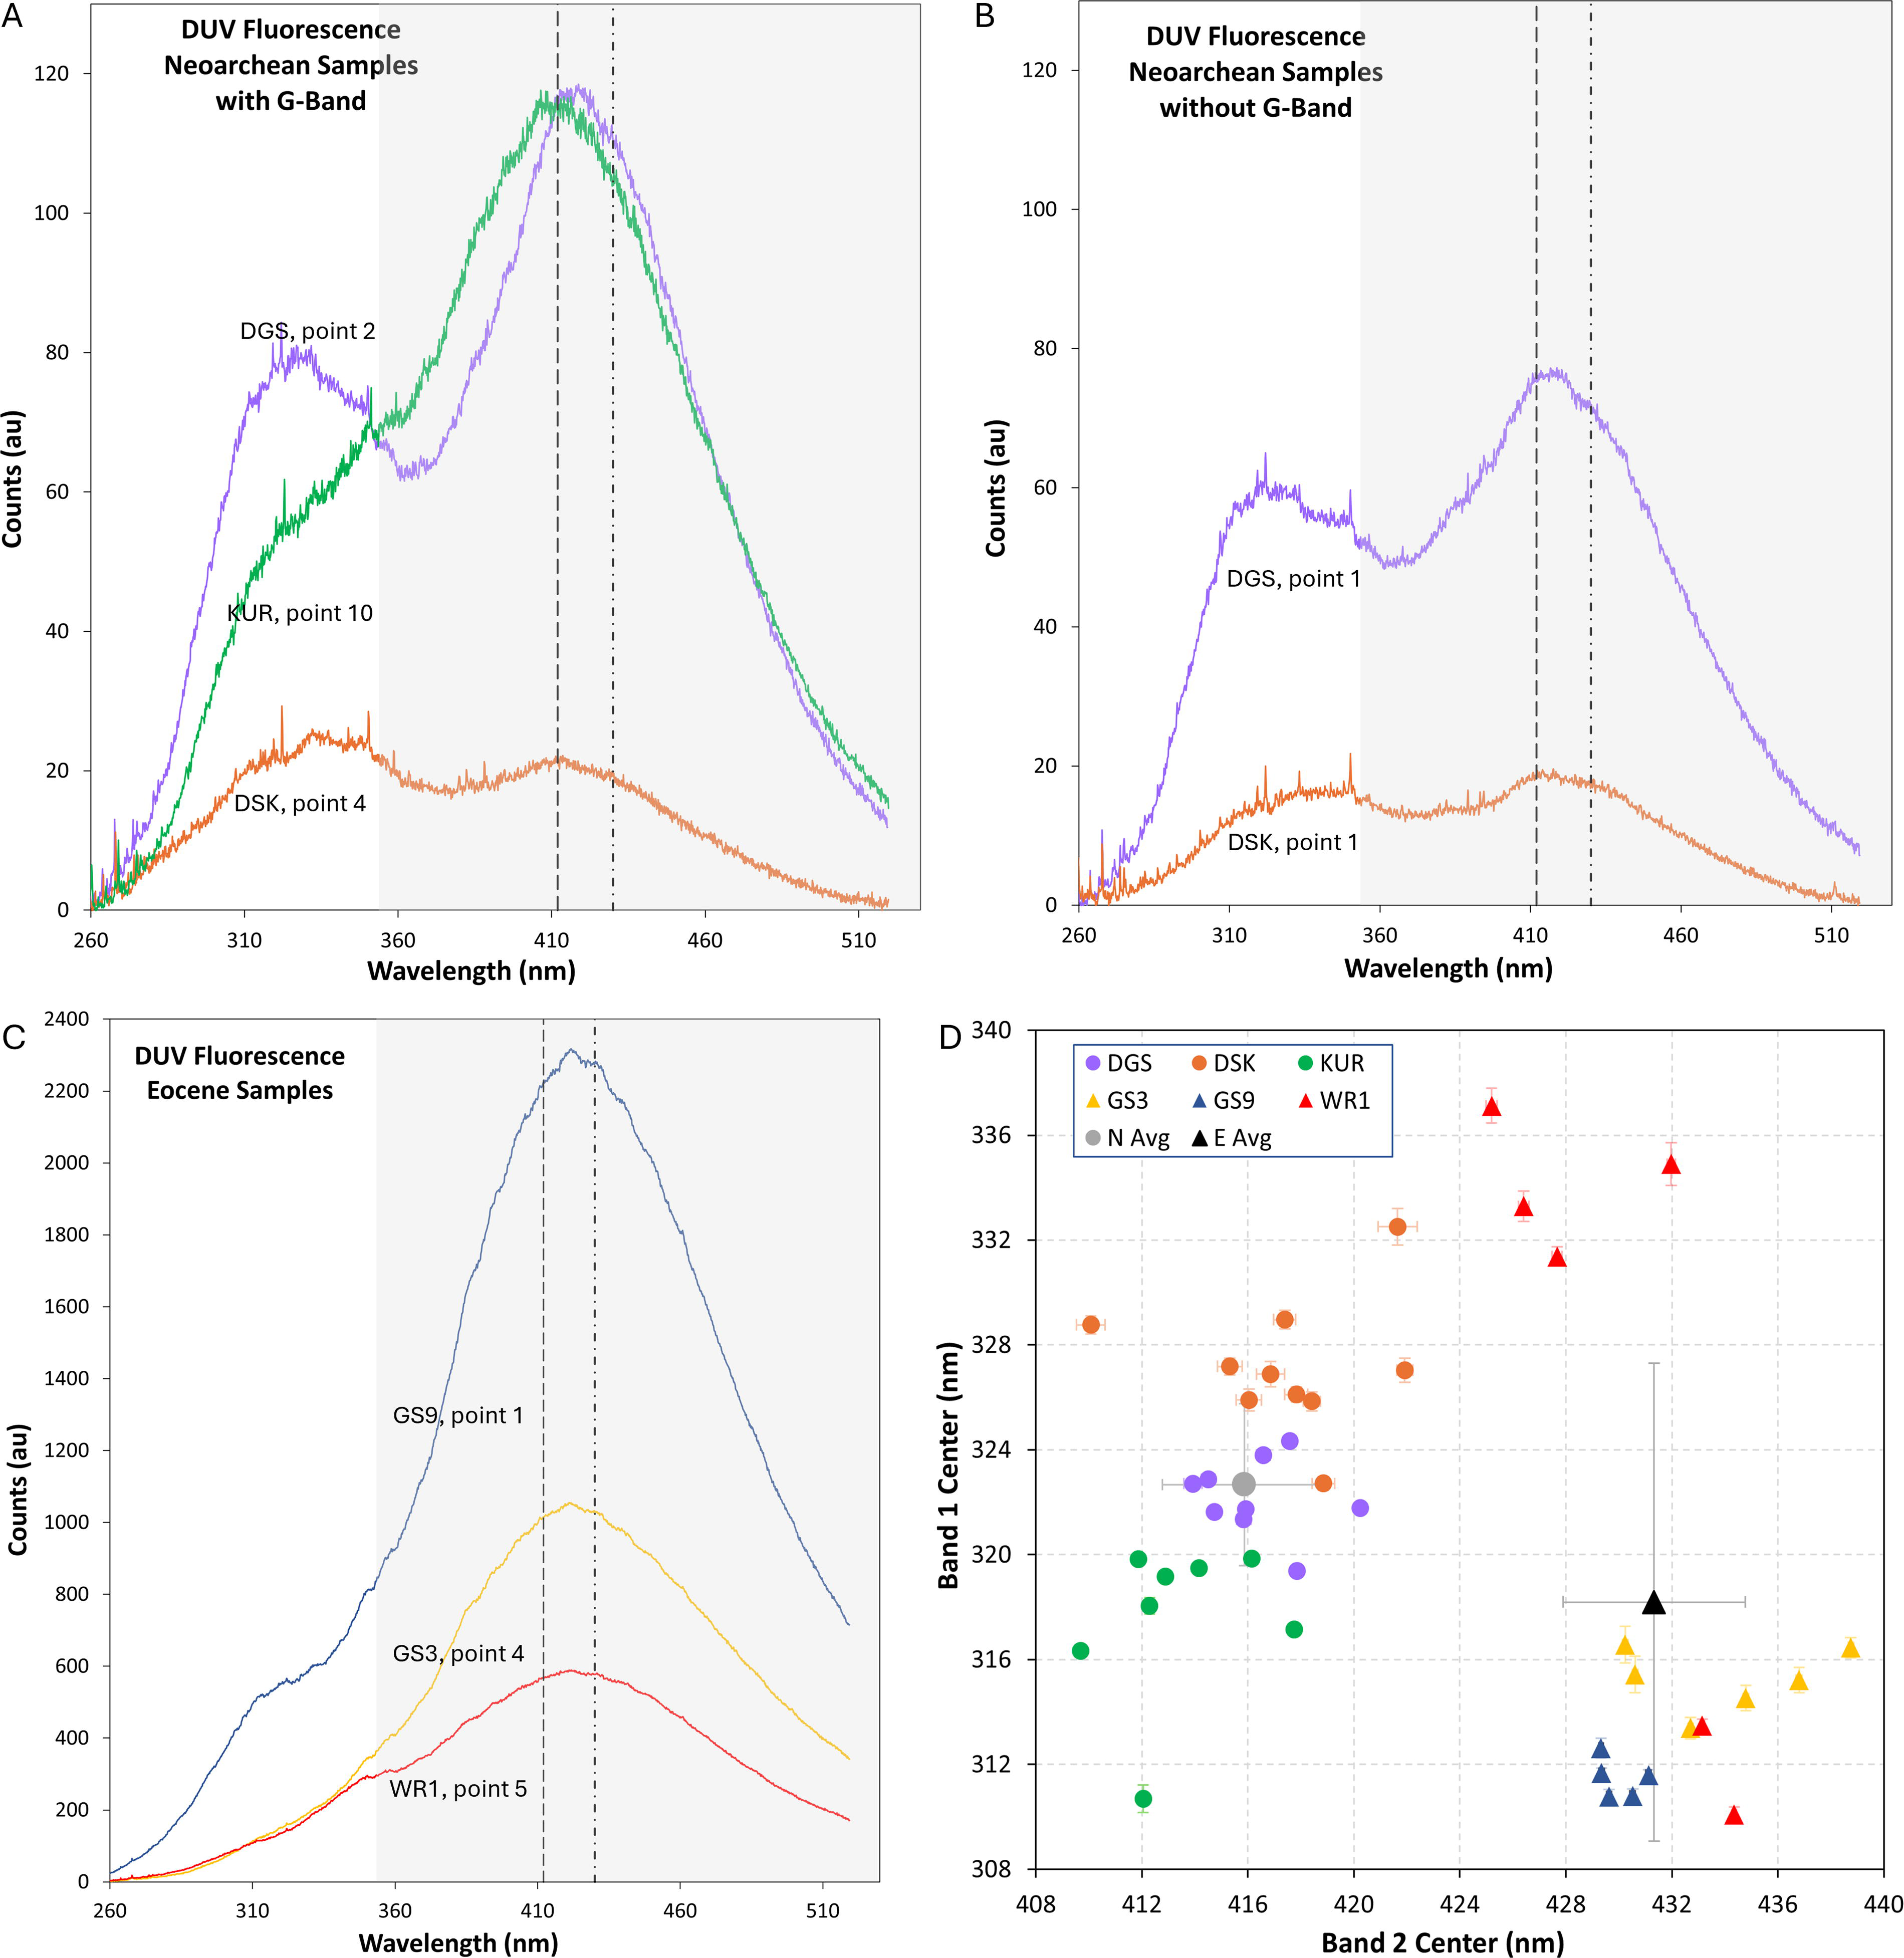
DUV fluorescence results.
Raman and fluorescence spectra collected at point 40 of the Sol 349 High Dynamic Range (HDR) scan of the Montpezat abrasion patch on the floor of Jezero Crater with comparisons to ACRONM data collected in this study.
For this study, we selected two sets of microbialites that contain MMC of biological origin (kerogen) to compare with the ancient lacustrine deposits in Jezero crater. We selected a set of Neoarchean microbialites, which are of a similar age to the sedimentary deposits in Jezero crater, in that they are billions rather than millions of years old, and formed in a marine environment, and Eocene microbialites, which are much younger than the Jezero crater deposits that formed in a lacustrine environment.
Neoarchean samples were collected from outcrops of fenestrate microbialite facies of the 2.5 Ga Gamohaan Formation of the Campbellrand–Malmani carbonate platform (Transvaal Supergroup, South Africa). The fenestrate microbialites are organosedimentary carbonates exhibiting three-dimensionally preserved kerogen-rich structures that are interpreted as the remains of photosynthetic and/or chemosynthetic microbial communities (Fig. 1A–C; Beukes et al., 1990; Sumner, 1997). The Gamohaan fenestrate microbialites differ from other types of microbialites because they were formed by morphologically distinct microbial communities that affected carbonate nucleation differently and often feature prominent carbonate lenses that can appear window-like (see the white and light gray lenses in Fig. 1A–C; Sumner, 1997). The well-preserved complex microbial community structures along with the lack of cross-bedding and stratigraphic setting of the facies in which the fenestrate microbialites occur indicate that they formed in deep subtidal environments (Sumner, 1997; Sumner and Beukes, 2006; Sumner and Grotzinger, 2004). We collected fenestrate microbialite samples from three different localities. Sample DGS-19-1 (−29.084081°, 23.548017°) was collected from a roadside outcrop near the town of Douglas. Sample DSK-19-5f (−28.1041°, 23.57114°) was collected at a farm near the town of Danielskuil. Sample KUR-19-30 (−27.382917°, 23.344233°) was collected at Ga-Mohana Hill (formerly Kuruman Kop) near the town of Kuruman.
Eocene samples were collected from outcrops of microbialite facies of the LaClede Bed of the 49 Ma Laney Member of the Green River Formation (Greater Green River Basin, USA) at two different localities. We collected samples GS-22-3 (40.775267°, −108.653867°) and GS-22-9 (40.77625°, −108.654283°) from meter-scale columnar lacustrine stromatolites that occur in the southernmost subbasin of the Greater Green River Basin known as the Sand Wash Basin. These samples feature microdigitate stromatolites with peloidal infill (Supplementary Fig. S1C, D), which commonly occur as layers within the massive stromatolites of the LaClede Bed (Awramik and Buchheim, 2015; Ingalls et al., 2022). Sample WR1-22-3 (41.89415°, −109.264317°) was collected from a marginal lacustrine microbialite sequence that occurs on the northwest margin of the Rock Springs Uplift. This sample features a deposit of biogenic detritus, including algal cysts and ostracod carapaces (Supplementary Fig. S1F), both of which occur widely in the Green River Formation (e.g., Kuma et al., 2019; Seard et al., 2013), overlain by millimeter-scale domal stromatolites (Fig. 1F).
Sample preparation
For Raman and fluorescence spectroscopy, we cut samples into billets using a water-cooled, diamond blade rock saw. We made measurements on billets without further sample processing to simulate the abraded surfaces analyzed by the SHERLOC instrument in Jezero crater, Mars. For transmitted light microscopy, which was performed to establish the biogenicity of the samples, we prepared standard polished thin sections using material from the same hand samples from which the billets were cut.
Sample imaging
We used an Olympus BX60 microscope to study thin sections coated with a thin layer of Olympus type F low-fluorescence immersion oil. We acquired photomicrographs with a microscope-mounted Olympus SC50 digital camera. We processed the photomicrographs, including image cropping and contrast enhancement, using Olympus cellSensTM standard image processing software (version 3.17) and PhotoScapeTM image editing software (version 3.7). These photomicrographs feature representative examples of the biological structures within the samples (Supplementary Fig. S1) and are not images of the specific structures that we analyzed within the billets. To create reference images of the billet surfaces (Fig. 1), we scanned the cut surfaces of each sawn billet at 3200 dpi resolution with an Epson Perfection V600 Photo flatbed scanner.
Visible Raman spectroscopy
We collected visible Raman spectra with a Horiba T64000 Raman microscope and 457.9 nm laser excitation from a Coherent FreD 90C Ar+ laser with a spot size of approximately 1 to 2 µm and a laser power at the sample of 9 mW. We collected spectra using a 50× long working distance objective (NA = 0.50), a 600 g/mm diffraction grating to provide a ∼128 to 2900 cm−1 spectral window at a resolution of ∼1.5 cm−1 between successive spectra points, and a Horiba Symphony II liquid nitrogen cooled (−133°C) Charge Coupled Device detector. To determine whether any sample damage may have occurred during data collection, we visually inspected each point under the 50× objective before and after data collection and monitored data acquisition for spectral evidence of kerogenization throughout the measurement. We did not observe any visual or spectral evidence of sample damage.
DUV Raman and fluorescence spectroscopy
We collected DUV Raman and fluorescence measurements with the ACRONM instrument at NASA’s Johnson Space Center in Houston, TX. ACRONM is a SHERLOC analog instrument built according to the specifications of MOBIUS, the SHERLOC breadboard instrument (Abbey et al., 2017). It uses a 248.5794 nm PhotonSystems NeCu70-248 hollow cathode laser to produce laser excitation. We collected spectra using a 20 Hz laser rep rate with each pulse having a 40 µs width and ∼4.7 µJ/pulse energy at the sample. The incident laser beam was focused to a ∼50 µm annular beam on the sample surface using a 5× objective. We monitored data acquisition for spectral evidence of kerogenization throughout the measurements and observed no evidence of sample damage.
The Raman scattering and fluorescence were dispersed using a Horiba Scientific iHR 320 spectrometer. For Raman measurements, a 2400 g/mm diffraction grating was used to provide a ∼400 to 4900 cm−1 spectral window at a resolution of ∼2 cm−1/pixel. For fluorescence measurements, a 300 g/mm diffraction grating was used to provide a ∼250 to 530 nm spectral window at a resolution of ∼0.18 nm/pixel. Both Raman and fluorescence were detected using a Horiba Scientific back-thinned Synapse Plus CCD that was thermoelectrically cooled to −75°C.
Spectral data processing and analysis
Before peak fitting, ACRONM spectra were processed by first removing cosmic rays in LabSpec6TM software. The spectra were then wavenumber calibrated in Grams/AITM software using cyclohexane. Thermal drift of the wavenumber calibration during collection was corrected using the 2330 cm−1 band of atmospheric N2 observed within the spectra.
We used the open-source peak fitting software Fityk (version 1.3.1; Wojdyr, 2010) for baseline subtraction and peak fitting. The raw DUV Raman and fluorescence spectra reported here are available at the https://doi.org/10.17605/OSF.IO/NKA2V. For each visible Raman spectrum collected on the Neoarchean samples and all DUV Raman spectra, we manually selected four to six points within spectral regions with no Raman signal, distributed across the entire spectrum, and used Fityk’s spline function to subtract the background. For each visible Raman spectrum collected on the Eocene samples, which were dominated by background fluorescence, and all DUV fluorescence spectra, we selected a single point at the lowest point in the fluorescence bands present in each spectrum and used Fityk’s spline function to subtract the background.
We used a Lorentzian fit function to determine Raman peak parameters, following the process recommended by Demtroder (2008), and a Gaussian fit function to find the approximate peak centers of fluorescence bands, according to the process recommended by Gaft et al. (2015). Gaft et al. (2015) suggested that the deconvolution of broad fluorescence bands into their component curves “may be effective only when the exact number of the [component] bands and lines and their spectral positions are already known.” Because the exact number and positions of the spectral features that contribute to the fluorescence bands generated in this study are not known, we did not attempt to fully deconvolve the fluorescence spectra presented herein. Instead, we fit the minimum number of curves needed to account for the dominant bands within the fluorescence spectra, which was two curves. Therefore, the fluorescence band centers reported here should be understood as characterizations of the DUV spectra to be used for comparison to DUV spectra collected by SHERLOC or other DUV fluorescence spectrometers, not as diagnostic indicators of kerogen-rich carbonate microbialite sample composition. Peak parameter uncertainties were calculated in Fityk according to the method of least squares as described by Wolberg (2006), with each point assigned a weight of 1. The raw Raman data is available at https://doi.org/10.17605/OSF.IO/NKA2V.
Results
In the Neoarchean samples, we targeted black and dark gray microbial textures visible at the cut microbialite surface for analysis (Fig. 1A–C; Supplementary Fig. S1A–C; Corpolongo, 2024). Eocene samples GS-22-3 and WR1-22-3 feature stromatolitic layering indicative of microbial life (Seard et al., 2013), although none of the Eocene samples feature readily identifiable macroscopic microbial textures on the cut billet surface, such as the microbial films and support structures that are characteristic of the Neoarchean samples (Sumner, 1997). Therefore, we selected diverse analysis targets on the Eocene samples to ensure that a variety of features were analyzed, rather than targeting specific structures (Fig. 1D–F).
Visible Raman spectra collected from black microbial features at the surface of the Neoarchean samples exhibit characteristic carbonate peaks centered at 1085–1095 cm−1, 1430–1435 cm−1, and 1745–1750 cm−1, kerogen D-bands centered at 1355–1360 cm−1, and kerogen G-bands centered at 1590–1605 cm−1 (Fig. 2A). Visible Raman spectra collected from various features at the surface of the Eocene samples are dominated by a fluorescence signal, which obscures most Raman signals. Some spectra feature the most intense of the characteristic carbonate peaks, which is centered at 1085–1095 cm−1, but none feature discernible secondary carbonate peaks or kerogen D-bands or G-bands (Fig. 2B).
DUV Raman spectra collected from the Neoarchean samples exhibit characteristic carbonate peaks centered at 1075–1085 cm−1, 1423–1434 cm−1, and 1739–1745 cm−1 and kerogen G-bands centered at 1575–1586 cm−1 (Fig. 3A). Some Neoarchean DUV Raman spectra also feature indistinct “shoulders” in the region of the kerogen D-band, such as the KUR-19-30 spectrum in Figure 3. DUV Raman spectra collected from sample DGS-19-1, point 1 and sample DSK-19-1, point 1 feature characteristic carbonate peaks but no discernable kerogen peaks.
DUV Raman spectra collected from the Eocene samples exhibit characteristic carbonate peaks centered at 1077–1086 cm−1, 1428–1438 cm−1, and 1743–1758 cm−1 (except where obscured by kerogen features, as in the yellow GS-22-3 spectrum in Fig. 3A) and kerogen G-bands centered at 1593–1605 cm−1 (Fig. 3). Spectra collected from sample GS-22-3 also feature characteristic cryptocrystalline quartz peaks at 457–461 cm−1 (not shown). Most Eocene DUV Raman spectra also feature broad bands in the kerogen D-band region (Fig. 3A). However, these features completely overlap with the 1428–1438 cm−1 carbonate peaks, which made it impossible to obtain accurate peak parameters using our peak fitting procedure.
DUV fluorescence spectra collected from all samples, including the Neoarchean analysis points at which no kerogen signal was detected via Raman spectroscopy, feature two broad bands (Fig. 4), each of which is likely composed of multiple fluorescence signals. Using the cautious approach to fitting broad bands with unknown spectral components suggested by Gaft et al. (2015), we found that the two bands in the Neoarchean fluorescence spectra are centered at 310–332 nm and 410–422 nm, respectively, and the Eocene fluorescence bands are centered at 310–337 nm and 425–439 nm (Fig. 4). The relative intensities of the two bands varied between measurements, but Band 2 (centered between 410 and 439 nm) was usually more intense than Band 1 (centered between 310 and 337 nm). As indicated in Figure 4, the intensity of the fluorescence signal was much greater, sometimes by an order of magnitude, in the Eocene than the Neoarchean spectra (Supplementary Table S1).
Discussion
Raman spectra
The kerogen D-bands centered at 1355–1360 cm−1 and kerogen G-bands centered at 1590–1605 cm−1 that occur in the visible Raman measurements made on the black and gray microbial structures in the Neoarchean samples confirm the kerogen composition of those structures (Figs. 1A–C, 2A). The interfering fluorescence signal observed in visible Raman spectra collected from the Eocene samples (Fig. 2B) is consistent with the presence of saturated carbon-hydrogen structures (aliphatic carbons) in these samples (Marshall et al., 2010), although not diagnostic of their presence. The presence of aliphatic carbons would be consistent with the low thermal maturity of kerogens present in rocks from the Laney Member of the Green River Formation, as determined by vitrinite reflectance and hydrogen index values (Carroll and Bohacs, 2001).
The DUV Raman spectra we collected differ from the visible Raman spectra in expected ways. While the visible Raman measurements made on Neoarchean samples feature prominent D- and G-bands (Fig. 2A), the DUV Raman measurements feature prominent G-bands alongside weak or nonexistent D-bands (Fig. 3B). This difference demonstrates the G-band signal enhancement that results from the resonance Raman effect described above, which occurs here because the transition energy of vibrational modes within the ordered component of the kerogen preserved within the samples closely matches the energy of the 248.6 nm excitation laser (Asher, 1984). In addition, the intensity of the Raman D-band in disordered graphite is diminished under DUV excitation (Ferrari and Robertson, 2001). These results are consistent with previously reported DUV Raman measurements of in situ Archean and Proterozoic kerogen (Hickman-Lewis et al., 2022; Osterhout et al., 2022; Shkolyar et al., 2018).
DUV Raman measurements made on Eocene samples are free of the fluorescence background present in the visible Raman measurements made on those samples (Figs. 2B and 3B). This difference demonstrates the separation of the Raman spectral emission region from the fluorescence spectral emission region of aromatics facilitated by DUV laser excitation (Asher and Johnson, 1984) and is consistent with previously reported DUV Raman measurements of in situ Eocene kerogen preserved within microbialites (Shkolyar et al., 2018) and fossilized ferns (Czaja et al., 2009).
The DUV Raman spectra collected from Neoarchean and Eocene samples also differ considerably from each other (Fig. 3). The most obvious difference is the presence of discernable D-bands in the majority of the Eocene DUV Raman spectra (Fig. 3B). The discernable D-band is consistent with the lower thermal maturity of the Eocene samples because it indicates that there is a greater proportion of amorphous and smaller aromatic units (Ferrari and Robertson, 2001). In addition, the average G-band peak position in the Eocene DUV Raman spectra (1599.8 ± 3.0 cm−1) is approximately 18.5 cm−1 higher compared with the Neoarchean DUV Raman spectra (1581.3 ± 2.4 cm−1), and the average Eocene DUV G-band full width at half maximum (FWHM; 69.8 ± 9 cm−1) is approximately 14.5 cm−1 wider than the average Neoarchean DUV G-band FWHM (55.3 ± 10.5 cm−1) (Fig. 3). The differences in G-band peak parameters may also be attributed to the low thermal maturity of the kerogen preserved within the Eocene samples. As kerogen metamorphic grade increases and graphitization takes place, G-bands narrow and shift toward the graphite peak position at approximately 1580 cm−1 (Beyssac et al., 2002).
Fluorescence spectra
Interpreting the fluorescence spectra collected during this study is less straightforward than interpreting the Raman spectra because there have been few systematic studies of the fluorescence emissions of relevant natural carbonate and/or kerogen samples under DUV excitation and because of the inherent difficulty of deconvolving broad bands of unknown origin. Available studies have identified multiple possible fluorescence emissions from both inorganic and organic sources that may have contributed to the bands we observed (Fig. 4), which are summarized in Table 1. Based on the available studies, it is possible that both Band 1 and Band 2 consist of convolved fluorescence features from inorganic and organic sources. As stated above, attempting to deconvolve broad fluorescence bands that consist of multiple unknown overlapping components often results in incorrect interpretations (e.g., Gaft et al., 2015). Therefore, it is unlikely that deconvolving the bands in our fluorescence spectra would result in accurate interpretations.
A Summary of Possible Contributions to the Fluorescence Bands Observed in This Study
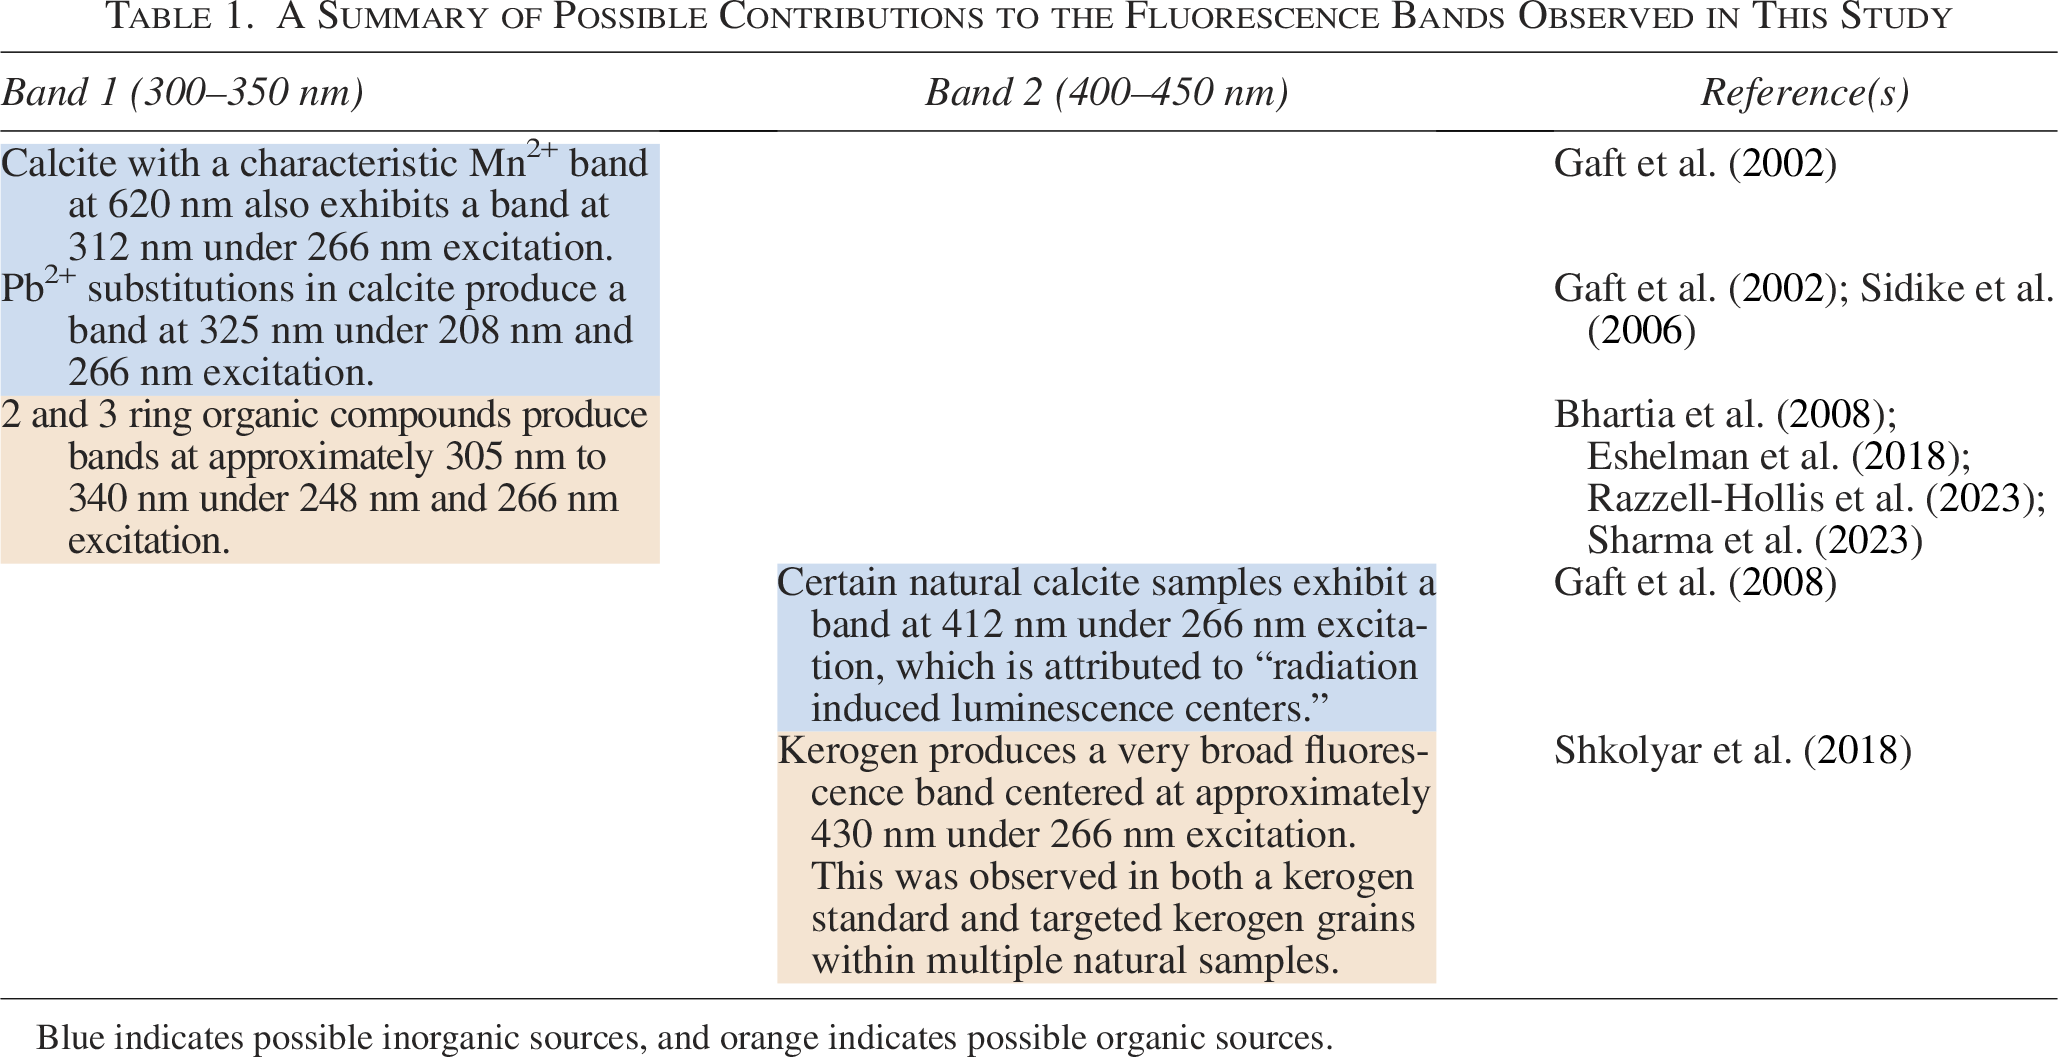
A Summary of Possible Contributions to the Fluorescence Bands Observed in This Study
Blue indicates possible inorganic sources, and orange indicates possible organic sources.
While it is not possible to determine definitively the sources of the fluorescence features in these spectra, we contend that kerogen fluorescence emissions have a greater influence on the Band 2 features in the DUV fluorescence spectra we collected from the Eocene samples than those we collected from the Neoarchean samples. This contention is supported in three ways. First, the average Band 2 position in the Eocene samples (431.3 ± 3.4 nm; Fig. 4D) is consistent with the kerogen fluorescence band identified by Shkolyar et al. (2018; Table 1), while the average Band 2 position in the Neoarchean samples (415.9 ± 3.1 nm; Fig. 4D) is closer to the carbonate fluorescence band identified by Gaft et al. (2008; Table 1). Second, the average relative intensities of Band 1 to Band 2 are much lower and less variable in the Eocene fluorescence spectra (0.11 ± 0.06) than the Neoarchean fluorescence spectra (0.70 ± 0.34), which indicates that the bands centered at approximately 430 nm are the dominant features in all the Eocene spectra. Finally, the similarities between DUV fluorescence spectra collected from Neoarchean microbial structures with distinctive Raman G-bands (Figs. 3A and 4A) and void-filling calcite with no discernible Raman G-bands (Figs. 3A and 4B) in samples DGS-19-1 and DSK-19-5f suggest that the fluorescence features in these spectra are dominated by contributions from inorganic sources. These similarities are particularly noteworthy because they suggest that bands centered between 300 nm and 350 nm in DUV fluorescence spectra collected on carbonate samples may be from inorganic sources.
As of this writing, potential G-band detections have been reported in SHERLOC Raman measurements made on the Jezero crater floor (Fig. 5, Supplementary Fig. S2; Corpolongo et al., 2023; Jakubek et al., 2025; Sharma et al., 2023) and in Neretva Vallis, a valley incised through the Jezero crater rim and Margin Unit (Hurowitz et al., 2025). The potential crater floor G-band occurs in the spectrum collected at point 40 of the Sol 349 High Dynamic Range (HDR) scan of the abrasion patch Montpezat (Fig. 5A). The Montpezat abrasion patch and the location of point 40 are shown in Supplementary Figure S2. The potential G-band in the point 40 spectrum is centered at 1597.2 cm−1, which is consistent with the average G-band position of 1599.8 ± 3.0 cm−1 observed in DUV Raman spectra collected from the Eocene samples in this study but significantly higher than the average G-band position of 1581.3 ± 2.4 cm−1 observed in the Neoarchean DUV Raman spectra (Fig. 5A). As demonstrated by Sharma et al. (2023), the Montpezat peak is also consistent with the macromolecular carbon peak in SHERLOC spectra collected from the martian meteorite Sayh al Uhaymir (SaU008) calibration target, which falls at approximately 1599 cm−1. The Montpezat spectrum also has a broad feature centered at approximately 1080 cm−1 (Fig. 5A), which has been identified as a possible carbonate or silicate Raman feature (Corpolongo et al., 2023; Sharma et al., 2023). The spectrum does not include any other potential mineral detections. The narrow features at approximately 1135 cm−1 and 1820 cm−1 are only a single pixel wide, which is below the established three-pixel threshold for potential SHERLOC Raman signals (Fig. 5; Corpolongo et al., 2023).
The Montpezat spectrum with a potential G-band in the Raman region also has a fluorescence feature at 338 nm, which is at a roughly similar position to Band 1 in the Neoarchean DSK-19-5f point 4 fluorescence spectrum, but dissimilar to the Band 1 features in the Eocene fluorescence spectra, which appear to be dominated by kerogen emissions, as discussed above (Fig. 5B). Sharma et al. (2023) noted that fluorescence features at approximately 335–350 nm, including the Montpezat fluorescence feature, are consistent with the fluorescence emissions produced by two-ring aromatic molecules, such as naphthalene, and Ce3+ in phosphates (Scheller et al., 2022, 2024; Shkolyar et al., 2021). Our results, specifically the presence of similarly positioned fluorescence bands in DUV fluorescence spectra collected at analysis points where no microbial structures are present (Fig. 1A,B) and no G-band was detected (Fig. 4B), support a third possibility, which is that the fluorescence feature in the spectrum collected at point 40 of the Sol 349 HDR scan of Montpezat could be attributable to cationic substitution in a carbonate mineral, such as that reported by Gaft et al. (2002) and Sidike et al. (2006).
Conclusion
Our findings support the conclusion that, while DUV Raman and fluorescence measurements made by SHERLOC have the potential to reveal the presence of MMC, SHERLOC measurements cannot definitively determine whether MMC is of abiotic or biological (kerogen) origin, particularly if the MMC is associated with carbonates. Previous work has established that abiotic and biological MMC Raman spectra are indistinguishable (e.g., Hochleitner et al., 2004; Pasteris and Wopenka, 2003; Steele et al., 2007). In addition, our findings suggest that potential DUV fluorescence spectral features of carbonate minerals, including bands centered between 310 and 337 nm, occur within SHERLOC’s fluorescence detection range of 260–357 nm (Figs. 4 and 5; Table 1). Similar DUV fluorescence bands detected by SHERLOC have been interpreted as consistent with the presence of two-ring organic molecules, such as naphthalene, and/or cerium-bearing phosphates (Fig. 5; Scheller et al., 2022, 2024; Sharma et al., 2023; Shkolyar et al., 2021). This work supports a third possibility, which is that cationic substitutions in carbonates, such as those described by Gaft et al. (2002) and Sidike et al. (2006), are the source of these fluorescence features in SHERLOC spectra.
This conclusion reinforces the importance of delivering the samples collected during the Mars 2020 mission to Earth via the proposed Mars Sample Return missions (e.g., McSween et al., 2025) and highlights the need for future DUV fluorescence measurements made on carbonates of known composition to enable better interpretation of SHERLOC fluorescence spectra. The position of the potential Raman G-band reported by Sharma et al. (2023) is more consistent with the G-band position in the thermally immature Eocene samples than the more thermally mature Neoarchean samples measured in this study (Figs. 3 and 5), which may suggest that, if MMC carbon is present in Jezero crater samples, it is relatively thermally immature. Biomarkers, such as hopanoids and proteins, can persist in thermally immature kerogen in sedimentary deposits on Earth (e.g., Abbott et al., 2001; Mongenot et al., 2001). Therefore, our results suggest that laboratory analysis of MMC extracted from samples collected in Jezero crater and delivered to Earth may be able to detect compelling chemical evidence of ancient microbial life on Mars, if such evidence exists.
Footnotes
Acknowledgments
A.C. wishes to thank the Lewis and Clark Fund for Exploration and Field Research in Astrobiology and the NASA Astrobiology Early Career Collaboration Award for fieldwork support for this project.
Portions of this article were previously published in the dissertation of Andrea Corpolongo (Doctor of Philosophy in Geology from the University of Cincinnati in 2024).
Author Disclosure Statement
The authors have no conflicts of interest to declare.
Funding Information
A.D.C. acknowledges support from NASA Participating Scientist grant 80NSSC20K0237. Both A.C. and A.D.C. acknowledge support from NSF Earth Science grant 2029521.
Supplemental Material
Supplemental Material
Supplemental Material
Associate Editor: Michael C. Storrie-Lombardi
Abbreviations
References
Supplementary Material
Please find the following supplemental material available below.
For Open Access articles published under a Creative Commons License, all supplemental material carries the same license as the article it is associated with.
For non-Open Access articles published, all supplemental material carries a non-exclusive license, and permission requests for re-use of supplemental material or any part of supplemental material shall be sent directly to the copyright owner as specified in the copyright notice associated with the article.