
Abstract
Tensile strength and elongation are key mechanical properties of leather that reveal important aspects of its performance. Traditionally, these properties are measured using samples taken in two directions - parallel and perpendicular to the leather’s backbone line - and averaged. However, collagen fibers in leather are oriented in various directions and proportions throughout the material. Unlike fabrics, where shear behaviors are considered, leather’s shear strength is often overlooked in property evaluations. Considering leather as a fabric, shear strength becomes significant because garments are subjected to forces in multiple directions during use. No prior studies have investigated leather strength by considering all directions beyond the standard parallel and perpendicular measurements. This study examines whether tensile strength and elongation vary with sampling direction. Data were collected at 15° intervals around a 360° circle from garment sheep leather samples. Results reveal that tensile strength was generally higher in samples taken parallel to the backbone line, while elongation was lower in this direction. This study helps leather apparel companies optimize cutting techniques by revealing how tensile strength and elongation vary with sampling direction. Improved cutting decisions lead to better garment performance, fit, and durability, while also enhancing customer satisfaction.
Introduction
Collagen exists in various forms throughout nature. Each polypeptide molecule forms a left-handed helix, and three of these helices together create a right-handed triple-helical structure known as tropocollagen. 1 A single polypeptide chain, also referred to as procollagen, contains a repeating amino acid sequence: Gly-X-Y, where Gly represents glycine, and X or Y can be any other amino acid. 2 Collagen is the most abundant structural protein in mammals and is a major component of connective tissue, skin (leather), bone, cartilage, and tendons. 3
Leather has a complex structure due to its three-dimensional (non-woven) collagen network, which exhibits properties such as inhomogeneity across the leather area
4
variations in fiber diameter,
5
and differences in angle and orientation,
6
and non-uniform crosslinking density.
7
Furthermore, Daniels (2007) has also demonstrated the orientation of hair follicles in hides, as shown in Figure 1. He explains that the maximum stretch values generally align with the direction of the hair follicles, as this direction closely follows the orientation of the underlying fiber structures. He further suggests that the lines of maximum stretch under a given load closely follow these lines of fiber orientation, reinforcing the relationship between the alignment of hair follicles and the mechanical properties of leather.
6
Typical hair follicle pattern on the hide.
6

The chemical treatments used to convert skin into leather, particularly tanning, can alter the structure and arrangement of collagen fibrils. These processes, which include the use of strong salt solutions, large pH changes, enzymatic treatments to remove cross-links, and the formation of new cross-links, significantly impact the collagen structure. 8 New cross-links between these groups further inhibit the relative movement of molecules or fibers under applied loads, thereby enhancing the mechanical strength of the fibers. 9 During tanning, cross-linking agents such as chromium sulfate or vegetable tannins, along with fats and oils, are introduced to enhance the integrity of the collagen matrix. 10 It has also been documented that chrome tanning increases the degree of cross-linking between fibers and that this interaction reaches down to the ground fiber level.11,12
The orientation of collagen fibers has been found to be closely related to a tissue’s ability to withstand tensile stress, which directly influences its mechanical properties, 13 including leather strength. 14 Among the most frequently measured mechanical properties of leather are its tensile strength and elongation. In addition to these values, the elasticity (Young’s modulus) can also be counted among the most commonly used values in scientific terms.
The International Organization for Standardization (ISO) has established a tensile strength and elongation testing standard for leather. According to this standard (TS EN ISO 2418), leather samples are required to be taken in three parallel and three perpendicular directions to the backbone line15–19 to minimize material waste, as leather is an expensive and luxurious material.
However, in practice, cutting patterns for leather garments involves more than just parallel and perpendicular alignments. To reduce waste, patterns are often positioned at various angles on the leather. Consequently, the tensile strength and elongation values measured in the parallel and perpendicular directions may not fully represent the material’s behavior when used in garments. Although there are studies on shear deformation20,21 and angle variations22–24 in textile materials, no such studies have been found regarding leather.
The novelty of this research lies in the comprehensive analysis of the mechanical behavior of leather in relation to the orientation of collagen fiber bundles at all angles, rather than focusing solely on the parallel or perpendicular alignment with the backbone line. In this study, tensile strength and elongation across a range of orientations were examined, offering a broader perspective on how the alignment of fibers affects the overall mechanical properties of leather. The results highlight the critical role of fiber orientation in determining the tensile properties of leather. Specifically, collagen fibers aligned along the perpendicular direction to the backbone line contribute to enhanced elongation, while fibers oriented parallel to the backbone line improve tensile strength. These findings offer a deeper understanding of the microstructural factors influencing the performance of leather in various applications.
In the context of leather garment production, such as jackets, tensile strength is particularly important in regions exposed to higher stress, such as the back, elbows, and seamed areas. These areas must maintain durability and resistance to tearing or deformation, ensuring the garment’s structural integrity over time. On the other hand, flexibility and elongation are critical for areas requiring more movement and comfort, such as the arms and torso. Additionally, when leather pieces are cut using patterns, the orientation of the collagen fiber bundles relative to the pattern is crucial. The direction in which the patterns are positioned influences the overall fit, comfort, and durability of the final product. For instance, positioning the pattern parallel to the fiber direction in high-stress areas can enhance tensile strength, while placing it perpendicular can improve flexibility and elongation in areas that require more movement. If the required strength is not maintained in leather garments or products, several potential issues can arise. In garments such as jackets, insufficient tensile strength in high-stress areas can lead to premature wear and tear, tearing, or even structural failure. This significantly affects the garment’s durability and overall performance, reducing its lifespan and functionality. Moreover, a failure to meet strength requirements can affect the aesthetic appeal of the product, as it may lose its form or appear worn out prematurely, reducing its market value.
Understanding the relationship between collagen fiber orientation and mechanical properties provides valuable insights into how to design leather garments can be designed to balance both strength and elongation, improving their overall functionality and longevity. Overall, this research aims to fill a gap in understanding how collagen fiber orientation affects the mechanical behavior of leather, particularly in terms of its tensile and elongation properties. The results offer practical implications for the design and production of high-performance leather garments and goods, ensuring that both functional and aesthetic requirements are met.
Materials and methods
In this study, fifteen chromium-tanned garment sheep leathers, each with a thickness of 0.7-0.8 mm, were used. The sampling area was selected on the leather as shown in Figure 2(a). Before cutting the leather samples, the cutting angles were marked as shown in Figure 2(b). The cutting was performed at 15° intervals around a 360° circle using a standard press knife (Figure 3) and hydraulic press cutting machine. Overview of the leather sampling design. (a) Schematic location of the sampling region on the leather relative to the backbone line; (b) Schematic illustration of sampling angles across the 360° circle. Dimensions of the press knife used for tensile strength and elongation tests.
25


Each of the 15 leathers was subjected to a tensile strength and elongation test. However, since the test was conducted at 15° intervals around a full 360° rotation, a total of 26 measurements were obtained per leather sample, covering different orientations.
Before testing, all leather samples were conditioned at a temperature of 23 ± 2°C and a relative humidity of 50 ± 5% for 48 h, in compliance with the TS EN ISO 2419 standard. The thickness of each leather sample was measured using a SATRA Thickness Gauge, in accordance with the TS EN ISO 2589 standard.
Tensile strength and elongation percentage values of the leather samples were determined using the Shimadzu AG-IS Tensile Tester, equipped with Trapezium-2 software and a 5 kN load cell, in line with the TS EN ISO 3376 standard. This equipment has a force resolution of 0.1 N, ensuring high precision in measuring the breaking force. The measurement uncertainty for tensile strength and elongation was calculated as ± 0.05 N/mm2 and ±0.1%, respectively. The tensile strength and elongation values were calculated using equation (1) and equation (2), respectively. Elasticity (Young’s modulus, E) was calculated from the initial linear portion of the stress-strain curve using equation (3). It was determined as the ratio of the tensile stress- σ to the tensile strain- ε within the elastic region, prior to the material yielding.


The average values of the data were first calculated, followed by the application of a one-way ANOVA statistical test, supplemented with Duncan’s multiple comparison test, to assess the statistical significance of differences between groups. All statistical analyses were performed using the SPSS 25.0 statistical software package. In these analyses, a confidence level of 95% was adopted, and all results were evaluated at a significance level of α = 0.05. Subsequently, the standard deviation, standard error, and coefficient of variation (%) were calculated to assess the variability and consistency within the dataset. These statistical measures provide insights into the central tendency and dispersion of the data, facilitating a deeper understanding of underlying patterns and trends. While the mean summarizes the dataset, the standard deviation and coefficient of variation offer valuable information on the spread and consistency of the measurements, ensuring the reliability of the experimental findings.
Results and discussion
Tensile strength values (N/mm2) at various angles.

F = 3.680.
p = 0.0001.
aMeans in the same column followed by different letters are significantly different (p < 0.05).
Elongation (%) at various angles.
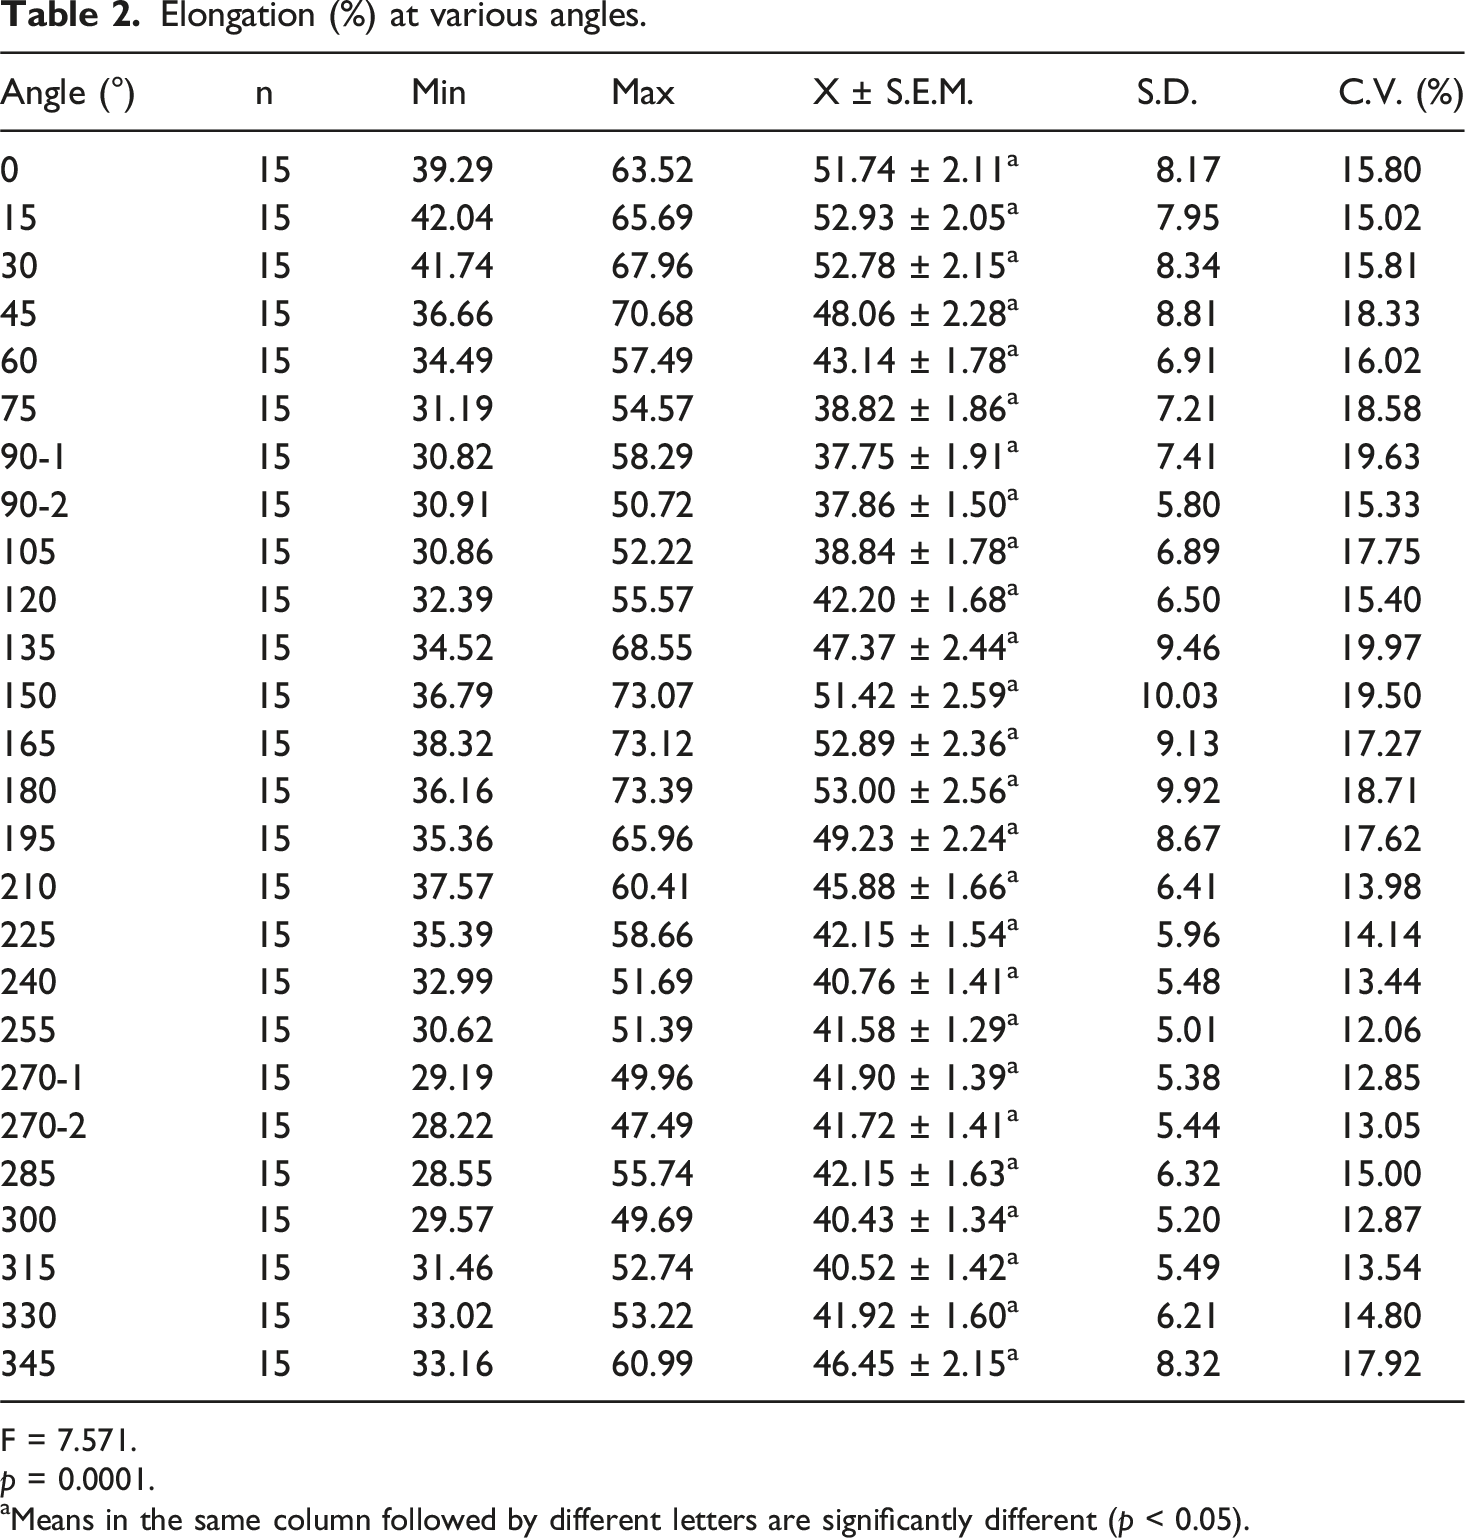
F = 7.571.
p = 0.0001.
aMeans in the same column followed by different letters are significantly different (p < 0.05).
Elasticity (MPa) at various angles.

F = 11.399.
p = 0.0001.
aMeans in the same column followed by different letters are significantly different (p < 0.05).
Table 1 reveals that the mean tensile strength values demonstrate a general increasing trend as the angle increases, with the lowest mean recorded at 0° (5.69 ± 0.36 N/mm2) and the highest at 90° (8.11 ± 0.46 N/mm2). This suggests that the material exhibits the highest resistance to tension when aligned parallel to the backbone line to a specific direction. The values remain relatively stable at smaller angles but start to rise significantly beyond 60°, peaking between 75° and 105°. Superscript letters indicate statistical groupings, where values sharing the same letters do not significantly differ. Lower angles (30°– 0°– 315° and 150° – 180° – 225°) primarily belong to the same group, suggesting no significant differences, whereas a distinct shift is observed at 45° (5.91 ± 0.50 N/mm2). The most statistically distinct group appears at 90°, confirming a significant difference from lower angles.
Variability in the tensile strength data is reflected in the standard deviation and coefficient of variation. The standard deviation ranges from 1.01 to 1.92, with the highest observed at 45° (1.92), indicating greater dispersion at this angle. The coefficient of variation ranges from 17.09% (at 300°) to 32.56% (at 45°), further highlighting that data dispersion is greatest at 45°, whereas it remains more consistent at angles such as 300°.
Statistical significance was assessed using a one-way analysis of variance (ANOVA), yielding an F-statistic of 3.680 and a highly significant p-value of 0.0001. These results confirm that tensile strength varies significantly depending on the angle, with meaningful differences observed across different angular positions.
The findings suggest that tensile strength is strongly influenced by angular variation, with a pronounced increase beyond 60° and a peak around 90°. The results indicate that angles within the range of 75°–105° may be optimal for maximizing the measured characteristic. Additionally, the high variability observed at certain angles, particularly at 45°, suggests potential external influences affecting measurement consistency in this range. These insights provide valuable information for optimizing tensile strength based on angular positioning, which could be critical for applications requiring directional mechanical performance.
As seen in Table 2, the results indicate a distinct trend in elongation (%) with varying angles. The highest mean values are observed at 180° (53.00 ± 2.56%), 165° (52.89 ± 2.36%), and 15° (52.93 ± 2.05%), whereas the lowest mean values occur around 90° (37.75 ± 1.91% for 90-1 and 37.86 ± 1.50% for 90-2). The results suggest that elongation is highest along the primary axis (0°–30° and 165°–180°) and significantly lower around 90°, where the leather exhibits reduced stretchability. This reduction in elongation implies that the leather becomes stiffer and less ductile in the parallel to the backbone line direction, corresponding to the increase in tensile strength observed in the same range.
The superscript letters denote statistical groupings, with values sharing the same letters not being significantly different. The elongation at 0°, 15°, 30°, 165°, and 180° belong to the same statistical group (a), indicating that these angles exhibit similar elongation behavior. Conversely, angles between 75° and 105° belong to group (f), signifying significantly lower elongation. A transition phase is observed between 45° and 135°, where elongation progressively decreases before increasing again beyond 135°.
The standard deviation (S.D.) ranges from 5.01 to 10.03, with the highest variation recorded at 150° (10.03%), indicating greater inconsistency in elongation at this angle. Conversely, the lowest variation is observed at 255° (5.01%), suggesting more uniform elongation behavior. The coefficient of variation (C.V. %) ranges between 12.06% (at 255°) and 19.97% (at 135°), highlighting that elongation variability is more pronounced at angles where the material undergoes directional stretching, particularly at 135° (19.97%) and 75° (18.58%). The data’s variability, as indicated by the standard deviations, reflects inherent differences in the leather composition and structural anisotropy, highlighting the complexity of elongation behavior across the range of angles studied.
Statistical significance was analyzed using one-way ANOVA, yielding an F-statistic of 7.571 and a highly significant p-value of 0.0001, confirming that elongation (%) is significantly influenced by angular variation.
The findings indicate that elongation is highly dependent on angular orientation, with the highest values observed along longitudinal (0°–30°) and near-longitudinal (165°–180°) directions, while significantly lower elongation is observed around 90°. This suggests that the leather exhibits greater stretchability along its primary axis, whereas perpendicular orientations (90°) result in reduced elongation, possibly due to fiber alignment or structural constraints within the material. The significant statistical differences between groups reinforce the anisotropic nature of elongation, which should be considered in applications where directional flexibility is critical. These insights provide valuable information for optimizing leather performance based on elongation characteristics. For applications requiring high elongation, angles around 0°–30° and 165°–180° should be prioritized. In contrast, for structural stability where minimal elongation is preferred, orientations around 90° would be more suitable.
Upon analysis of the data in Table 3, the data demonstrates a clear trend in elasticity values that vary significantly with the change in angle. The highest mean elasticity is observed at 90° (22.02 ± 1.52 MPa for 90-1 and 21.70 ± 1.55 MPa for 90-2), followed by 75° (19.53 ± 1.05 MPa) and 105° (18.51 ± 1.05 MPa). In contrast, the lowest mean values are seen around 15° (11.07 ± 0.84 MPa) and 165° (11.22 ± 0.78 MPa) suggesting that elasticity is lowest along the longitudinal directions and increases in angles closer to 90°. These findings highlight the anisotropic nature of the leather, where elasticity is influenced by the angle of measurement, indicating that directional properties significantly affect the material’s elasticity.
The superscript letters denote statistically significant groupings, with values sharing the same letter not showing significant differences. For example, angles between 0° – 30° and 165° – 180° share group (h), suggesting that the elasticity values at these angles are statistically similar. The significant increases in elasticity observed around 60° (15.56 ± 0.91 MPa), 75° (19.53 ± 1.05 MPa) and especially at 90° (22.02 ± 1.52 MPa) suggest a transition in material behavior, potentially linked to its fiber orientation or molecular arrangement.
The standard deviation (S.D.) varies between 2.34 and 6.02, reflecting the spread of elasticity values around the mean. The highest variation is seen at 90-2 (6.02 MPa), indicating that elasticity at this angle is more dispersed compared to other angles, which may point to inconsistencies in the material at this orientation. The coefficient of variation (C.V. %) ranges from 15.93% to 31.58%, with the highest variability observed at 45° (31.58%), indicating a less uniform elasticity across the sample. The lowest variability occurs at 300° (15.93%), where elasticity is more consistent.
The F-statistic of 11.399 and a p-value of 0.0001 indicate that angular orientation has a significant effect on elasticity. This confirms that the variation in elasticity across different angles is not due to random chance, reinforcing the conclusion that angular direction significantly influences the leather’s elasticity.
These results emphasize the importance of directional orientation in determining the elasticity of the leather. The highest elasticity values at 90° suggest that the leather exhibits its maximum elasticity when tested perpendicular to its primary axis, while lower elasticity at 0° and 15° indicates stiffer behavior along the primary fiber direction. This anisotropic characteristic is critical for applications where directional stretching or compressing forces are involved, as materials will respond differently depending on the angle of stress or strain.
The significant differences in elasticity across angles suggest that the leather may be tailored or optimized for different applications by selecting specific angles of orientation that enhance the material’s stretchability or stiffness. For flexible applications, where maximum elasticity is required, angles around 90° and 75° should be prioritized, while for structural or stiff applications, angles near 15° or 165° would be more appropriate.
In conclusion, the elasticity of this material is highly angle-dependent, and understanding its variability across different orientations is crucial for selecting the appropriate leather properties for specific engineering or manufacturing needs.
Figures 4–6 illustrate the angular trends in tensile strength, elongation and elasticity (Young’s modulus), respectively. As depicted in Figure 4, tensile strength decreases as the angle approaches 0°-180° (perpendicular to the backbone line), while it increases towards the 90°-270° directions (parallel to the backbone line). Figure 5 reveals that elongation follows an opposite trend: elongation values are higher along the 0°-180° axis, while they decrease along the 90°-270° axis. The general curve form in Figure 6 implies that the leather exhibits different elasticity (Young Modulus) properties in different directions. In the context of elasticity, similar to tensile strength, a reduction is observed along the axis perpendicular to the backbone line (approximately 0°-180°), whereas a notable increase is observed along the axis parallel to the backbone line (90°–270°). Angular graph of average values of tensile strength on leather. Angular graph of average values of elongation on leather. Angular graph of average values of elasticity (Young’s modulus) on leather.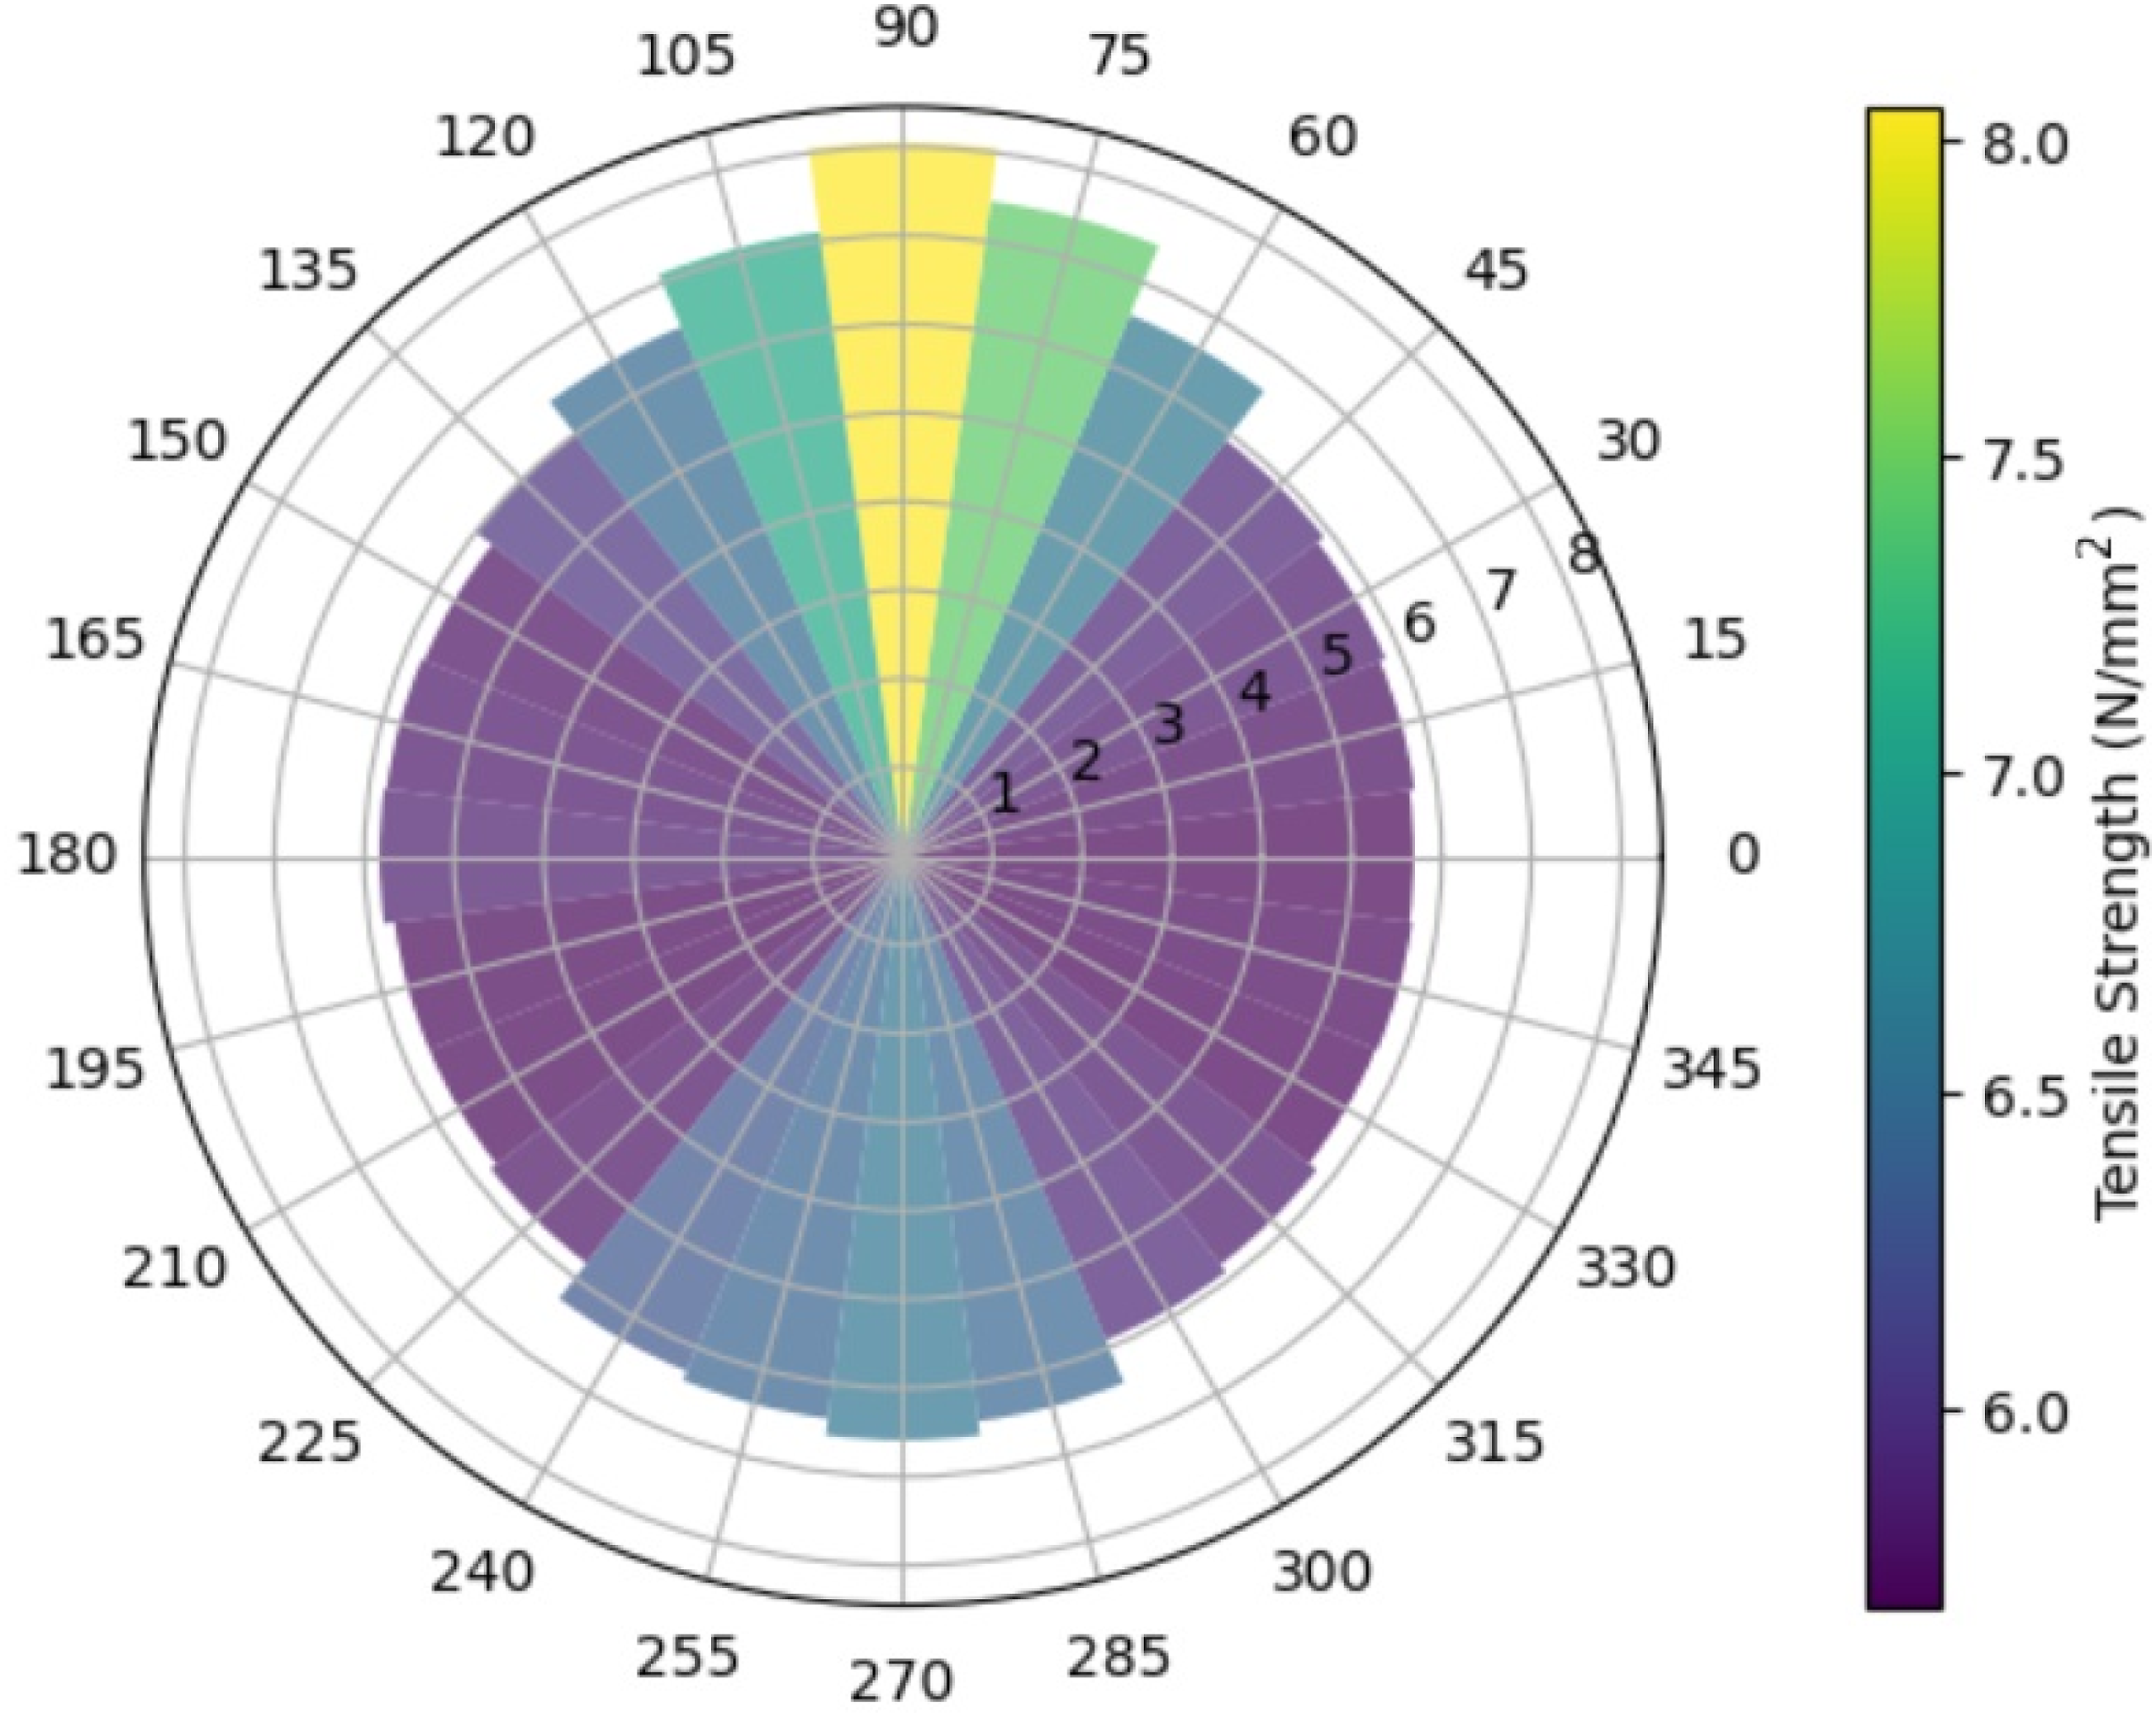


Considering that the graphs are not symmetric and exhibit an elliptical structure, it can be inferred that the leather is not isotropic (exhibiting uniform properties in all directions) but rather demonstrates anisotropic (direction-dependent) characteristics.
The results of this study provide significant insight into the relationship between the orientation of collagen fiber bundles in leather and its mechanical properties. It was observed that the collagen fiber orientation is perpendicular to the backline and progresses towards the hem, creating a distinct directional arrangement. This orientation has a profound effect on the leather’s mechanical properties, particularly in terms of tensile strength and elongation. Specifically, the collagen fibers aligned in this direction lead to a decrease in tensile strength along the fiber axis, as the fibers are less able to resist stretching in this orientation. However, this same alignment facilitates an increase in the elongation at break, since the collagen fibers are able to elongate more before failure. This directional dependence of mechanical properties, given that the data highlights it, underscores the critical role of fiber orientation in determining the structural behavior of leather, contributing to a deeper understanding of how the microstructure of leather influences its performance in various applications. As demonstrated by Boote et al. (2002), the pseudo-affine behavior of collagen fibers during uniaxial loading confirms that fiber alignment significantly affects both tensile strength and elongation characteristics in leather, especially under directional stress. 13
This data highlights the importance of considering the angle of cut when evaluating the mechanical properties of leather, given that tensile strength, elongation, and elasticity exhibit significant variations depending on the orientation of the collagen fibers. These findings are critical for industries that require precise mechanical properties in leather garments and other products, emphasizing the need for careful cutting and pattern placement to maximize strength and minimize elongation where necessary. As exemplified in Figure 7, placing the patterns either horizontally or vertically on the leather during the cutting process can serve as a guideline for optimizing tensile strength and elongation properties, ultimately contributing to the improvement of product quality by ensuring better mechanical performance. Pattern placement example.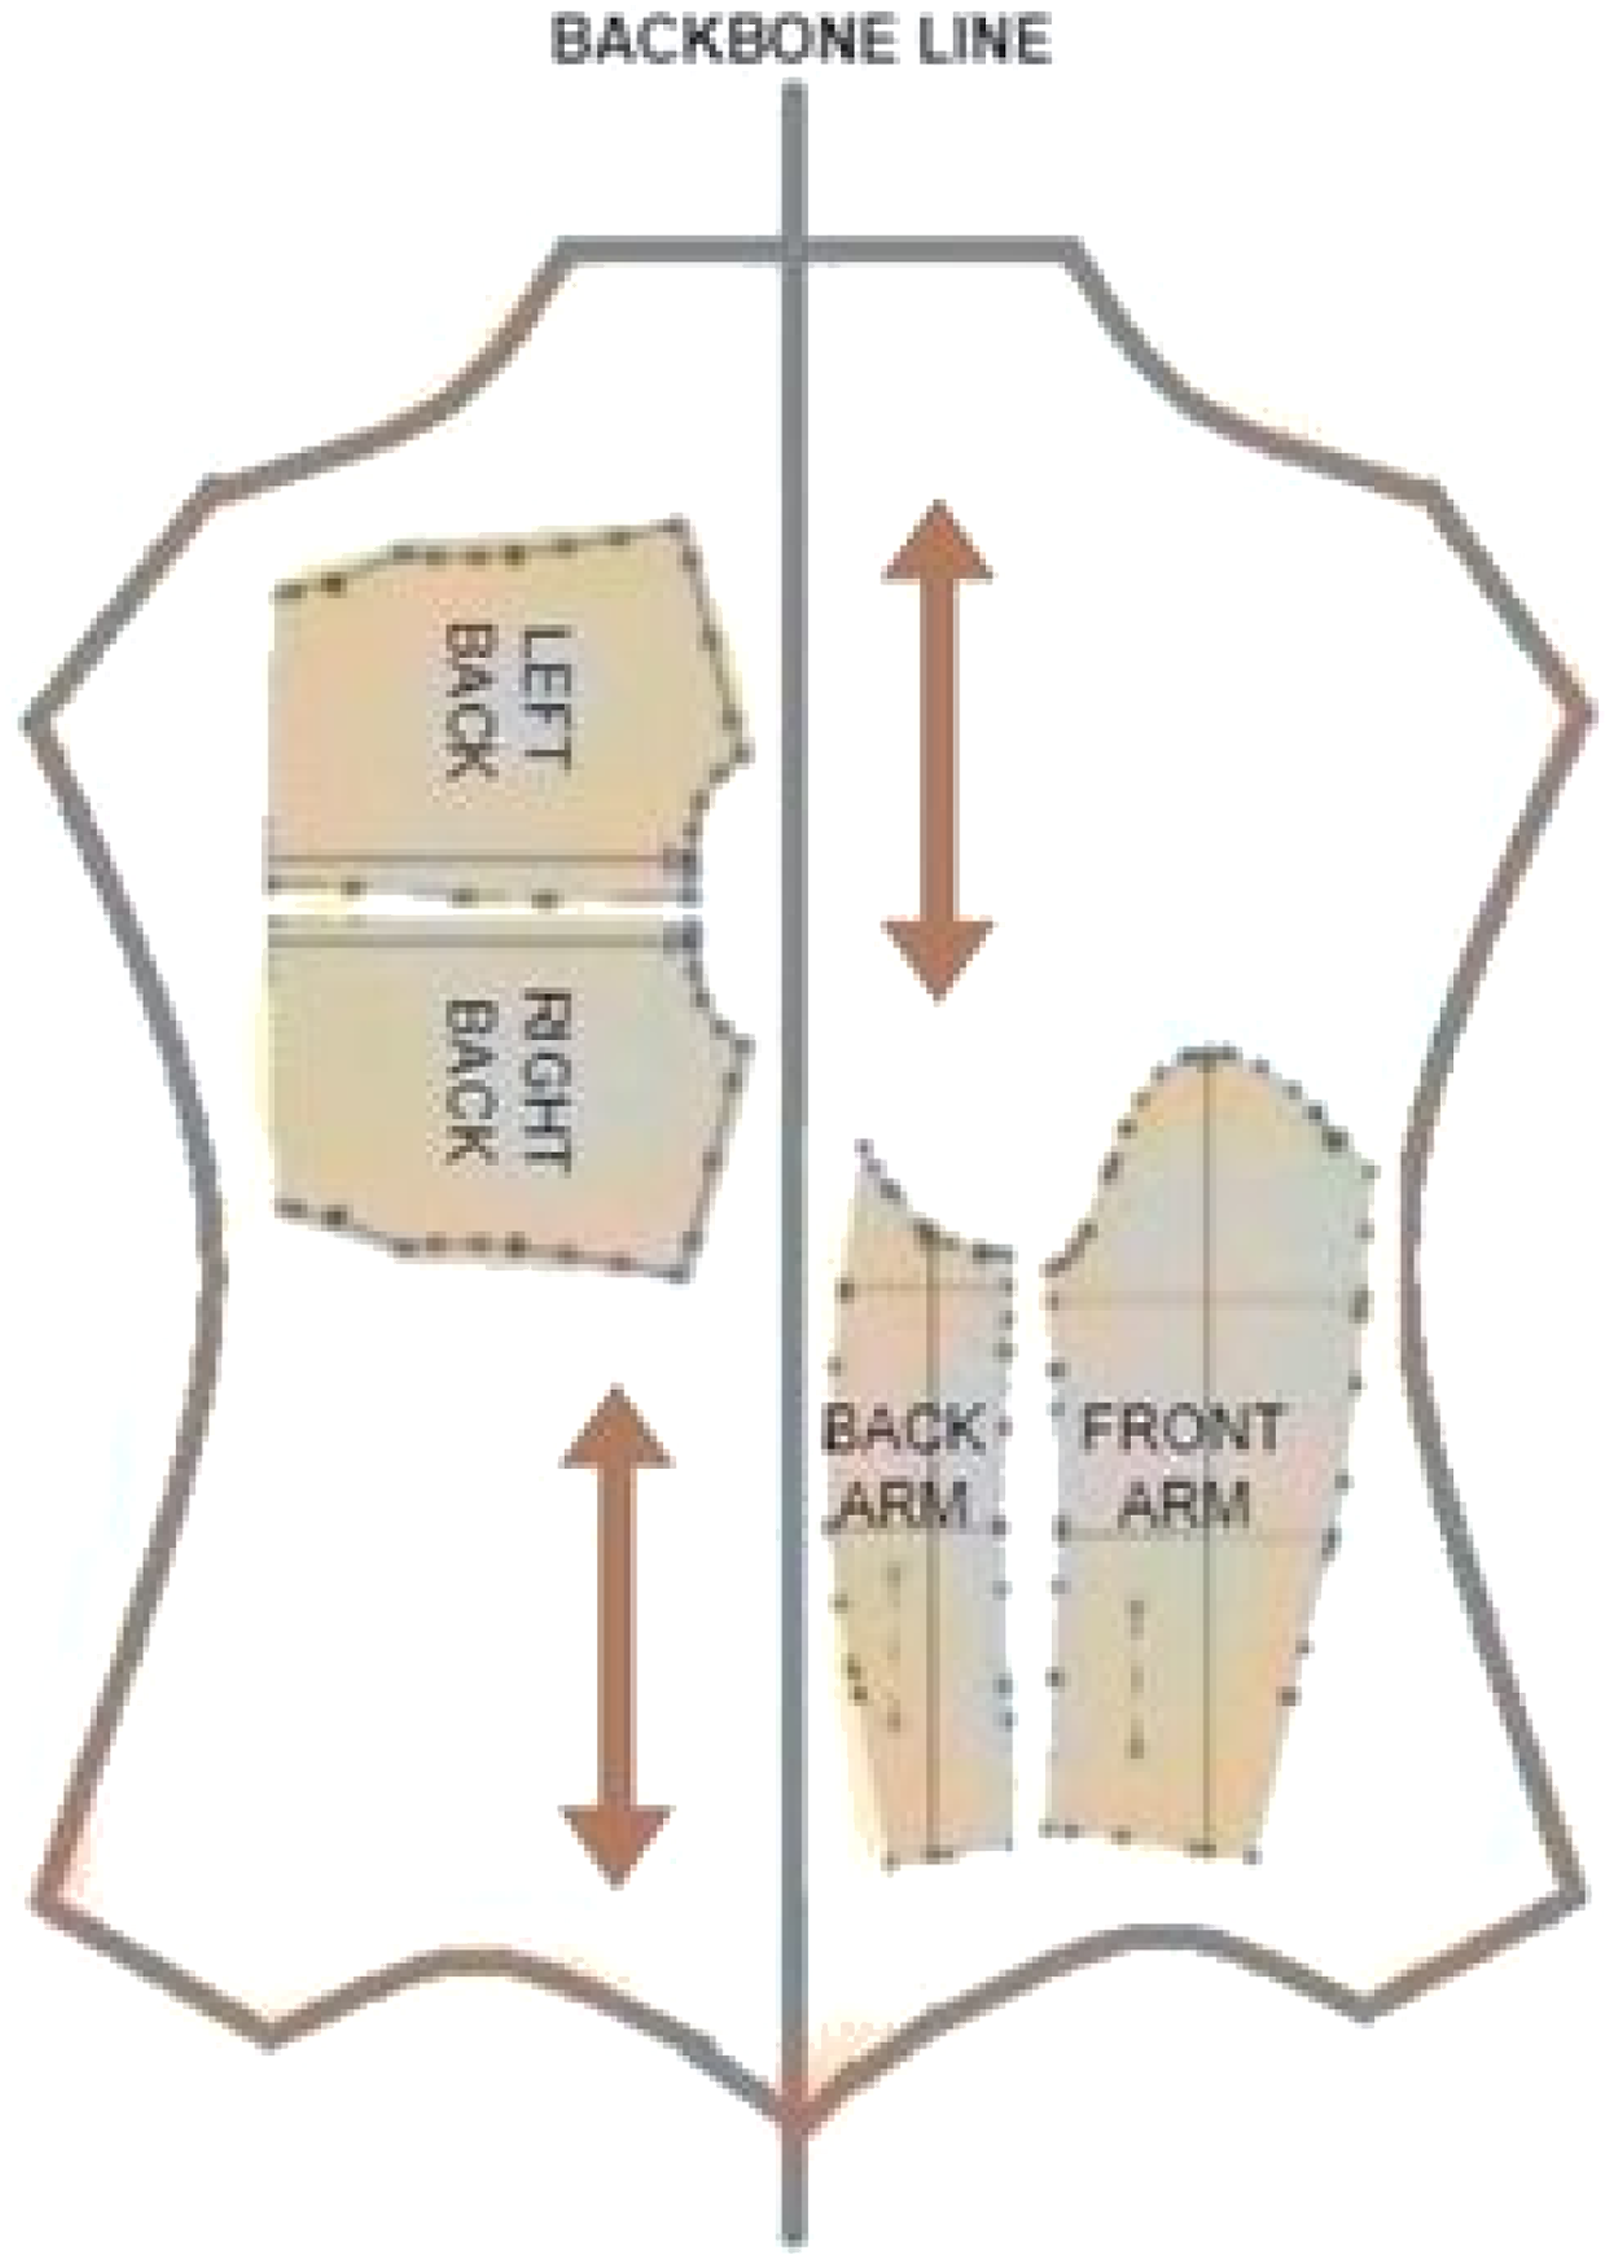
Conclusion
To measure the mechanical, physical and fastness values of leather materials there are some standard test methods prepared by experts in the field. In particular, the non-homogeneous nature of leather makes it challenging to determine its mechanical properties. To address this, standards specify parameters such as sampling area, conditioning temperature and humidity, sample quantity, and directions. While these standard methods are designed to be implemented with precision, this study questions whether the accuracy of these results meets satisfactory levels.
Additionally, to eliminate variables originating from the collagen structure of the leather in tensile strength and elongation percentage tests - one of the mechanical properties - sampling directions were specified as parallel and perpendicular to the backbone line. The study investigated whether the averages of the values obtained from these two directions provide information about the overall strength, elongation and elasticity of the leather. The following results were obtained: • As demonstrated in the study by Penava et al.
26
on woven fabrics, the findings of this research similarly indicate that the tensile strength, elongation and elasticity properties of leather exhibit anisotropic behavior. The orientation of fibers and structural arrangement within the leather contribute to its mechanical responses, which vary depending on the angle of applied forces. • The highest tensile strength and elasticity values of garment sheep leathers were found in samples taken parallel to the backbone line, while the lowest values were found in samples taken perpendicular to the backbone line. • Examination of the elongation percentage values showed that they exhibit the opposite trend to tensile strength, which is expected, as a decrease in elongation behavior is observed in the directions where strength is high. • As stated in the standards, averaging the results from samples taken parallel and perpendicular to the backbone line effectively represents the extremes of the measured properties. Thus, the average of these results provides a comprehensive indication of the leather’s mechanical properties. • In leather apparel companies, cutters typically do not pay attention to these angles, focusing primarily on minimizing waste. Due to the high cost of leather, they tend to place the patterns on the leather in a way that reduces waste, cutting the leather with minimal attention to fiber orientation. However, this practice overlooks the impact on the quality of the leather product, as it disregards the importance of fiber orientation, which plays a crucial role in determining the mechanical properties of the final product. These findings offer valuable insights for leather cutters and apparel manufacturers utilizing finished leather. They serve as a guide for understanding the mechanical characteristics of the material and for determining the optimal cutting direction for garment components that require high quality leather garments.
It is important to acknowledge that this study has certain limitations, such as leather type and number of leather samples. Future research could address these limitations by exploring a wider variety of leather types and number of samples to further validate and improve the findings. Additionally, future studies should incorporate microscopic and spectroscopic techniques (e.g., SEM, XRD) to validate fiber orientation and correlate it with mechanical behavior more directly.
Footnotes
Acknowledgments
The author would like to thank Canbol Leather Company for providing leathers, and Prof. Dr. Mehmet Mete Mutlu, Prof. Dr. Huseyin Ata Karavana and Assoc. Prof. Dr. Ali Yorgancioglu for their contributions.
Funding
The authors received no financial support for the research, authorship, and/or publication of this article.
Declaration of conflicting interests
The authors declared no potential conflicts of interest with respect to the research, authorship, and/or publication of this article.
Data Availability Statement
All data generated or analyzed during this study are included in this published article.