
Abstract
A novel eco-friendly friction composite has been developed using non-toxic, biodegradable materials, incorporating benzoylated Pseudoxytenanthera stocksii (P. stocksii) bamboo fibers as reinforcement, along with natural fillers and a chemically modified binder matrix. To enhance thermal and tribological performance, thermally stable silicon oil, recognized for its superior oxidative resistance and lubricant efficiency, was employed in place of conventional graphene additives. Silicon oil exhibited a high coefficient of friction (COF) of 2.22, making it an ideal lubricant additive for frictional applications. The developed composites demonstrated remarkable thermal stability, with degradation temperatures ranging from 615°C to 700°C. Raman spectroscopic analysis confirmed the uniform dispersion of silicon oil throughout the matrix. Rockwell hardness measurements indicated a surface hardness of 93 HRL, while pin-on-disc tribological testing revealed the influence of varying weight percentages of modified matrix and lubricant on composite performance. Taguchi L16 orthogonal array design, validated through ANOVA analysis, identified the C10S8 formulation as optimal, exhibiting a consistent COF of 0.53–0.55, frictional stability between 96% and 98%, and a specific wear rate (SWR) of 1–1.7 × 10⁻⁵ mm3/Nm. SEM analysis further confirmed the improved surface morphology and integrity of the worn surfaces. The synergistic effect of silicon oil and modified resin enhanced the physical, mechanical, and tribological characteristics of the composite, making it a strong candidate for eco-efficient brake pad applications in the automotive sector.
Introduction
Friction material composite design is a delicate balance between environmental sustainability, and cost without any compromise in the performance of friction material by considering high friction stability with excellent recovery and low wear rate over a wide range of operating conditions.1,2 Initially, asbestos was widely used,3,4 but after its global ban in the late 80s due to environmental concerns, synthetic fibers gained traction.5,6 However, synthetic fibers pose environmental challenges and high production costs, leading to the exploration of alternative, eco-friendly materials like plant-based fibers. 7 Natural fiber composites (NFC) are increasingly being used for numerous reasons, such as their ability to substitute synthetic fiber-reinforced plastics at a lower price with enhanced sustainability.8,9 These natural fibers, such as bamboo, have exceptional mechanical and chemical properties, making them promising for friction materials.10–12 To address the hydrophilic nature of natural fibers, chemical modification techniques are explored, elevating their material properties and reducing hydrophilic possibilities.13–15 Taking inspiration from a research 16 highlighting enhanced strength characteristics in Palmyra palm leaf stalk fibers after treatment with benzoyl chloride, our research focuses on the investigation of chemical modification procedures, more precisely, alkaline pre-treatment followed by benzoylation treatment, and their effects on tribological characteristics. 17 This study includes benzoylated P. stocksii bamboo fibers as considered one of the reinforcements.
The selection of lubricants plays a pivotal role in the advancement of friction materials, ensuring consistent frictional properties coupled with high wear resistance. Notably, copper stands as a crucial and nearly indispensable component of Non-Asbestos Organic (NAO) friction materials.18,19 However, recent findings have underscored the environmental threat posed by copper as the debris pose threat to aquatic life. 20 With the passage of time, graphite has also been shown to be an effective substitute for copper as a solid lubricant in friction composites (FCs), among other critical constituents.21,22 Additionally, graphite contributes towards the thermal conductivity of FCs, albeit less effectively than copper. Graphite has no satisfactory service as a lubricant at elevated temperatures, and the efficiency of its lubricity and thermal conductivity vary with its form (natural or synthetic), crystallinity, particle size and shape, and adsorbed moisture content. 23 The planar structure of graphite enables the individual planes to glide over one another with minimal energy output resulting in low friction and smooth motion between contacting surfaces. Graphite’s lubricity is a result of the “weak” interlayer interactions between discrete layers, an established fact. But interactions involved are too weak to support the easy exfoliation of graphite into graphene on a large scale. 24 Friction materials require qualities such as high wear life and consistent friction performance, where graphene, with its thermal and strength properties, may have a beneficial impact on friction applications.25–27 Replacement of graphite by exfoliated nano sheets of graphene in friction composites has proved that wear resistance of graphene composite is three times superior to the graphite based composite. 25
To ensure stable friction performance over a wide temperature range, manufacturers of friction materials frequently blend multiple solid lubricants or incorporate liquid lubricants that are effective at different temperature ranges. Silicon oil-based lubricants, in particular, are commonly used due to their outstanding high-temperature stability and compatibility with polymers.28,29 In this study, we explore a novel approach by combining nano graphene as a solid lubricant with silicon oil as a liquid lubricant. This allows us to harness the benefits of graphene nanoparticles and the excellent lubricity of silicon oil. 30 The presence of lubricants, especially liquid ones like silicon oil, modifies the behaviour of the matrix materials and influences the strength of the friction composites.
A detailed characterization of silicon oil has been conducted to better understand its effects on the overall performance of the friction materials. Given this, there is a need for an in-depth study to investigate the impact of combining bamboo reinforcement with a new matrix and lubrication approach in the development of friction materials. Tribological performance of the developed friction composites was tested according to ASTM G99-95 test standards. 31 Through Taguchi design optimization,32,33 the optimum combination of binder resin with lubricants was determined, which resulted in the lowest Specific Wear Rate (SWR) and a stable Coefficient of Friction (COF). Moreover, ANOVA was carried out to pinpoint and comprehend the notable factors influencing friction and wear performance. Additionally, we utilized scanning electron microscopy (SEM) to examine worn surface micrographs, thereby enhancing our understanding of the friction materials’ performance.
The objective of this research is to create a new friction composite with benzoylated bamboo fiber as reinforcement, phenol-formaldehyde resin, and cardanol in different ratios as binders, and to study the effect of silicon oil and silicon oil-graphene mixture as lubricants on the frictional behavior of the composite material. In addition, the research intends to contribute to the synthesis of environmentally benign and high-performance friction materials for a range of industrial applications, and investigate the viability of silicon oil as a new lubricant in friction composite materials.
Friction composite: Key components & fabrication
Parent materials
Environmentally friendly friction composites were prepared with a predetermined composition of different natural resources. Bamboo fibers from Pseudoxytenanthera stocksii species were obtained from Jawaharlal Nehru Tropical Botanic Garden & Research Institute (JNTBGRI), Kerala, India. To improve their hydrophobicity, bamboo fibers were subjected to benzoylation treatment.34,35 It included soaking the fibers in 5% NaOH solution for 2 h and then washing with distilled water. Then, the fibers were benzoyl chloride treated for 15 min, washed, and dried overnight at 75°C. The treated fibers were kept in vacuum-sealed containers for future use. The benzoylation treatment processes were shown in Figure 1. Chemical modification via Benzoylation treatment.
Grading of the friction composite.
The main task of the binder, which is made of polymer-based resin, is to maintain the structural integrity under thermal and mechanical stresses 36 and to prevent the frictional composites constituents from crumbling apart. The matrix phase transmit force between the reinforcements and arrest cracks from spreading between reinforcements. Right amount of resin imparts adequate integrity to the composite without disturbing other important properties and is required to flow and evenly distribute amongst the other ingredients during manufacture. 37 The volumetric percentage of binder in a formulation varies according to the application and manufacturer but typically around 20%. 38 Phenolic resin is a common material used as a binder in friction pad materials. If excess phenolic based resin is employed, there is a high-temperature friction drop-off; the extent of polymer cross-linking also influences the behaviour of the binder. 39 Cardanol, which is sourced from cashew nut shell liquid, is finding increasing popularity because it is cheap, available in plenty, and has a wide range of uses in coatings, adhesives, and plasticizers.40–42 With a chemical formula of C21H32O, having a phenol backbone and three long carbon chains with double bonds, cardanol provides high temperature stability, flexibility, hydrophobicity, and low permeability. 43 Its chemical modification ease, combined with phenolic compounds, hydroxyl groups, and double bonds, renders it a good phenol substitute in many applications. Studies show cardanol-modified phenolic resins exhibit superior thermal stability compared to pure phenolic resins, offering potential improvements in toughness and heat resistance.44,45 This work aims to arrive at an optimised weight percentage combination of phenol formaldehyde resin with cardanol by different weight percentages out of the 30 wt %. The binder, phenol formaldehyde, was procured from Polyformalin Private Limited, Kochi, Kerala, India and cardanol was procured from Satya Cashew Chemicals Pvt. Ltd, Chennai, Tamil Nadu, India.
Lubricant being a crucial factor in the friction composites and improves the wear resistance and provides consistent friction in frictional composites the remaining 8 wt % was optimised with graphene and silicon oil. Incorporating graphene into silicone oil can lead to improvements in mechanical strength, thermal conductivity, and electrical conductivity, among other properties, contingent upon the concentration and dispersion of graphene within the silicone oil matrix. As this being a novel venture detailed analysis of silicon oil has been carried out. Attaining uniform dispersion of graphene within the silicone oil matrix is imperative for realizing the desired composite material properties. In this study, the sonication method was employed to ensure proper dispersion, which was confirmed through Raman spectroscopy analysis and evaluation of optical microscopic images. The chemical characterization of the optimized graphene–silicone oil-based friction composites (C10S4, C10S8, and pure silicone oil) was performed using FTIR spectroscopy to confirm the presence of key functional groups and assess molecular interactions within the formulations.
Characterization of silicon oil
Viscosity measurement
Viscosity measurement of silicon oil at different temperatures.

Density measurement
Density stands as another vital physical attribute of silicone oil. This study employs a pycnometer test facility to precisely measure the density of silicone oil. Density profoundly influences buoyancy, mixing dynamics, and mass transport characteristics of the oil. The density measured was found to be 1.05 g/cc. This value is consistent with commonly used standard lubricant oils and ensures a stable interface without sedimentation or phase separation, thereby maintaining consistent lubrication over time.
Flash point determination
The flash point, referring to the temperature at which a substance gives off sufficient vapor to burn when subjected to an ignition source, is essential in assessing the safety of silicone oils, especially in friction uses where exposure to high temperatures is likely. In this research, open-cup flash point testers were used to determine the flash point of the silicone oils. The flashpoint that was measured for silicon oil was 316°C with Auto-ignition temperature of >400°C.
The flash point is crucial for safety, especially in high-speed (RPM) and high-load applications where frictional heating can raise the temperature significantly. A high flash point ensures that the oil remains stable and non-volatile under such conditions. This stability helps avoid premature softening of matrix ingredients and prevents excessive wear—highlighted by the performance of the C10S8 combination, which maintained a consistent coefficient of friction (COF) and low wear even under elevated test conditions.
Pour point measurement
The pour point reflects the oil’s flow capability at low temperatures, a crucial aspect for this study given potential exposure to cold environments in applications involving friction materials. The pour point was determined through established methodologies such as ASTM D97. Pour point obtained for silicon oil is < −40°C
Oxidation stability testing
Silicone oils are susceptible to degradation over time, primarily through oxidation, particularly when exposed to elevated temperatures. Oxidation stability tests were conducted to evaluate the oil’s resistance to oxidation and to predict its shelf life and performance under oxidative conditions. A high oxidation stability ensures that the silicone oil retains its lubricating properties over extended periods, reducing the need for replacement and improving the long-term reliability of the composite system. In this study, oxidation stability was assessed using the rotating pressure vessel method (RPVOT) as per ASTM D2272 standard. The induction time took for the pressure to drop by 1.75 bar from an initial oxygen supply pressure of 6.2 bar was found to exceed 90 min.
Tribology of silicon oil
A Four-Ball Tester was utilized to assess the tribological characteristics of the samples in accordance with ASTM D4172 standards. The wear scar diameter (Figure 2(a)) resulting from the interaction with silicon oil on the fixed balls was measured using an optical microscope, Leica make, captured at 10x magnification, as depicted in Figure 2. SEM images of the worn surface of silicone oil sample after four-ball wear testing. (a) Wear scar diameter. (b) Worn surface image of silicone oil sample after four-ball wear testing.
It is observed that the profile of wear scar diameter is elliptical as evident from Figure 2(b), with average coefficient of friction (COF) and wear scar diameter (WSD) of silicon oil were found to be 2.22 and 0.954 mm, respectively. Higher values of coefficient of friction together with elliptical profile corresponds to the elastohydrodynamic regime of lubrication. This supports the higher load carrying capacity of silicon oil, which indicates the suitability of silicon as lubricating component in friction materials.
Friction composite component optimisation
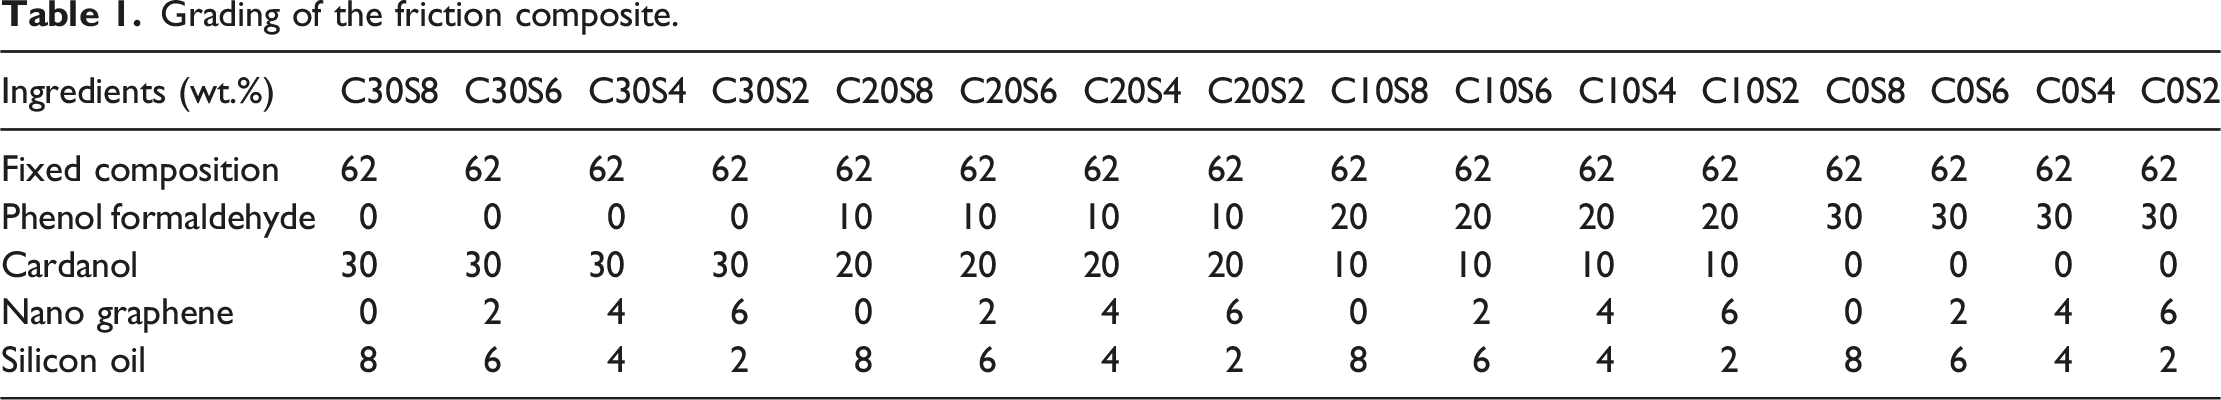
The concentration of graphene within the silicone oil matrix may vary based on the desired properties of the friction materials. Higher graphene concentrations typically yield greater enhancements in mechanical and electrical properties, albeit they may also impact viscosity and processability. These considerations were addressed through an optimization study of graphene in silicone oil. The optimal combination for this study was determined using Taguchi’s experimental design, 13 a standard optimization technique with an L16 array. Other than specific wear rate (SWR), the coefficient of friction (COF) was studied for varying weight percentages of phenol formaldehyde with cardanol as a binder and nano graphene with silicon oil as a lubricant as shown in Table 1.
Design of experiments using Taguchi standard L16 orthogonal array
Factors and levels of factors influencing SWR and COF.

Experimental procedure
To assess the geometric performance of the chosen compositions, we conducted tests using a Pin-on-Disc tribometer (DUCOM, TR-20LE-PHM400-CHM400) following ASTM G99 standards. A track diameter of 120 mm was utilized for a sliding distance of 6.3 km. A grey cast iron rotating disc was employed as the counterpart material against the friction composite. The tribological properties were analyzed by systematically varying key test parameters, as detailed in the Section Friction and Wear Study. The Taguchi L16 design was employed to obtain various combinations with four factors and four levels, as outlined in Table 3.
Fabrication of friction composites
Frictional composite samples for the Pin-on-Disc tribological study were produced using the compression molding technique, following ASTM G99 standards. Initially, graphene was mixed with silicon oil to create a lubricant mixture. This mixture was then combined with the resin part, a blend of phenol formaldehyde and cardanol, using a high-speed shear mixer. Afterward, the leftover ingredients were mixed individually, starting with the fiber reinforcements, followed by the powder fillers, according to the given sequence. The lubricant-mixed resin was then added to this mixture. The entire blend was compressed into composites using a hot compression machine at a temperature of 185°C for 20 min under a pressure of 15 MPa. The resulting composites were post-cured for 3 h at 170°C in a standard oven. 48 This manufacturing process yielded cylindrical composites, or pins, with diameter and length of 10 mm and 40 mm respectively.
Physical and mechanical properties
Theoretical density of the friction composite was calculated by the rule of mixture, while experimental density was measured by Archimedes’ principle. Friction composite specimens were hung in air and water media, and their weights were recorded by a precision balance of 0.0001 g accuracy. The void content, which represents the precision of the fabrication method, was found as the difference between theoretical and experimental densities. The porosity test was carried out according to the JIS D 4418 standard, which defines a standard specimen size of 2 square inches and thickness of 0.125 inches. In fabricated friction composites, porosity is defined as the ratio of volume absorbed to the total volume of the friction material. Water absorption test was performed by maintaining friction composite test samples of size 25 mm square and having a thickness of 5 mm in the ambient condition distilled water for 24 h according to ASTM D 570-98 standard methods. Percentage water absorption was obtained by the before and after weights test. Hardness was measured on a digital hardness tester (Model: TRSN-BD; Fine Manufacturing Industries, India) on the Rockwell-L scale. Measurement procedures conformed to the requirements of the SAE J417 standard.
Characterization of fabricated friction composites
FTIR characterization
The Infrared spectroscopic analysis of friction composites were carried out using the FTIR-IR Prestige-21 (Shimadzu Corporation, Japan)
49
and the results are plotted in Figure 3. FTIR spectra analysis of fabricated composites and pure silicon oil.
Figure 3 depicts the FTIR spectra of silicone oil, a composite with 8 wt. % silicone oil (C10S8), and graphene-silicone oil in a 50-50 ratio (C10S4). The processed composites were crushed to powder and directly used to obtain the ATR spectra. The presence of silicone oil in the fabricated composite is clearly evident from the spectra. The peaks corresponding to CH2 symmetric and anti-symmetric (2946, 2889 cm−1), CH3 stretching (1405 cm−1), Si-CH3 stretching (1253 cm−1), Si-C stretching (1073 cm−1), Si-O stretching (1000 & 862 cm−1), and the deformation vibration of the Si-O-Si band at 783 cm−1, etc., are clearly visible in both composites, although the peaks are slightly diminished in the graphene-containing composites. However, it is worth noting that the vibrational frequency of the peaks corresponding to the deformation vibration of the Si-O-Si bond is shifted to a higher wavenumber (794 cm−1) in the composites. Moreover, there is a prominent shift in the position of the peak corresponding to the CH3 stretching vibration from 1406 to 1427 cm−1 in the composites. These peak shifts clearly indicate a strong interaction between silicone oil and the matrix polymer, and the interaction might occur through the hydrogen atom in the CH3 group of silicone oil. The shift in deformation peaks to a higher wavenumber implies the increased strain of the Si-O-Si chain as a result of the immobilization of the chain onto the polymer during the formation of a uniform coating.
Thermal analysis
Based on TGA analysis (shown in Figure 4(a)) conducted using a Perkin Elmer TGA 4000, the thermal stability of the friction composite was assessed. The analysis revealed a distinctive degradation pattern characterized by three main stages. Initially from 270°C to 335°C, the weight loss was attributed to cellulose degradation within the fiber samples. In the second stage (375°C–505°C), weight loss occurred due to the degradation of the phenolic resin, as reported by Gehlen, Neis.
50
Finally, in the third phase (615°C–700°C), weight loss was associated with the degradation of CaCO3, corroborating findings by.
51
Notably, both thermograms Figure 4(a) and (b)) exhibited similar patterns. Further examination of the thermograms revealed that the incorporation of silicon oil into the composite samples resulted in thermal stability comparable to, or nearly equivalent to, that achieved with graphene. This conclusion, drawn from the analysis, suggests that substituting silicon oil for graphene as a lubricant in friction composites does not compromise the specimens’ thermal stability. Thermal analysis of fabricated composites (C10S8 & C10S2). (a) TGA Plots & (b) DTG Plots.
Dispersion of lubricant
It is crucial to ensure the uniform spread of silicone oil across the composite material. To achieve this, a combination of confocal Raman spectroscopy and optical microscopic imaging techniques is employed. Figure 5(a) displays the Raman spectra of the composite, revealing distinct peaks indicative of the presence of silicone oil. Notably, vibrations associated with silicone oil, such as Si-O stretching vibrations and Si-C2 symmetric and anti-symmetric stretching, are observed below 1000 cm−1, occurring at approximately ∼450, ∼630, and ∼730 cm−1, respectively. Furthermore, peaks between 1080 and 1090 cm−1 suggest the presence of CaCO3 in the composite. A sharp peak at 1583 cm−1 signifies the presence of C = C bonds in other organic components of the composite. Remarkably, despite silicone oil constituting only 8% of the composite, prominent peaks are detected in the spectra, indicating its uniform distribution throughout the material. Processing involving temperature and pressure reduces the viscosity of the silicone oil, facilitating its penetration and formation of a uniform layer within the composite. Subsequent cooling during post-processing and high pressure in the working environment induces a liquid-to-solid transition (glass transition) in the silicone oil, resulting in its transformation into white patches visible in the optical microscopic images (Figure 5(b)). These images depict the solidified silicone oil under high friction and pressure conditions, highlighting its role in enhancing the composite’s properties.
52
Raman spectroscopic and optical microscopic images of C10S8 composite. (a) Raman spectroscopic images. (b) Optical microscopic images.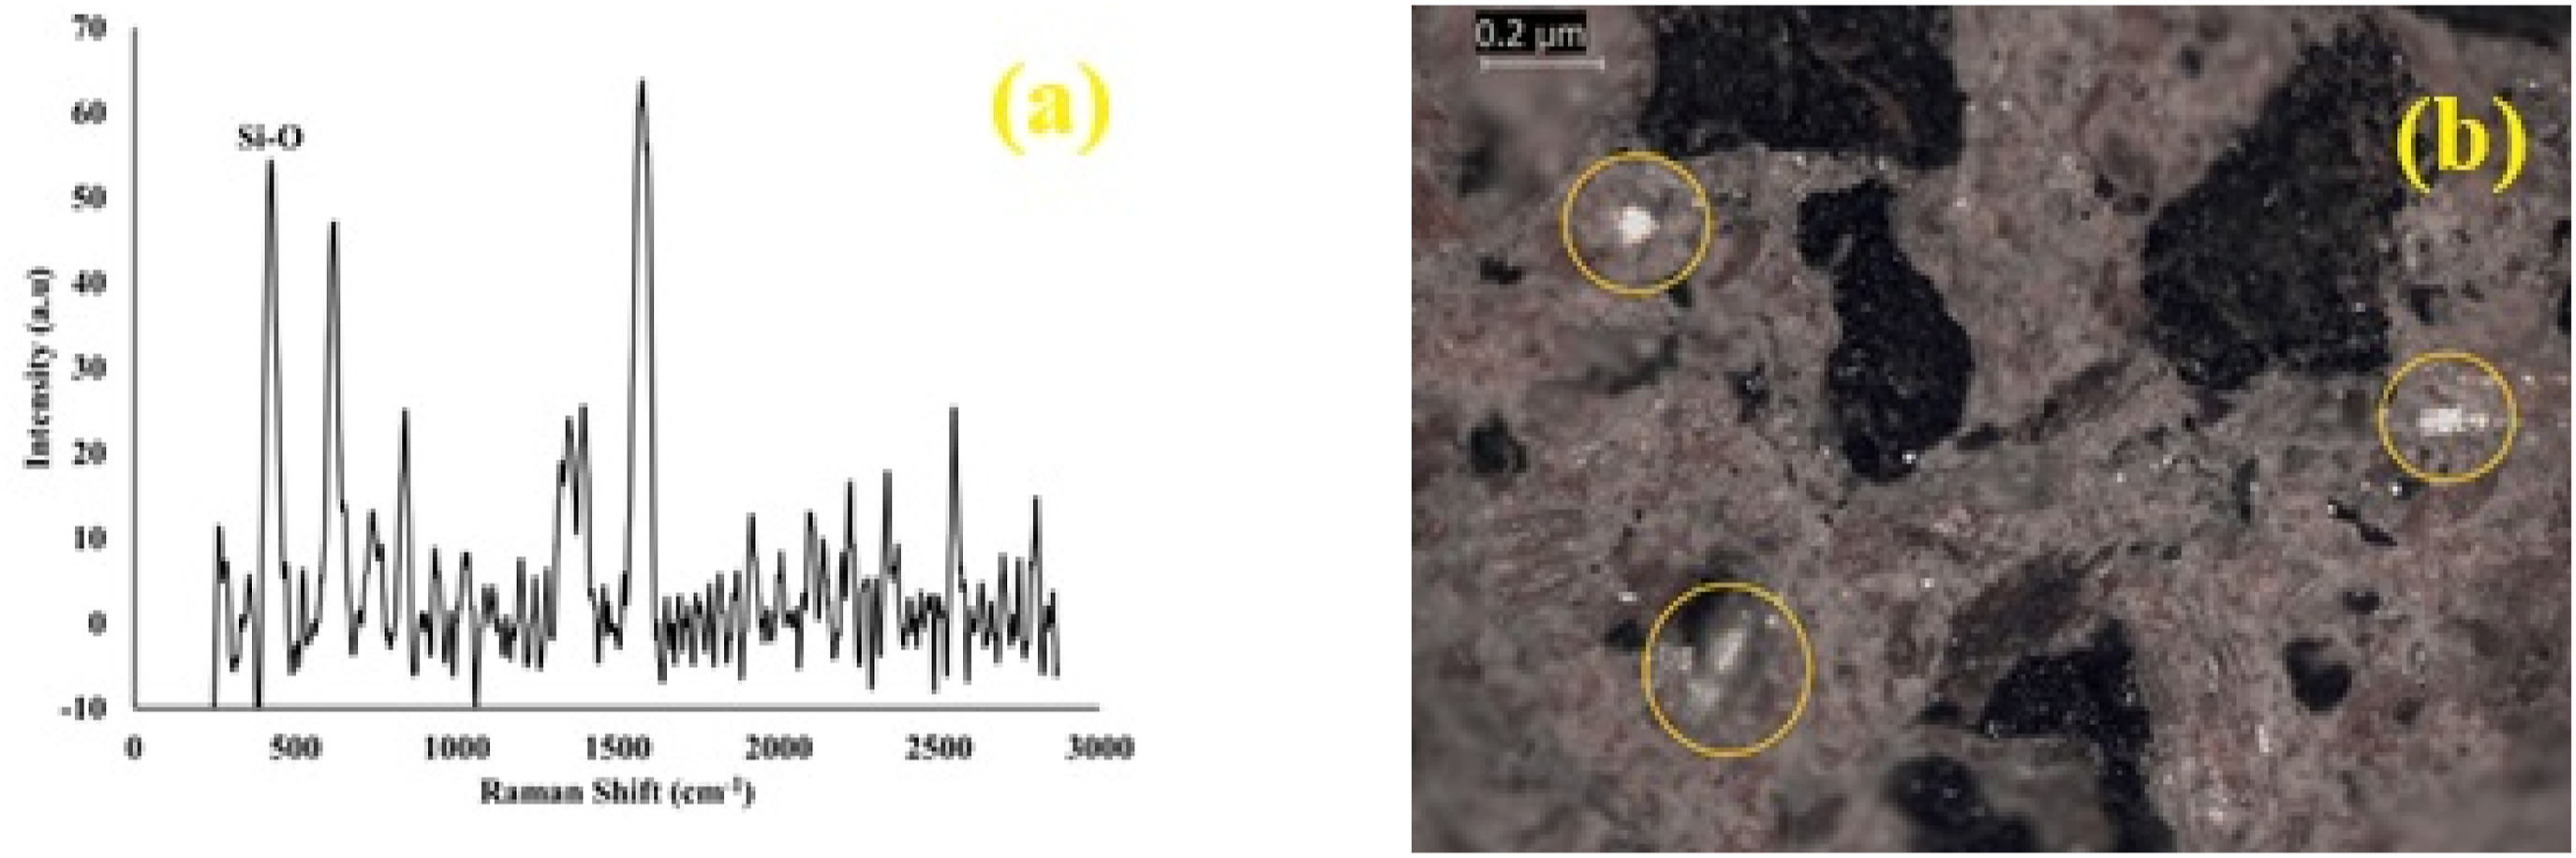
Notably, both C10S4 (containing 4 wt.% nano graphene and 4 wt.% silicon oil) and C10S8 (with 8 wt.% silicon oil and no nano graphene) exhibited comparable tribological performance. However, C10S8 showed slightly superior COF stability and lower specific wear rate as detailed in section 2.9.1. This enhanced performance can be attributed to the higher silicon oil content, which promoted better lubrication and more uniform distribution within the matrix.
In C10S4, partial agglomeration of nano graphene may have limited its reinforcing effect, while in C10S8, the absence of nano graphene avoided such clustering and allowed silicon oil to form a continuous lubricating film. Moreover, the higher concentration of silicon oil in C10S8 improved interfacial bonding and coating uniformity, as confirmed by Raman and FTIR analyses. These findings highlight that beyond mere additive presence, dispersion quality and phase compatibility play crucial roles in tribological behavior. This comparative assessment and the synergistic effects (or lack thereof) are now discussed in more detail in the revised manuscript.
Tribological studies
Friction and wear study
The developed FCs were used for tribological evaluation on a Pin-on-disc tribometer (DUCOM, TR-20LE-PHM400-CHM400) according to ASTM G99 standards. The tests were performed within a load range of 20 N, 40 N, 60 N, and 80 N, with a sliding speed of 1.5 to 4.5 m/s and a sliding distance of 6.3 km. Each sample was subjected to testing for a period of 2100 s, varying speeds (300, 500, 700 RPM) within 700 s. Equation (1) then calculates the Specific Wear Rate (SWR) and equation (2) the Coefficient of Friction (COF). Friction stability, depending on braking pressure and sliding velocity, was measured as a variable with equation (3).


Results and discussions
Physical and mechanical characterization study
Experimental results of physical and mechanical characteristics of formulated composites.

Tribological characterization of fabricated composites
Variation of COF, SWR and frictional stability of fabricated composites were recorded for all compositions, as shown in Figure 6(a)–(c). Variation of Coefficient of friction (COF) at four different normal loads (20 N, 40 N, 60 N, and 80 N) with a sliding distance of 6000 m is depicted in Figure 6(a) for all the 16 combinations of composites fabricated were plotted. It is observed that maximum COF with minimum variation (0.53 to 0.55) is recorded for C10S8 specimen. The C10S8 specimen exhibits uniform stability throughout with high friction stability values ranging from (96%–98%) till the end of sliding, which is evident from Figure 6(c). This may be due to the low hardness value of cardanol-containing resin binder, which makes the friction buildup process fast in the early stages and runs smoothly in the later stages.
55
The consistent values of friction can also be attributed to the silicon oil present in the composite which forms more uniform layer around the PF resin due to the excellent interaction between hydrophobic methyl group of silicon and the aromatic benzene group present in the PF resin. (a) Variation of COF, (b) SWR, (c) frictional stability of 16 fabricated composites (different loading ranges).
During hot pressing at high temperatures, the dynamic viscosity of silicone oil decreases, facilitating its penetration through the composite. This allows the formation of a thin layer of silicon binder around the PF resin. For the composites C0S8 to C0S2 the coefficient of Friction values is high when compared with others and reaches up to 0.61 with high instability. For phenol formaldehyde resin this kind instability of the friction coefficient is usual. 56 It is also observed that for higher concentrations of cardanol (C30 to C20) the friction build up is less, which attributes to the fact that low density of cardanol makes the composites softer as it is also seen from Figure 6(b) that wear is higher for these composites. It is also seen that from Figure 6(c), the frictional stability values are just touching the 90% mark, which indicates the inconsistent friction occurring in these composites makes it unsuitable for frictional applications like brake pads. Hence the C10S8 specimen is chosen for the study for its consistent frictional values.
The coefficient of friction (COF) obtained at four different normal loads (20 N, 40 N, 60 N, and 80 N) and three-disc speeds (1.5, 3, and 4.5 m/s) with a sliding distance of 6000 m for the C10S8 combination (8 wt% of silicon oil and 10 wt% of cardanol), is depicted in Figure 7(a)–(c). At lower disc speeds, as observed in Figure 7(a) such as 1.5 m/s for all load ranges, the performance can be divided into two phases the run-in period and the stabilised phase. It is seen that the more time is taken for all the loads to settle in with a stabilised friction. As the time progresses the pressure applied in the composite induces heat and this heat can decrease the viscosity of silicone oil, facilitating its penetration through the composite. This allows the formation of a thin layer of silicon binder around the resin. A core-shell type of morphology is formed which enhance the lubricating efficiency as well as frictional characteristics by reducing the fluctuation, hence the stabilised region. However, as the disc speed increased (3 and 4.5 m/s), as observed in Figure 7(b) and (c), due to the high pressure the silicon oil spreads faster due to the decrease in its viscosity, hence the run-in period is very small for higher speeds. Generally, pressure is directly proportional to temperature at constant volume, but it does not hold true for binder resin since it is a polymeric material, and COF varies as pressure and speed are varied.
57
But in case of composites with silicon oil a steady trend is observed, which makes this composite suitable for high friction assistive applications like brake pad, where a consistent friction with high percentage of frictional stability is required as provided by silicon composites. This type of behaviour is also seen in the literature studies of Vijay, Singaravelu
58
by the addition of natural barytes as lubricant. The addition of silicon oil (8 wt%) as a lubricant has notably enhanced the consistency of friction by mitigating fluctuations. Under more demanding operating conditions such as higher loads and speeds, we observe a reduction in both the fluctuations in friction and the magnitude of the coefficient of friction (COF). This stabilization in friction performance beyond a certain threshold of load and velocity is often credited to the formation of third-body layers, where lubricants play a pivotal role. Furthermore, the choice of lubricants can impact the thickness of these third-body layers. In sintered friction composites, higher silicon oil content aids in the transfer of material to the disc’s contact surface, resulting in the formation of a silicon-rich third-body layer. This layer, in turn, contributes to an increase in the friction coefficient and a decrease in the wear rate. However, as the load and sliding speed increase, the load-bearing components of the friction pair become overloaded both mechanically and thermally. This leads to a redistribution of shear stresses at the rotating interface, with a greater proportion of these stresses being dissipated through thermal overloading of the contacting asperities. Consequently, this can cause their fracture, ultimately reducing the frictional output. The stability of frictional behaviour is primarily governed by the kinetics of third-body layer formation, with the lubricant silicon oil playing a crucial role in the creation of a uniform friction layer until its eventual breakdown. COF versus sliding distance of C10S8 friction composite at different loading ranges and sliding speeds.
Comparison of tribological properties of natural fiber-reinforced composites.

Taguchi design of experiments 66
Optimization of factors
Minitab software version 20 was utilized to analyse the Specific Wear Rate (SWR) and Coefficient of Friction (COF) across various combinations of factors. These factors included Binder (Phenol Formaldehyde at 0%, 10%, 20%, 30% weight concentrations, and Cardanol at 0%, 10%, 20%, 30% weight concentrations) as well as Lubricant (Graphene at 0%, 2%, 4%, 6% weight concentrations, and Silicon oil at 2%, 4%, 6%, 8% weight concentrations) shown in Table 1. The optimal levels suggested by the Taguchi optimum design for SWR and COF were derived from the respective main effects plots for Means. Figure 8(a) and (b) depict the main effects and interaction plots for the Specific Wear Rate across the four control factors. The results indicated that the minimum SWR was observed at the following combination of factors: Binder consisting of 20% Phenol Formaldehyde and 10% Cardanol, along with a Lubricant composition with a maximum of 8% Silicon oil (referred to as specimen C10S8). Main effects plot and interaction plots for Means for SWR. (a) Main effects plot. (b) Interaction plots for Means.
The main effects and interaction plots illustrating the Coefficient of Friction (COF) for the control factors at all levels are depicted in Figure 9(a) and (b). These figures highlight that the lowest COF for the composites was observed with the following combination of factors: a Binder comprising 30 wt% cardanol and a lubricant consisting of 6 wt% graphene and 2 wt% silicon oil. However, upon comparison with the Specific Wear Rate (SWR) plots, it’s evident that this combination resulted in higher SWR compared to other combinations. To achieve stable COF with minimal SWR in friction scenarios, it’s necessary to explore other viable options from the plots (Figure 9(a)). Through analysis of the plot, a feasible combination of factors was identified: a Binder composed of 20 wt% Phenol Formaldehyde and 10 wt% Cardanol, coupled with a Lubricant containing a maximum of 8 wt% silicon oil (referred to as specimen C10S8). These results are more compatible with the SWR analysis and offer a promising solution for achieving both stable COF and reduced SWR in friction scenarios. Main effects plot for Means and interaction plots for Means for COF. (a) Main effects plot for Means. (b) Interaction plots for Means.
Response table for means for SWR.

Response table for means for COF.

ANOVA for specific wear rate.

ANOVA for coefficient of friction.

Seq. SS = Sequential Sum of squares, Adj. SS = Adjusted Sum of Squares, Adj. MS = Adjusted Mean Square, DF = Degree of freedom F = Ratio of explained variance to unexplained variance, P = Probability of obtaining F value.
Analysis of variance (ANOVA)
ANOVA (Analysis of Variance) is a statistical method used to assess the contribution of binder and lubricant in determining the performance characteristics, namely Specific Wear Rate (SWR) and Coefficient of Friction (COF). The significance of each control factor is determined by comparing the P-values associated with them. A P-value less than 5% indicates that the effects are significant. Table 8 presents the ANOVA analysis of SWR. The P-values in the table indicate whether the main effects are significant or not. The results suggest that both binder and lubricant significantly affect SWR. Specifically, the binder contributes the most to the SWR results, accounting for approximately 83.7%, followed by the lubricant, which contributes around 3.88%.
Table 9 summarizes the ANOVA analysis of COF for the composites. Similarly, it reveals that the main effects of both binder and lubricant are statistically significant. The analysis shows that the binder contributes the most to the COF results of the composites, explaining approximately 81.60% of the variation, followed by the lubricant, which contributes around 2.27%.
Response optimization: SWR, COF
Solution of general linear model (ANOVA) for SWR and COF.

Morphological study
Micrographs of the worn surfaces of the test specimens, both before and after wear testing, were captured using a Scanning Electron Microscope (JEOL JSM-IT510) in conjunction with a Pin-on-disc setup. The wear mechanism observed in polymer matrix composites encompasses various modes, including fiber pullouts, fiber-matrix debonding, formation of matrix debris, matrix cracking, and the development of contact plateaus.
SEM micrographs presented in Figure 10 illustrate the morphology of C10S8 (Figure 10(a)) and C10S4 (Figure 10(b)) before and after friction testing. In the current composite, graphene nano sheets (GNS) are uniformly dispersed, forming a smooth, protective layer between contacting surfaces. This layer effectively shields susceptible surfaces, ensuring uniform coverage across the contact area. Additionally, the high thermal conductivity of GNS dissipates friction-generated heat, mitigating ingredient degradation and preserving surface integrity. Post-friction testing SEM images reveal a smooth composite surface (Figure 10(d)), indicating the formation of a thin layer of graphene nanomaterials within the composite. While non-coherent transfer layers contribute to the coefficient of friction (COF) and increased wear, secondary contact plateaus are also evident (Figure 10(d)). In the C10S8 composite, the presence of silicone oil leads to a liquid-to-solid transition (glass transition) under high pressure, resulting in the formation of white patches in the microscopic images (Figure 10(b)). Consistent and prominent contact plateaus are observed in the micrograph of C10S8, potentially reducing specific wear rate (SWR) and maintaining a lower yet acceptable COF. This improvement is attributed to enhanced interfacial fiber-matrix bonding compared to C10S4. Furthermore, the reduced amount of wear debris in C10S8 is indicative of improved fiber-matrix bonding, contributing to the observed SWR (Figure 10(b)). Thin, significant transfer layers help maintain desirable and consistent COF values.
67
SEM micrographs of fabricated composites (Before and after wear test). (a) C10S8 - Before test. (b) C10S8 - After Test. (c) C10S4 - Before test. (d) C10S4 - After Test.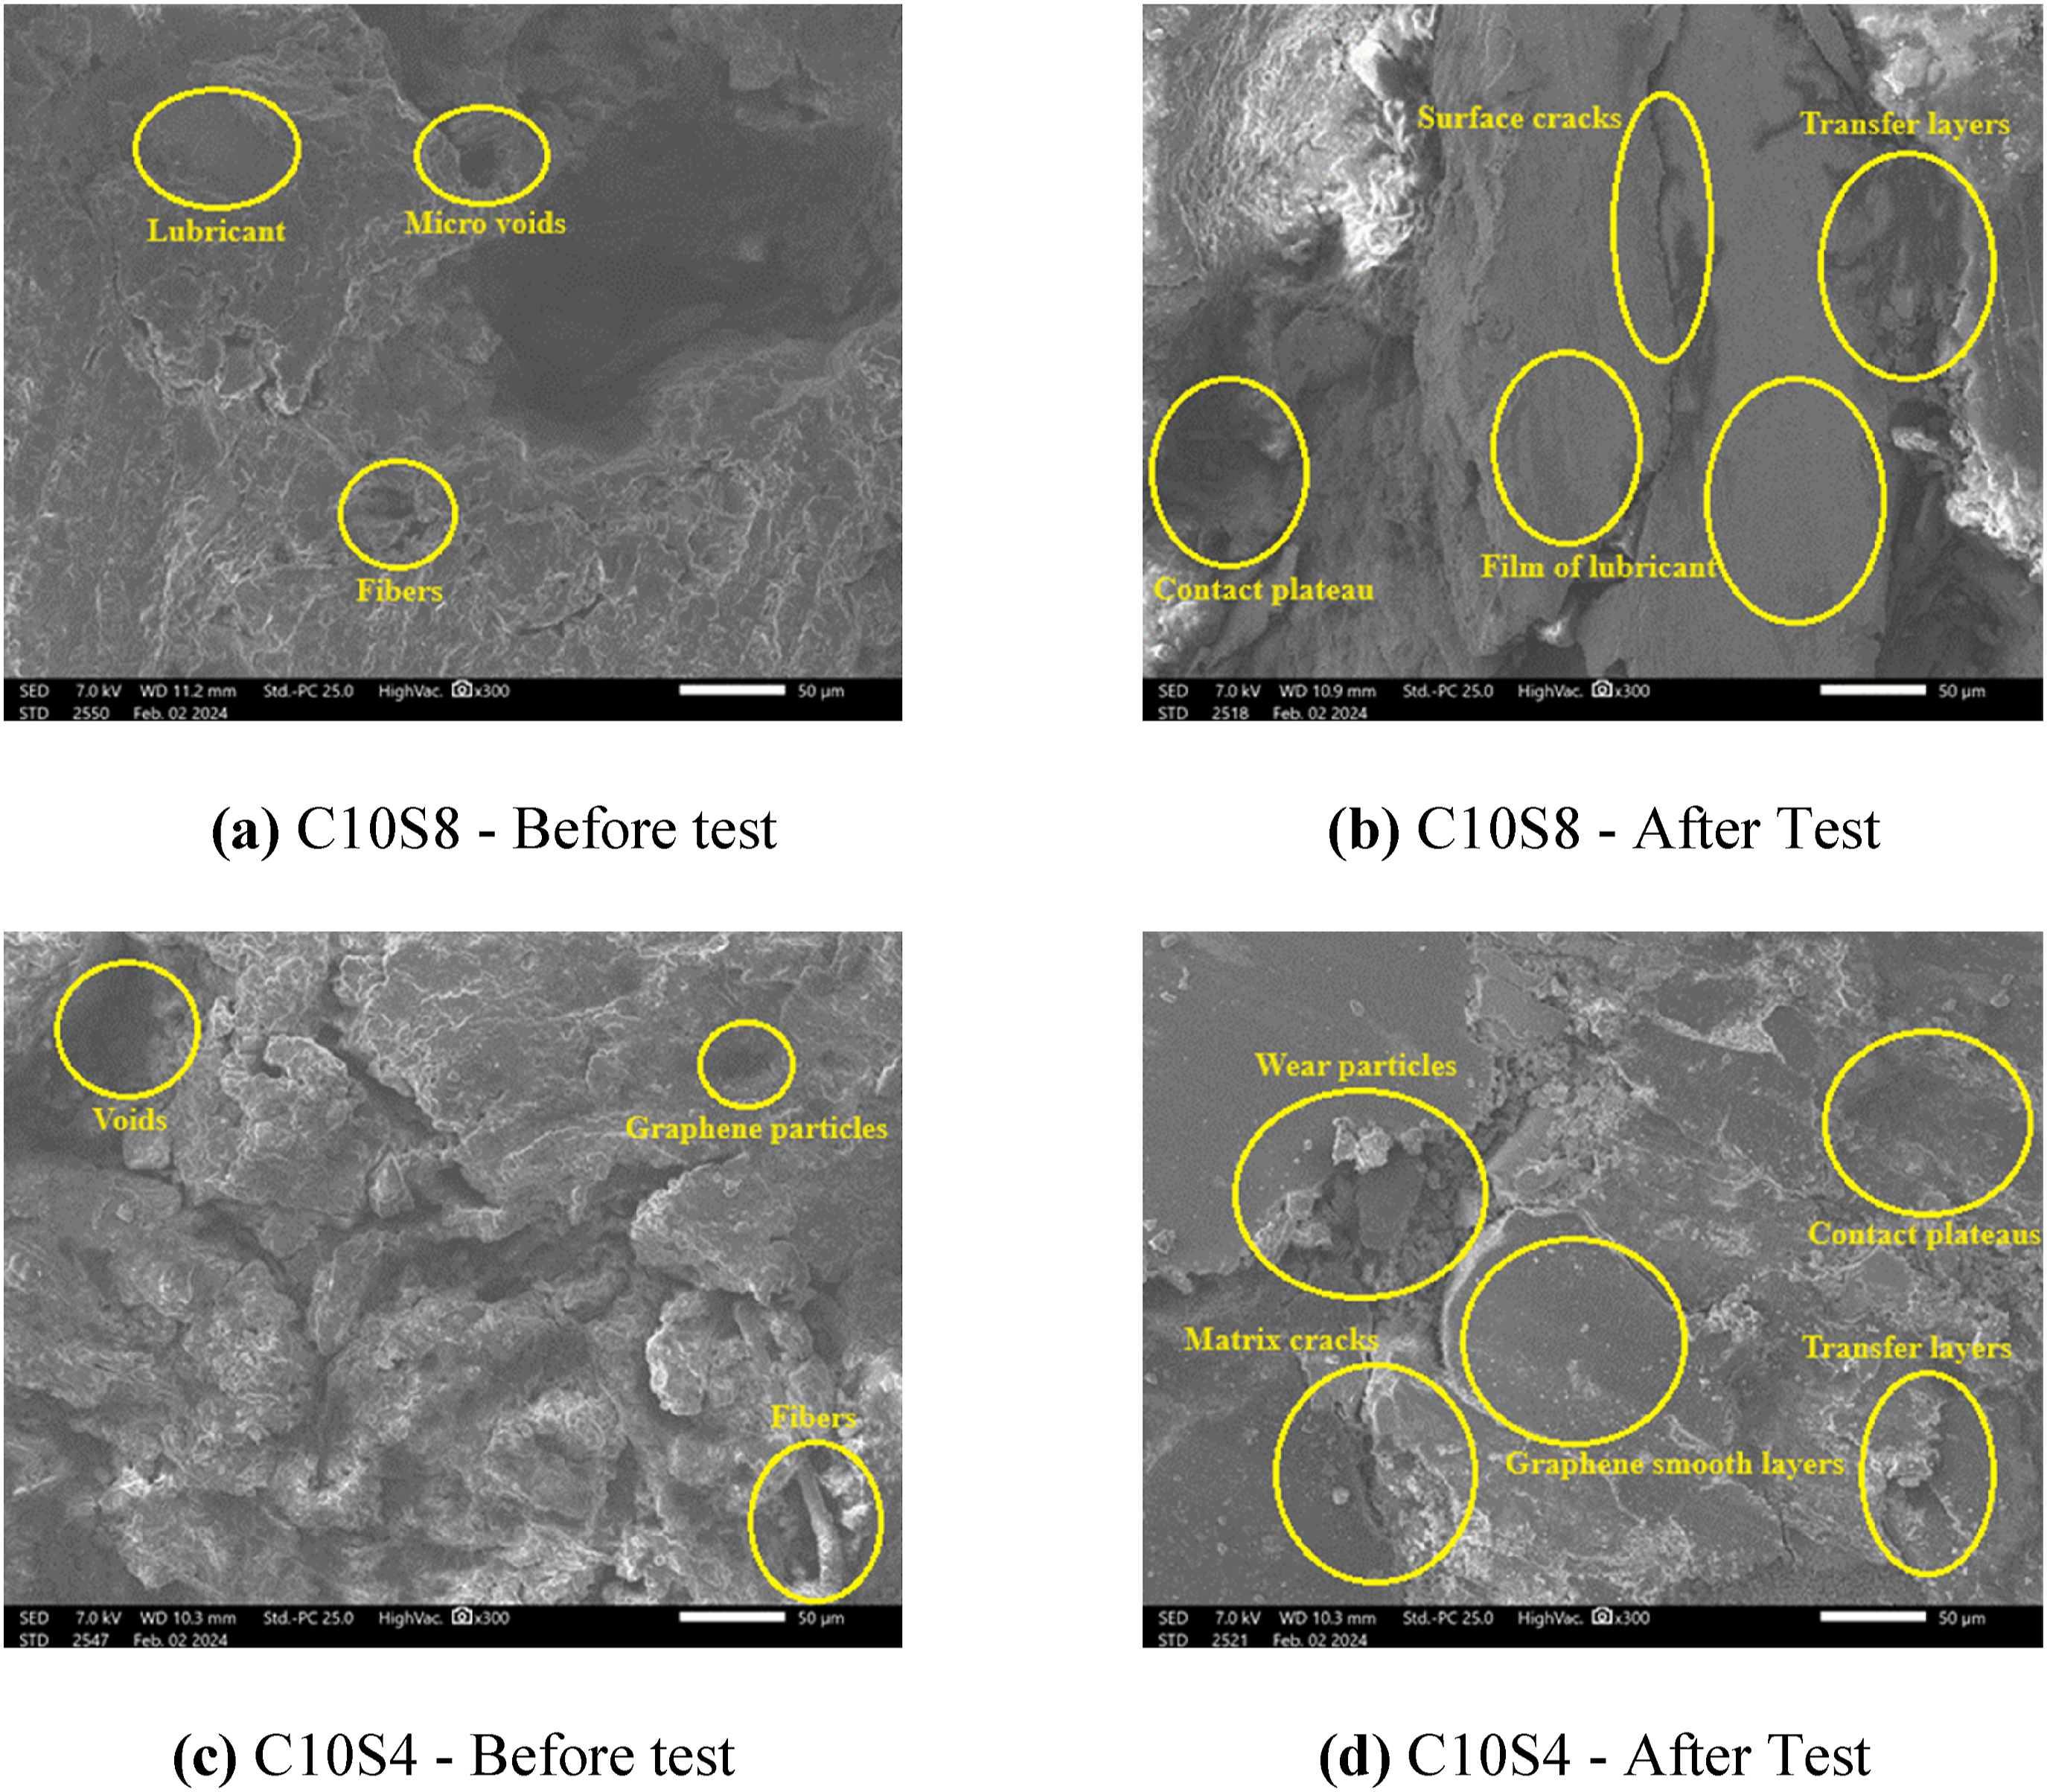
Conclusion
This study focuses on developing eco-friendly friction composites using non-toxic and biodegradable materials, particularly benzoylated Pseudoxytenanthera stocksii (P. stocksii) bamboo fibers within a polymer matrix. The aim is to enhance thermal behavior by incorporating silicon oil as a lubricant, while also exploring the impact of adding cardanol as a resin. To achieve this, we utilized Taguchi standard L16 Orthogonal Array for Design of Experiments. Given the novelty of incorporating silicon oil, we conducted a thorough Characterization study, assessing its viscosity, density, flash and pour point, and oxidation stability. We also investigated wear scar diameter using a four-ball tester. The analysis of wear and friction properties revealed that these composites offer promising alternatives to traditional friction materials. We conducted tests adhering to ASTM G99 standards and executed pin-on-disc tribological tests to evaluate composite performance comprehensively. By incorporating nano graphene with silicon oil, we optimized friction performance across various temperature ranges. Characterization studies highlighted the impact of silicon oil on composite behavior, while tribological evaluations identified the optimal combination of binder resin and lubricants. Using Taguchi design of experiments ensured robustness, with results validated through ANOVA analysis. The C10S8 combination (8 wt% silicon oil and 10 wt% cardanol) emerged as optimal, consistently exhibiting a coefficient of friction with 95% stability and reduced wear rate. Scanning electron microscopy provided valuable insights into worn surface morphology, supporting our findings. Overall, this study underscores the potential of eco-efficient friction composites for applications requiring sustainable, biobased materials with desirable wear and friction characteristics, driving advancements in greener technological solutions in the field of friction materials.
Footnotes
Ethical considerations
We affirm that our current research adheres to ethical standards.
Funding
The authors received no financial support for the research, authorship, and/or publication of this article.
Declaration of conflicting interests
The authors declared no potential conflicts of interest with respect to the research, authorship, and/or publication of this article.
Data Availability Statement
Upon reasonable request, the data utilized in this study will be provided.