
Abstract
Accurate classification of waste textiles is a crucial prerequisite for their efficient recycling, especially in the fields of industrial waste processing and textile recycling, where more precise identification and classification are required to achieve effective resource reuse. However, current traditional methods for waste clothing classification are inefficient, not only time-consuming and labor-intensive for manual sorting but also accuracy recognition-lacking, unable to meet the demands of large-scale processing. Furthermore, traditional methods often incur high operational costs, including labor, equipment, and maintenance expenses, thus failing to satisfy the requirements of low cost and high efficiency in the recycling system. This study introduces a novel method for the identification of waste textile materials using near-infrared (NIR) spectroscopy, based on an enhanced Convolutional Neural Network (CNN) model named FabricNet. The collected NIR spectral data were preprocessed using moving average filtering (MAF) for smoothing and normalization. The FabricNet model integrates the ResNet-18 architecture, Squeeze-and-Excitation (SE) attention mechanism, and Dropout regularization techniques. Experimental results demonstrate that, on a dataset comprising 280 fabric samples (including 11 pure textiles, 22 binary blends, and 31 multi-component blends), the validation accuracy of the FabricNet model reached 97.31%, significantly outperforming other common CNN models such as AlexNet, VGGNet, and GoogleNet. Furthermore, when tested on an independent set of 120 textile samples not used in the training, the model achieved recognition precisions exceeding 95% for pure textiles and over 90% for blended textiles. This method provides a viable and effective technological pathway for the automated classification of waste textiles, significantly enhancing their recycling rates.
Keywords
Introduction
Waste textiles can be classified into waste chemical textiles and waste natural fiber textiles according to their raw material types. 1 Chemical fiber textiles account for approximately 70% of the total waste textiles. 2 China, as the world’s largest producer of chemical fibers, contributes 77% to the global output of major fiber-producing regions. 3 As a populous country and a major producer and consumer of textiles, China generates about 20 million tons of waste textiles annually, of which 53% are polyester and 30% cotton. 4 However, only about four million tons of waste textiles are recycled, with a recovery rate of only 20%. 5 With the continuous improvement of people’s living standards and the gradual change in consumption concepts, textiles are being updated and replaced more frequently, resulting in shorter lifecycles for civil textiles. 6 Nearly half of the clothing in China has a lifecycle of less than 3 years, and about 40% of consumers discard five or more pieces of clothing each year, generating a huge amount of waste textiles and causing significant environmental pressure. 7
In the context of the global surge in textile waste, the management and recycling of discarded textiles have emerged as a critical challenge. This issue is particularly pressing in the European Union (EU). The EU generates 12.6 million tonnes of textile waste annually, with clothing and footwear alone accounting for 5.2 million tonnes, equivalent to 12 kg of waste per person per year. Currently, only 22% of post-consumer textile waste is collected separately for reuse or recycling, while the remainder is often incinerated or landfilled. To address this challenge, the European Commission, on July 5, 2023, proposed new rules aimed at making producers responsible for the full life cycle of textile products and supporting the sustainable management of textile waste across the EU. The proposal also promotes research and development into innovative technologies for the circularity of the textiles sector, such as fiber-to-fiber recycling. 8
At present, countries that are major producers and consumers of textiles, such as China, face significant challenges in managing and recycling discarded textiles. Statistical data show that more than 90 million tons of textile waste are generated globally each year, with China accounting for over 20% of this total. 9
At the same time, the recycling amount of waste textiles in China has increased year by year. Affected by COVID-19 and other factors, the recycling volume declined slightly to 4.15 million tons in 2022, representing a 12.6% decrease compared to 2021. However, it still showed a cumulative increase of 1.55 million tons compared to 2015, with an overall growth rate of 59.62% over this 7-year period. Drived by a series of preferential policies, China’s waste textile recycling volume in 2023 is 4.8 million tons, an increase of 15.7% over the same period last year. Figure 1 shows the changes in the annual recycling volume of waste textiles in some countries and the annual production of chemical fibers in major countries.
10
Trends in annual recycling volume of used textiles in China, USA, EU - 27 (European Union - 27. From 2016 to 2020, it included all 28 EU member states. From 2021 to 2022, it refers to the 27 member states after the UK’s exit.) (A).13–16 Annual production of chemical fibers in major countries of the world (B)
12
.
Enhancing the efficiency and accuracy of waste textile classification not only mitigates resource wastage but also significantly alleviates environmental pressure.
Currently, numerous countries and regions are vigorously promoting the recycling and reuse of waste textiles. Notably, the Chinese government has implemented a series of preferential policies aimed at encouraging and supporting the recycling of waste textiles. In March 2022, the National Development and Reform Commission, the Ministry of Commerce, and the Ministry of Industry and Information Technology jointly issued the Implementation Opinions on Accelerating the Recycling of Waste Textiles (NDRC Circular No. 526 [2022]). 11 This document clarifies the development goals of waste textile recycling for the first time: By 2025, a preliminary recycling system for waste textiles will have been established, accompanied by a substantial enhancement in recycling capacity, and the recycling rate of waste textiles will reach 25%, with a production of recycled fiber reaching two million tons. Subsequently, by 2030, a relatively comprehensive waste textile recycling system should have been successfully put in place, ensuring a more sustainable and efficient approach to textile waste management. 12 The sorting of waste textiles is the premise of their high-value-added utilization. Different components of waste textiles require different regeneration treatment methods. Therefore, the first step in the reuse of waste textiles is to scientifically and accurately identify and sort them based on factors such as their composition, color, and weaving method, etc. In this context, the term ‘weaving methods’ refers to various textile production techniques, including but not limited to weaving, knitting, and the manufacturing of non-woven materials. Weaving involves interlacing two sets of yarns (warp and weft) at right angles to form a fabric. Knitting involves looping a single yarn or a set of yarns together to form a fabric. The manufacturing of non- woven materials involves bonding fibers together by mechanical, thermal, or chemical means to form a fabric without the use of interlacing or looping.
The traditional textile composition analysis methods include the following: chemical dissolution method, microscope method, melting point experiment method, etc. The principle of chemical dissolution method 17 is to test blended fiber products after qualitative analysis, select the appropriate reagent to dissolve one of the components, weigh the quality of the remainder, and calculate the content of the dissolved part through the difference, While this method is accurate, it requires the use of large quantities of toxic and harmful chemicals, thus posing threats to the environment and the health of operators. The microscope method 13 is to study the transverse and longitudinal section of various fibers, through the change of its texture and the appearance of the form of physical identification. This method is suitable for single-component fibers but is less effective for multi-component fiber blends. The combustion method 18 can determine fiber types by analyzing four key characteristics: combusting difficulty, thermoplastic behavior, odor released during combustion and the characteristics of the ash after burning. While straightforward and rapid, this method exhibits com-promised accuracy with high susceptibility to external factors. 19 The aforementioned methods show critical limitations including long detection cycle, stringent environmental controls, hazardous chemical usage, sample destruction, and elevated costs. Although standardized methods for textile fiber identification and quantitative analysis — such as electron microscopy and chemical dissolution (GB/T 2910-2009 textile quantitative Chemical Analysis) 20 —have been established as national standards. Their time-intensive procedures and reliance on specialized solvents limit widespread adoption in the waste textile sector.
Comparison of identification methods of waste textiles.
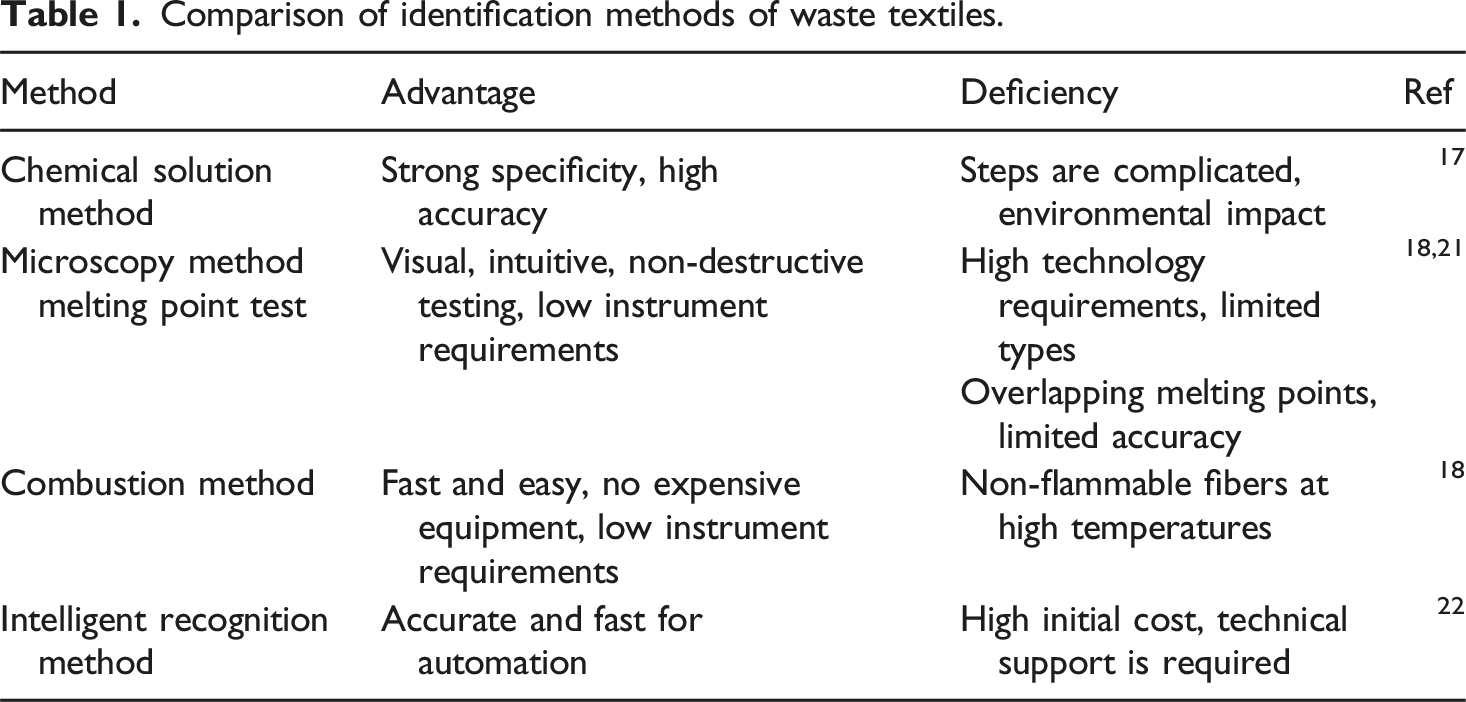
Intelligent detection and recognition algorithm have been applied in many fields of textile and clothing. By developing a texture feature analysis framework based on camera-captured cloth images, Xu Zhiwen et al. 24 Implemented vision technology for automated defect detection in textile materials. Zeng Zirui et al. 25 designed a germ fabric defect detection algorithm (YULU algorithm) based on the YOLOv3-Tiny algorithm, which realized high-precision, real-time and low-cost germ fabric defect detection. Based on deep learning technology, Li Yang et al. 26 designed and realized a clothing style recognition and retrieval system for ordinary users to help users quickly find their favorite clothing style. The support vector machine (SVM) algorithm based on HOG features by Yang Fan et al. 27 realized the identification and classification of seam defect categories. In other fields, intelligent recognition algorithms also have many applications. Du Jian et al. 28 Studied the convolutional neural network model (CNN) to extract the spectral features of macadamia fruit based on the analysis of the spectral features of macadamia fruit in the vision-near infrared and proposed an efficient non-destructive method to identify the quality of macadamia fruit. Xiao Hengyu et al. 29 enhanced the double branch network of deep neural network based on CNN to realize fast and accurate tree species identification, which provides important guidance for ecosystem analysis. Intelligent detection and recognition algorithms are rarely used in waste clothing classification. Convolutional neural network (CNN), as one of the most widely used deep learning networks models, has stronger feature extraction and model expression capabilities than shallow learning methods, and has great potential 30 for application in spectral data. However, conventional visual recognition methods relying on one-dimensional spectral data face inherent limitations, as convolutional neural networks (CNNs) struggle to capture intrinsic correlations within the spectral sequences. In contrast, two-dimensional spectral maps inherently contain richer spatial features 31 that enable more effective extraction through CNN architectures. Therefore, it is decided in this study that by using two-dimensional spectral, not only can spatial information of spectral data be extracted, but also original spectral features can be extracted more effectively, to improve the overall recognition accuracy and efficiency. At present, China’s current textile waste sorting remains predominantly manual, relying on tactile, visual, combustion, and olfactory identification methods. Their main shortcomings are low efficiency, low accuracy, and there is a threat to the health of sorting personnel, easy to cause fire and 32 so on. Therefore, based on CNN convolutional neural network and two-dimensional infrared spectrogram, this study proposes an improved convolutional neural network model named FabricNet to solve the problems of low efficiency and low accuracy of waste clothing sorting.
This paper focuses on the application of intelligent detection and recognition algorithms in the textile and clothing industry, particularly for the challenge of waste textile classification. The main objective is to propose an improved model, FabricNet, which combines near-infrared spectroscopy and convolutional neural networks (CNNs) to enhance the efficiency and accuracy of waste textile classification. By establishing a standard spectral sample library, conducting sample analysis, and building the model, this research aim to validate the effectiveness of FabricNet. Specifically, this paper will compare FabricNet with other common CNN models to demonstrate its advantages.
Currently, there is a need for more effective and efficient methods for classifying waste textiles. Existing approaches often suffer from low accuracy and high computational costs, making them impractical for large-scale applications. To address these challenges, our proposed FabricNet model integrates near-infrared spectroscopy with advanced CNN techniques. This integration not only improves the accuracy of waste textile classification but also reduces computational costs, making it a more practical solution for real-world applications. Our goal is to provide a new technological means for the efficient classification of waste textiles, thereby promoting their recycling and reuse and contributing to sustainable resource management.
Materials and methods
General framework
In this study, we developed a comprehensive research framework that covers the entire process from data acquisition to model optimization (see Figure 2). First, this research acquired spectral data directly by using near-infrared (NIR) spectroscopy from samples of waste textiles. Following data acquisition, we performed spectral data preprocessing, including MAF smoothing, normalization, and feature enhancement, to ensure the quality and consistency of the data. Based on this preprocessed data, we constructed a comprehensive spectrum dataset for subsequent model training and validation. Overall framework of research methods.
To evaluate different models’ performance, this research utilized several classical deep learning architectures, including AlexNet, VGGNet, GoogleNet, and ResNet. Through rigorous performance analysis and comparison of these models, we identified the most effective configurations.
Finally, this research further optimized and validated the selected models through case studies (model improvement through case validation), to ensure their and reliability in practical applications. This series of steps forms the core framework of our research methodology, providing a robust foundation for future studies.
It is worth mentioning that in this study, industrial waste refers to the materials generated at various stages of clothing production. These include, but are not limited to, fabric defects, cutting waste, production errors, and unsold items. Industrial waste is a significant component of the overall waste textile stream and poses unique challenges in terms of sorting and recycling. The inclusion of industrial waste in our study ensures that the proposed FabricNet model is robust and applicable to a wide range of textile waste sources, enhancing its practical utility in the industry.
Construction of waste textile sample library
In the measurement process of NIRONE Sensor S2.0 near infrared spectral sensor, due to the complexity and heterogeneity of textile materials, a single measurement often cannot fully reflect the spectral characteristics of the fabric. There may be local variations on the fabric surface, such as uneven fiber distribution, variations in dye concentration, or contamination. These factors can lead to deviations in the results of single - point measurements. Therefore, to make the established model more robust and generalized, the same fabric sample is measured several times, and a total of more than 1000 spectral graphs are obtained, which constitute the sample data set. The samples are made of standard fabrics without any treatment. To clarify, this refers to fabrics that are manufactured under standard conditions and have not undergone any additional treatments. Choose 5 different test points (center and four corners) on each sample, each with a clear category label. After field research, several businesses and clothing stores were visited.
To better understand the variety of fabrics used in real-world applications, field investigations were conducted, including visits to multiple textile businesses and cloth- ing stores. Through this process, it was observed that fabric designers often select materials based on specific functional and aesthetic needs. For example, socks require good breathability and comfort, which typically calls for a higher cotton content, but they also need to be strong and abrasion-resistant, thus necessitating the addition of polyester. These practical demands lead to a wide range of fiber blending combinations, further emphasizing the need for a flexible and accurate identification model.
To address the specific needs of industrial waste textile classification, this study selected 64 pure and blended fabrics that are commonly found in the industrial production process or have special and representative properties. The selection criteria included the prevalence of the fabrics in industrial waste textiles and their significance in recycling and reuse processes. Specifically, the fabric groups include: • Cotton: Chosen for its high frequency in industrial waste textiles and its importance in recycling due to its biodegradability and potential for reprocessing. • Polyester: Selected because it is one of the most common synthetic fibers in industrial waste textiles and poses significant challenges in recycling due to its non-biodegradable nature. • Wool: Included for its excellent thermal insulation properties and its common use in winter clothing, making it suitable for certain recycling processes. • Blends (e.g., cotton-polyester, wool-polyester): Chosen to represent the complexity of real-world industrial waste textiles, which often contain mixtures of different fibers. These blends are particularly challenging to sort and recycle, making them an important focus of our study.
The 280 samples were divided into 64 categories, all of which originated from fabrics commonly used in the industrial production process. This selection ensures that the study covers a broad spectrum of textile materials, providing a comprehensive evaluation of the FabricNet model’s performance across different types of industrial waste textiles. See Appendix A for a detailed list of the selected fabrics.
Analysis of waste textile samples
The original spectra collected were near-infrared (NIR) spectra, with a wavelength range from 1550 to 1950 nm. In this study, one-dimensional spectral data were directly utilized to plot the input spectral data spanning from 1550 to 1950 nm. The spectral data underwent smoothing and normalization to enhance data quality.
For the Convolutional Neural Network (CNN) input, a spectral map was used as the input data. The input data dimensions were set to H x W x C, where H represents the height, W represents the width, and C represents the number of channels. In this case, the number of channels was set to 3, corresponding to the red, green, and blue (RGB) channels of the image. To reduce computational complexity, we simplified the spectral maps by filling the area below the spectral lines with black. This transformation achieved a visual shift from “line” to “shape,” which simplifies the image structure and reduces the computational burden on the model.
Additionally, to improve the model’s ability to capture key features, the contrast between black and white was utilized. This contrast enhances the visual expressiveness of the spectral maps, making the contours and peak positions of the spectral curves more prominent. Consequently, the model can more effectively extract and utilize these key features.
Experimental research revealed that spectral maps of textiles made from different materials exhibited significant differences, whereas spectra from the same material showed high waveform similarity. Initially, we employed ResNet to classify the spectral map dataset; however, the accuracy was unacceptably low, likely due to non-prominent features resulting from the fine spectral lines.
To address the issue of non-prominent features caused by thin spectral lines, this research applied shape processing to fill the area below the spectral lines with black. This transformation converted the spectral lines into filled shapes, which enhances the visibility of the features and facilitates better feature extraction and abnormal spectrum analysis (as shown in Figure 3(A)). The black-filled regions highlighted the contours and peak positions of the spectral curves, reducing background noise interference on model predictions. (A) Graphic Preprocessing, (B) Abnormal Spectral Map (Polyester), (C) Abnormal Spectral Map Samples (Mesh), (D) Abnormal Cause Analysis.
In our experiment, the dimensions and color patterns of the fabrics significantly influenced the recognition process. To mitigate the impact of size on the recognition process, this research standardized the fabric dimensions to 10 cm × 10 cm, ensuring consistency in sample sizes. For most fabrics, color does not notably affect the spectral shape and thus does not impact the recognition accuracy. However, in certain special cases, the type and surface characteristics of the fabric can lead to spectral anomalies. For instance, mesh fabrics and those with smooth, reflective surfaces exhibit unique spectral patterns that differ from other fabrics. These exceptional cases require further consideration during the inspection process.
To further validate the influence of these factors, this research conducted additional experiments on fabrics with different color patterns and types. The results indicated that, although irregular color patterns generally do not affect recognition accuracy, special cases (such as mesh and smooth fabrics) require more sophisticated image processing techniques to achieve accurate classification. Additionally, this study performed an anomaly analysis on the spectral data (as shown in Figure 3(B), which illustrates anomalous spectral graphs). The analysis revealed three anomalous polyester spectral samples. Figure 3(C) presents an example of an anomalous polyester spectrum caused by the mesh structure of the fabric. Figure 3(D) systematically analyzes the possible causes of spectral anomalies: the primary cause is related to the mesh fabric structure, where insufficient probe contact area leads to inaccurate transmittance measurements; the secondary cause is due to the fabric’s glossiness, which produces specular reflection and affects the accurate determination of transmittance.
By thoroughly analyzing these anomalies, this research can better understand the limitations and technical challenges of spectral measurements for different fabric types and provide strategies for improving the accuracy and reliability of spectral data.
Construction of intelligent identification model of waste textiles
In this study, a convolutional neural network is chosen as the basic network, which is generally composed of an input layer, a convolutional layer, a pooling layer and fully connected layer. Although convolutional neural networks perform well in image processing and feature extraction, they still have some limitations in processing infrared spectral data. Especially when it comes to identifying and distinguishing wave peaks in the infrared spectrum, the sensitivity of the traditional CNN model is not enough to accurately capture these key features. To increase the sensitivity of the model to the characteristics of wave crest shape information, the SE (Squeeze and Excitation) block is introduced to enhance the mutual relationship between the channels.
By learning the importance weight of each channel, the SE block can amplify useful features and suppress useless features. The blackened infrared spectrum contains some information or noise unrelated to the shape of the wave crest, while the SE block can well suppress redundant information and amplify useful crest shape features. The SE block first receives input information X and maps it to feature U through a transformation function F (usually a convolution operation). The feature U is then “squeezed”, which is a process of global averaging pooling, to compress the two-dimensional feature graph (H × W) of each channel into a numerical value, resulting in a vector containing all the channel information. Next, the compressed feature vector passes through an “excitation” layer, which usually consists of two fully connected layers with a nonlinear activation function in the middle, which can be understood as an adaptive gating mechanism to learn the importance weight of each channel. The learned weights are then applied to the original feature U, equivalent to reweighting each channel to highlight the important ones and suppress the less important ones. Finally, the recalibrated feature is the final output of the SE block, which can be fed directly into the next layer 33 of the network.
To improve the lightweight of the network model, this study chose RESNET-18, the lightest model in the ResNet series, as the infrastructure. Considering the imbalance problem of high spectral data dimension and few training samples for some classes, this study introduced several optimization methods: Rectified Linear Unit (ReLU) activation function 34 and Dropout regularization technology. 35 The ReLU activation function is used to enhance the expressiveness of the model and accelerate the convergence process. The Dropout technology is especially suitable for processing high-dimensional spectral data input and can effectively improve the robustness 28 of the entire model. During model training, a gradient-based optimization method is used in this study to adjust the network weights. This method adjusts the parameters to a position that minimizes the error by calculating the partial derivative of the parameters with respect to the error. The learning rate plays a key role in this process, controlling how quickly the parameters change along the error gradient. However, choosing the right learning rate is crucial: too high a learning rate can cause the parameter to change too much in each iteration, making it oscillate violently or even diverge near the optimal solution; And too low a learning rate may cause the parameters to converge too slowly, or even fail to reach the optimal solution. To solve the problem of learning rate selection and further optimize the training process, the Adaptive Moment Estimation (Adam) optimizer 36 is introduced in this study. The Adam optimizer can automatically adjust the learning rate for each parameter, reducing the need for manual adjustment. Using first and second moment estimates of gradients, it can effectively deal with sparse gradients and non-stationary targets, often converging to the optimal solution faster than traditional stochastic gradient descent methods. In addition, Adam is relatively insensitive to the selection of hyperparameters such as the initial learning rate, making it more stable in practical applications. By using the Adam optimizer, the study was able to automatically adjust the learning rate during training, not only avoiding the difficulty of artificially selecting a fixed learning rate but also maintaining an appropriate rate of parameter update in different stages of training, thereby speeding up convergence and improving model performance. This is especially important for scenarios dealing with high-dimensional spectral data and limited sample size in this study, which can help the model better adapt to the data characteristics, improve the training efficiency and the final classification accuracy.
By integrating all the above optimization strategies, including the lightweight ResNet-18 architecture, the ReLU activation function, Dropout regularization, the Adam optimizer, and the SE-POST attention mechanism (the SE module is located after the residuals and before the residuals are connected). This research culminates in the construction of a deep learning model specifically for textile spectral analysis, whose structure is shown in Figure 4(B) and named FabricNet. FabricNet not only keeps the computational complexity low but also can efficiently process high-dimensional spectral data, adapt to the situation of unbalanced sample size, and automatically focus on key features in the data. This comprehensive optimization approach enables FabricNet to demonstrate excellent performance and efficiency in textile spectral classification tasks. FabricNet structure diagram for waste textile identification (A) (B) Comparison chart of validation accuracy and loss rate for waste textile recognition models (C).
Performance analysis and comparison of waste textile identification model
Model comparison experiments.

Note: “+SE” means the SE attention mechanism has been added, and “+Dropput” means the Dropout regularization layer has been added.
The comparison chart of accuracy and loss rate is shown in Figure 4(C). The experiment shows that the method proposed by the author is superior to other models in recognition accuracy, precision, recall rate and F1 score, and is the best choice for identifying fabric types.
Experimental design
To further evaluate the performance and generalizability of the FabricNet model for waste textile identification, 120 unmodeled fabric samples were used as external validation. Near-infrared (NIR) spectral data were collected using a Nirone Sensor S2.0 (Spectral Engines, Germany), covering a wavelength range of 1550–1950 nm with a typical spectral resolution of 15–21 nm (FWHM). The sensor employs a single element extended In GaAs detector, illuminated by tungsten vacuum lamps with a rated lifetime of over 40,000 h. It supports fast wavelength switching with a response time of 1 ms and provides a typical signal-to-noise ratio (SNR) of approximately 6000.
The sensor exhibits high thermal stability, with a wavelength drift of less than 0.1 nm/°C, and operates reliably within a temperature range of + 10°C to + 50°C (noncondensing). The device is compact and lightweight, with a peak power consumption below 1.1 W and nominal consumption below 300 mW. It is equipped with micro reflection optics and an SMA optical connector, making it suitable for embedded and portable NIR spectroscopy applications.
Model inference and case testing were performed on a server equipped with an NVIDIA RTX 4090D (24 GB) GPU and a 16 vCPU Intel® Xeon® Platinum 8474C processor.
Given the requirement of classifying multiple fabric types, the evaluation method of this research considers the overall performance of the model and the individual performance of each category. To measure the effectiveness of the model, four key indicators were used in this study: accuracy, precision, recall and F1 score. These metrics not only provide a comprehensive reflection of the model’s overall performance but also enable an in-depth assessment of the model’s specific effectiveness in classifying each fabric category. In concrete terms, these metrics mean the following: A. Accuracy: represents the ratio of the number of samples correctly classified by the model to the total number of samples, calculated by the following formula: B. Precision: Precision is the ratio of the number of samples that correctly predicted a positive class to the number of all samples that predicted a positive class. C. Recall rate: The recall rate is the ratio of the number of samples correctly predicted to be positive to all positive samples. D. F1 Score: The F1 score is the harmonic average of accuracy and recall.


Experimental results
Figure 5(A) and (B) present the identification precision for a variety of pure and blended fabrics, focusing primarily on polyester (PE) and cotton (CO). The results reflect the performance of the FabricNet model based on near-infrared (NIR) spectral data. The precision of blended polyester fibers (excluding blends with cotton) and pure polyester fibers (A). The precision of cotton blended with other materials (excluding blending with polyester) and that of polyester-cotton blends (B).
Identification performance of polyester and polyester-based blends
Figure 5(A) Compares the model’s precision in identifying pure polyester fabrics with that of polyester blended with other fibers. The findings are as follows.
Pure fiber fabrics achieve consistently high precision
• All pure fiber samples, such as 100% PE, 100% W (wool), 100% V (viscose), 100% PP (polypropylene), and others, achieved near-perfect precision, often equal to 1.0. • This indicates that the model can effectively identify single-component fabrics, benefiting from clear and undistorted spectral signatures.
Blended polyester fabrics show varied and generally lower precision
• Blends with high polyester content (e.g., 91% PE/5% SP/3% N) still achieved high precision (above 0.9). • As the proportion of non-polyester fibers increases, the identification precision tends to decline. For example, blends like 31% PE/69% T (Tencel) fell below 0.5. • Blends with elastic fibers (e.g., SP, PU) and plant-based fibers (e.g., PLA, W, V) displayed wide variation in performance, indicating challenges in recognizing mixed spectral signatures.
Spectral interference from non-polyester fibers is a key factor
• Notably, blends with natural fibers like wool and viscose caused a marked drop in precision, suggesting that these components significantly affect the spectral pattern, making classification more difficult.
Identification performance of cotton and cotton-based blends (Figure 5(B))
Figure 5(B) focuses on the precision for polyester-cotton blends and cotton blended with other fibers. The observations are summarized as follows:
Polyester-cotton blends show moderate to low precision
• Most polyester-cotton blends fall within a precision range of 0.6–0.8. • Performance is closely linked to the blend ratio. For instance, samples with higher cotton content (e.g., 63% CO/25.5% PE/9% V/2.5% SP) generally yielded better results than samples with more complex compositions.
Cotton blended with individual fibers maintains high recognition precision
Cotton blended with specific fibers like viscose (V), modal (M), or flax (L) showed high precision, in some cases comparable to pure cotton.
Cotton-based blends exhibit more stable performance overall
• Compared to the wider fluctuations observed in polyester-based blends (Figure 5(A)), cotton-based blends (Figure 5(B)) show a narrower range of precision values, suggesting more stable model performance.
Summary and implications
The results demonstrate that the model performs very well on pure fiber fabrics, where spectral signals are clean and consistent. However, performance declines with increasing material complexity—particularly in polyester-cotton and multi-component blends—due to spectral feature overlap and interference. These findings underscore the importance of improving feature extraction methods and possibly integrating additional sensing modalities to enhance recognition in complex fabric scenarios, especially for textile recycling and automated sorting applications.
Discussions
Interpretation of results
However, the model faces challenges in handling certain types of blended and pure fibers. In the case of pure fibers, the recognition efficiency for polyamide and acrylic fiber is relatively low. This may be due to the dominant characteristic absorption peaks of these fibers in the infrared spectrum, leading to similar infrared spectral images of blended fabrics, thereby reducing the model’s precision in distinguishing them, as shown in Figure 6(B) and (C). Spectrum comparison diagram of waste textiles (A) (B) (C) (D) (The striped areas represent the originally black - filled areas).
For blends of cotton and Viscose, such as a mixture containing 64.5% cotton, 33% viscose, and 2.5% spandex, the recognition precision is 0.
The primary reason is that both cotton and Viscose are cellulose-based fibers with very similar basic structural units and infrared spectral features. This high similarity makes it difficult for the model to differentiate between these two fibers, especially when their proportions are close. Additionally, the low content of spandex (2.5%) in this blend results in its characteristic absorption peaks being less prominent in the overall spectrum, making the spectral shape more like that of pure cotton, as shown in Figure 6(A)(1) and 6(A)(2). This further increases the difficulty of recognition, leading to low precision. As shown in Figure 6(A)(3), although cotton and Viscose still have similar spectral features, the presence of polyester introduces different chemical structures, allowing the model to partially identify these differences. Therefore, the recognition precision for a blend of 63% cotton, 28% Viscose, and 9% polyester improves to 0.4412. When the proportion of polyester is further increased, the spectral peak and valley shapes show significant differences, as shown in Figure 6(A)(4), resulting in a precision of 1.0.
In this study, this research explored the impact of different fiber compositions and their mixing ratios on spectral shapes and recognition precision. Through spectral analysis of various fiber blends, this research found that fiber composition and their ratios significantly affect spectral features and recognition precision. Specifically, as shown in Figure 6(D)(1) and 6(D)(2), when cotton is blended with polyester and spandex, a combination of 55% cotton, 35% polyester, and 10% spandex exhibits high recognition precision (Precision: 0.9887), with smooth spectral curves and distinct peak and valey features. However, as the proportion of cotton increases to 60%, the recognition precision slightly decreases (Precision: 0.8601), indicating that the proportions of cotton and polyester in the blend influence the spectral peak and valley shapes and, consequently, the recognition precision.
Furthermore, as shown in Figure 6(D)(3) and 6(D)(4), when polyester is blended with polylactic acid fiber (PLA), the highest recognition precision (Precision: 1.0000) is achieved when the two components are in equal proportions (50% polyester, 50% PLA), with clear spectral curves and distinct peak and valley features. When the proportion of polyester increases to 68%, the recognition precision drops to 0.7305, and the spectral curves become relatively complex, with less distinct peak and valley features. This result indicates that the mixing ratio of polyester and PLA significantly affects the spectral recognition precision.
Overall, the model performs well in recognizing pure fibers and certain specific blends but still faces challenges in handling blends of chemically similar fibers and complex multi-component blends. Future research directions could focus on improving the ability to distinguish between chemically similar fibers and enhancing the recognition precision of complex multi-component blends. Considering the diversity of textile components in practical applications, it may be necessary to expand the training dataset to include more types and proportions of blended samples, thereby further improving the model’s generalization and practicality.
These improvements will help make the model play a bigger role in the field of textile component identification and provide more reliable support for the classification task of textiles.
Comparison with existing studies
Our model achieved a 4-percentage point improvement in accuracy compared to the model used by Zheng et al. 37 (2020). The accuracy of their model on new cases was 93%, indicating that our model demonstrates better generalization capabilities when handling complex data. Li et al. 38 (2022) employed a deep learning-based method for fabric infrared spectroscopy recognition, and their model performed well on certain specific types of data. However, their model was limited to only 12 types of fibers. In contrast, our model, by incorporating a wider variety of fabrics, extends the recognition range to include a broader spectrum of fiber types.
.
Future research scope
This research has made significant progress in the field of fiber identification by expanding the breadth of fiber identification using infrared spectroscopy. However, to further advance this field, there are still several valuable research directions worthy of exploration. The following are the main scopes for future research.
Deepening fiber identification capabilities
Continue to expand the types of identifiable fibers, covering not only common natural and synthetic fibers but also some new-type, special-purpose fibers, such as smart fibers and biodegradable fibers. Study the unique characteristics of these fibers under infrared spectroscopy to improve the identification system. Improve the identification accuracy of complex blended fibers. Many fiber products are composed of a mixture of multiple fibers. In the future, it is necessary to research how to accurately distinguish the components of fibers mixed in different proportions, providing a more reliable basis for textile quality control and recycling.
Technological integration and innovation
Explore the combination of infrared spectroscopy technology with other analytical techniques (such as Raman spectroscopy and nuclear magnetic resonance) to achieve multi-technology complementarity and improve the accuracy and reliability of fiber identification. By integrating information obtained from different technologies, a more comprehensive understanding of the structure and properties of fibers can be achieved. Introduce cutting-edge algorithms in machine learning and artificial intelligence to further optimize the identification model. For example, try using generative adversarial networks (GAN) to generate more simulated spectral data to enhance the generalization ability of the model; or use reinforcement learning algorithms to automatically adjust model parameters to improve identification efficiency.
Practical application expansion
Apply fiber identification technology to a wider range of fields, such as cultural relic protection, medical textiles, and environmental monitoring. In cultural relic protection, accurate identification of the fiber components of ancient textiles can provide a scientific basis for relic restoration and preservation. In the medical textile field, it can be used to detect the quality and safety of medical textiles. Develop portable and real-time detection infrared spectroscopy devices to meet the needs of onsite rapid detection. For example, monitor fiber quality in real-time on textile production lines or quickly identify fiber materials in field environments.
Theoretical foundation research
Conduct in-depth research on the internal relationship between the infrared spectral characteristics of fibers and their molecular structures and establish a more complete theoretical model. This helps to understand the infrared spectral response mechanism of fibers in essence and provides theoretical support for the development of more accurate identification methods. Study the influence of environmental factors (such as temperature, humidity, and light) on the infrared spectra of fibers to improve the stability and accuracy of identification results under different environmental conditions.
Conclusions and future work
This study proposes an improved convolutional neural network model, FabricNet, for the identification of waste textiles based on near-infrared spectroscopy. The model integrates the ResNet-18 architecture, Squeeze-and-Excitation (SE) attention mechanism, and Dropout regularization techniques. In the experiment, this research collected 280 fabric samples, including 11 types of pure fibers, 22 types of two-component blends, and 31 types of multi-component blends, which were preprocessed using near-infrared spectroscopy. The dataset was divided into a training set and a validation set in an 8:2 ratio. After 200 epochs of training, the model achieved an accuracy of 97.31% on the validation set. To further validate the effectiveness of the model, this research also tested 120 fabric samples that were not involved in the modeling process. The results showed that FabricNet achieved a precision of over 95% for pure textiles and over 90% for blended textiles.
FabricNet achieved an accuracy of 97.31% on the validation set, significantly outperforming other common CNN models such as AlexNet, VGGNet, GoogleNet, and the original ResNet. By integrating the SE attention mechanism and Dropout regularization, the model’s stability and generalization ability were significantly enhanced. Additionally, FabricNet can effectively identify various types of fabrics, providing a feasible technical pathway for the automated classification of waste textiles. The use of residual networks enhances the depth and learning capacity of the model, increasing its focus on important features, thereby improving recognition precision, reducing the risk of overfitting, and enhancing the model’s generalization ability.
Future research directions include further optimizing the model’s ability to identify complex blended fabrics, especially in cases where the chemical components are similar, and the characteristic peaks are not prominent. Additionally, the impact of environmental factors such as temperature, humidity, and lighting on infrared spectra should be studied to improve the stability and accuracy of the recognition results. Applying the FabricNet model to a wider range of waste textile classifications will further enhance its applicability and practicality. However, the current dataset is relatively small, and future work will require expanding the dataset to improve the robustness of the model. For certain complex blended fabrics with similar chemical compositions and indistinct characteristic peaks, the model’s recognition capability needs further optimization.
In summary, the FabricNet model provides a feasible technical pathway for the automated and efficient classification of waste textiles, contributing to the improvement of waste textile recycling rates. However, further optimization of the model’s performance, particularly in the identification of complex blended fabrics, is necessary in future research.
Footnotes
Funding
This work was supported by the Wuxi Industrial Innovation Research Institute Concept Verification Project (ZK202505029-RX-00[A]), the Fundamental Research Funds for the Central Universities (2232024G-05-3 and 2232025G-09) and the National Key R&D Program of China (2023YFB3210900). The authors gratefully acknowledge the financial support providedby these programs.
Declaration of conflicting interests
The authors declared no potential conflicts of interest with respect to the research, authorship, and/or publication of this article.