
Abstract
Protective clothing systems pose significant heat stress challenges in hot climate, limiting natural cooling through sweat evaporation. In such conditions, passive cooling systems could offer lightweight, silent, and energy-efficient solutions. However, their effectiveness and their physiological and psychological impact are influenced by specific operational conditions, including the type of clothing system used. This study assessed the thermophysiological effects of three passive cooling vests - Phase Change Material (PCM), Waterfill (WF), and Watersoak (WS) - worn under Belgian Defense clothing system with ballistic protection during wear trials at 30°C, 48% RH, 4 km/h, 120 min. The PCM vest with a transition temperature of 29°C provided the most effective cooling, significantly reducing torso microclimate temperature for 60 min. Over the total test duration, the torso microclimate temperature was lowered by an average of 1.5°C, accompanied by reduced cardiovascular strain, sweating, and enhanced thermal and wetness perception. Thus, the PCM can be a better solution than active cooling for operations up to 2 hours. Water-based cooling vests delivered mild cooling, with significant effect at 30 min, but temporary duration. They still showed reduced microclimate temperature by 0.5°C at 60 min, but became a thermal burden thereafter, confirming their limited performance under restrictive clothing. The results also showed that subjective experience did not fully align with objective data, confirming the importance of individual perception in comfort-related studies.
Keywords
Introduction
Protective clothing systems such as ballistic wear that typically covers 22%–33% of body surface area, restrict natural cooling, leading to discomfort, heat-stress risks and reduced operational performance.1,2 A recent survey of 38 Belgian defense soldiers found that 92% were dissatisfied with the thermal comfort of their clothing systems in hot climate, emphasizing the need for effective cooling solutions.
3
Comfort, defined as the subjective satisfaction with the surrounding environment, consists of thermal, ergonomic, tactile, physiological and psychological aspects.4,5 Human wear trials are crucial in comfort evaluation to validate the real physiological response.5–8 The air in the skin–clothing microclimate offers valuable insights into thermal comfort, reflecting changes in temperature and relative humidity between the skin and clothing layers.6,9 Thermal comfort depends on the total heat and mass transfer from the body to the environment, given with the heat balance equation (Eq. 1):

Previous studies emphasize the need for more empirical research on human responses to different cooling solutions, in specific scenarios. 5 For instance, the cooling vest placement within clothing, different PCM melting temperatures, different ambient conditions can largely impact cooling performance. Commercial evaporative vests are not recommended under restrictive clothing, but their impact in ballistic wear remains understudied. 17 This study evaluates three passive cooling vests – PCM, Waterfill (WF), and Watersoak (WS) – as potential sustainable cooling solutions for the Belgian military clothing system for hot climate under ballistic wear. The aim is to evaluate the thermophysiological impact of each vest based on wear trials, identifying when each vest becomes a thermal burden. Microclimate temperature and humidity in the torso area are monitored and compared to subjective thermal sensation, sweating wetness, and comfort. This study uses “microclimate” to describe temperature and RH under clothing, emphasizing precise sensor placement, as skin and microclimate values can differ and are often not clearly distinguished.
Materials and methods
Study participants
Subject details.

aAcclimatization stands for the usual training environment of the subject (warm, normal, cold climate), 10 weeks in a year.
Materials
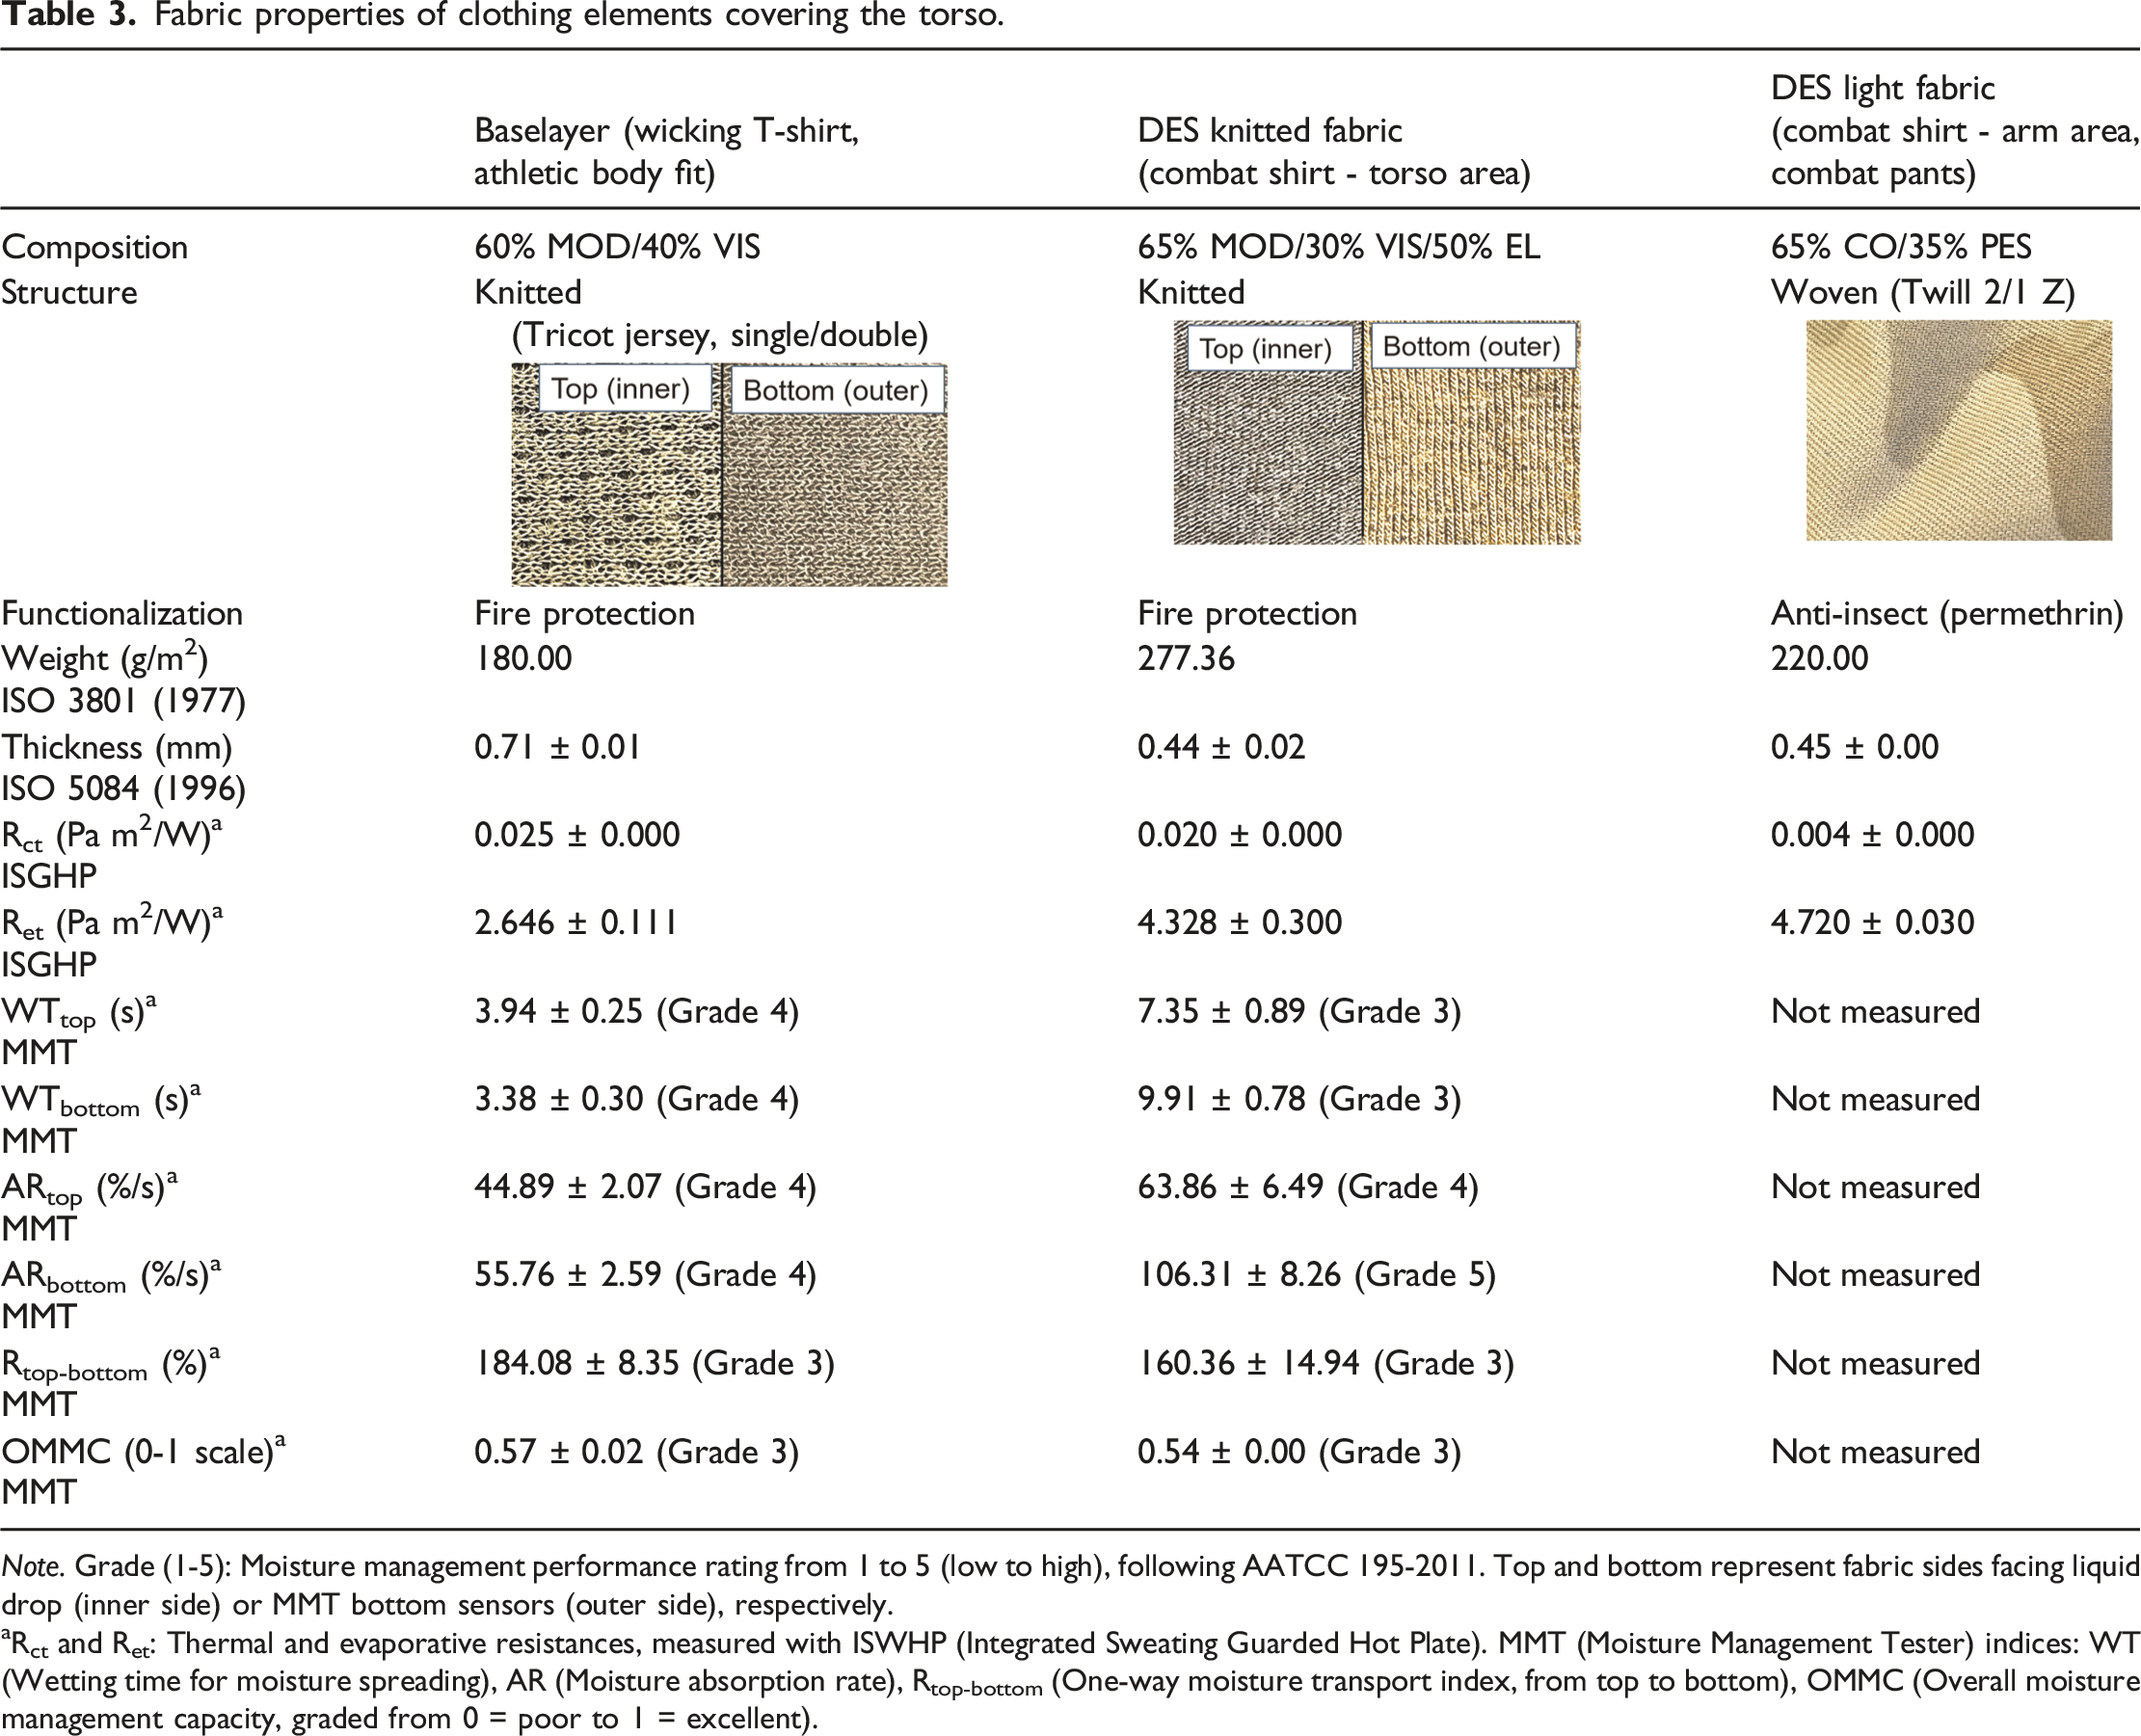
Figure 1 illustrates the layering in the torso area, while the full clothing system for hot climate used by Belgian Defense is described in Table 2. Fabric properties of clothing elements below the ballistic vest are given in Table 3. Most data was obtained from Belgian Defense and the rest measured following standards mentioned in Table 3. Thermal (Rct) and evaporative resistances (Ret) were measured with Integrated Sweating Guarded Hotplate (ISGHP, Measurement Technology Northwest) following ISO 11092.
20
Moisture management indices, wetting time (WT), absorption rate (AR), accumulative one-way transport capability (Rtop-bottom) and overall moisture management capacity (OMMC), were obtained with moisture management tester (MMT, SDL Atlas® Hong Kong), following AATCC 195-2011.21,22 The baselayer wicking property comes from the structural gradient between the inner and outer fabric side (Table 3). Clothing was washed and dried before each test following standard military procedures. Clothing layering for each wear trial. Full clothing system for hot climate (clothing elements and sizes). aDaypack load is given as percentage of bodyweight (% BW) per subject: 100 × (daypack weight ÷ body weight). Fabric properties of clothing elements covering the torso. Note. Grade (1-5): Moisture management performance rating from 1 to 5 (low to high), following AATCC 195-2011. Top and bottom represent fabric sides facing liquid drop (inner side) or MMT bottom sensors (outer side), respectively. aRct and Ret: Thermal and evaporative resistances, measured with ISWHP (Integrated Sweating Guarded Hot Plate). MMT (Moisture Management Tester) indices: WT (Wetting time for moisture spreading), AR (Moisture absorption rate), Rtop-bottom (One-way moisture transport index, from top to bottom), OMMC (Overall moisture management capacity, graded from 0 = poor to 1 = excellent).

Three different passive cooling vests (CV) were evaluated: PCM, Waterfill (WF) and Watersoak (WS). Each CV was placed as a second layer (Figure 1), below the combat shirt and ballistic (QRV) vest. The vests were conditioned in the testing room for 20 min prior to each test. PCM CV was made of fabric-free, 100% biobased PCM (CrodaThermTM, melting T ≥ 29°C, crystallization T ≤ 26°C), with dry weight of 1251 ± 1 g and thickness of 12.8 mm. It was packed into impermeable plates with adjustable stripes for fit. 23 It was refrigerated at 7°C the day before each test. The PCM vest was selected considering a higher melting temperature (to prevent cold injuries or premature activation at the ambient T), textile-free encapsulation (to minimize bulkiness), material sustainability, safety, and availability in EU. WF CV consisted of an outer layer (40% Nylon jersey/60% PU), inner nylon fabric and a wicking PES fleece core, with a wet weight measured before each test of 712 ± 34 g and a thickness of 2.4 mm. It was available in size S/M, with a waistline adjustment and multiple ventilation hole openings (Figure 1) at its front and back. It was activated by filling it with water (500 g, 15°C). WS CV consisted of 100% PES outer and inner fabric layers (the inner is PU coated) and a superabsorbent core, was available in size S/M and had a waistline adjustment. Its wet weight and thickness before each trial were 742.5 ± 101.5 g and 1.6 mm, accordingly. The vest was activated by soaking it in water (500 g, 15°C) for 2 min.
Protocol description
There is no standard for testing cooling vests, so a custom wear trial protocol was developed consulting the guidelines by Lei et al.
18
ISO 9886:2004
24
and ASTM F2371.
25
Four tests per subject were done: three with each CV and a reference test (Ref.) without a CV. Each subject and CV were tested once per day, at the same time. The test could be stopped if: core temperature exceeded 38.5°C; HR reached 90% of the age-predicted maximum
26
calculated with equation (2); headache, dizziness, vomiting, nausea, or any irritability occurred; or if the subject wanted to stop.
14

The test conditions per subject were: T = 29.83 ± 0.27°C; RH = 48.14% ± 2.56%; no wind and sun radiation; treadmill speed = 4 km/h (incline angle of 4.8°); test duration = 120 min; average water intake, 120 min (from hydration pack) = 849 ± 302 g. Ambient T and RH were constantly monitored every 30 min using a thermometer and hygrometer. An electric heater was used to reach the set temperature value, which was kept constant by manually reducing heater output if needed. To eliminate external solar radiation, the windows were covered with black curtains. The airflow was not monitored but was considered minimal by keeping the windows and door closed. The subjects were acclimatized 20–30 min in the testing room, while the sensors were mounted. Each subject was given a hydration pack (3 L capacity) in the daypack, allowing them to drink freely throughout the trial. Water intake was measured by weighing the daypack before and after each trial.
Near-skin microclimate temperature and relative humidity (Tmc and RHmc), heart rate (HR) and breathing rate (BR), subjective parameters and weight changes before and after the test were measured. The collected data was analyzed using SPSS and Excel, primarily reported as mean values per subject and across subjects, along with the standard deviation (SD). Near-skin microclimate refers to the space between the skin and baselayer, where sensors were placed to simultaneously monitor Tmc and RHmc. Its parameters directly impact the thermal and moisture transport from the skin.4,6 Four DS1923 iButton data loggers were used to collect data at 30 s intervals, via Exactlog Software. They were attached to the skin with a textile adhesive tape, ensuring the iButton opening which connects to the internal sensors faced the microclimate between the skin and baselayer. A small hole was made on the adhesive tape to avoid obstructing the iButton opening (Figure 2(a)). The sensors were placed at the front and back of torso (Figure 2(b)), based on the procedure by Eijsvogels et al.
27
It is important to distinguish between skin and microclimate temperature, since the microclimate can change with clothing movement, while skin temperature reflects surface conditions.
9
From the collected data, the average Tmc difference between each CV and the reference per subject, ΔTmc was calculated using equations (3) and (4): (a) Securing the iButton sensor to the skin. (b) Two front and two back torso locations of iButton sensors.


Heart Rate (HR, bpm) and Breathing Rate (BR, rpm) were continuously monitored (Equivital EQ02 SEM, Hidalgo, UK) at a 15 s sampling rate. The recorder was attached to a chest-worn belt placed on the subjects. Core temperature was monitored in real-time via Bluetooth, through a core sensor strapped around the upper arm (CORE Body Temperature Monitor). 28 It was only used as safety parameter, so the data is not included in the current analysis due to reasons explained in Limitations.
Weight changes per subject and clothing were measured before and after each test. Clothing weight, WCL (g) which included T-Shirt, Combat Shirt, Combat Pants, and gloves (no socks and equipment) was measured with ±0.001 g precision. Weight of fully clothed Subject, Wfully clothed (g), including full clothing system and CV, was measured with ±1 g precision. Weight of CV (g) was also measured with ±1 g precision. The following parameters were calculated from the collected data, considering the water drank during the tests per subject (daypack weight difference): (1) Clothing Liquid Absorption, ΔWCL (g) - the difference in the weight of the clothing before and after test resulting from the sweat and water transfer to the clothing (ΔW
CL
= WCL,120min – WCL,0min). (2) Sweat Evaporation, ΔWfully clothed (g) - the difference in weight of fully clothed subject before and after the test (ΔW
fully clothed
= W
fully clothed, 120min
– W
fully clothed, 0min
). (3) Total liquid (sweat, water) loss, ΔWL (g), including both the sweat absorbed by the clothing and the evaporated sweat (ΔW
L
= ΔW
fully clothed
+ ΔW
CL
).
Subjective data was gathered using a questionnaire constructed based on ISO 10551:2019.
29
Five-point scales (Figure 3) were used to evaluate: temperature (warmth), sweating wetness sensation30,31, overall comfort
32
, and perceived weight. In the evaluative scales, the dissatisfaction intensity increases from 0 (absence of negative effect) to 4 (highest dissatisfaction). A bipolar scale is used for overall comfort acceptance, with −2 indicating highest discomfort and +2 the highest comfort. Intermediate ratings in increments of 0.5 could be given to express in-between feelings. Subjects were verbally asked and answered questions during the test at 30 min intervals. Notes were taken during each test to capture additional comments. From the collected data, mean values for each subjective aspect were calculated. Parameters and scales for subjective comfort evaluation.
Analytical approach
The data was analyzed using IMB SPSS Statistics 29.0.1.0. The results are mainly presented as means ± standard deviations. Although the study included only three subjects, the four iButton sensors continuously measuring microclimate parameters per subject enabled for multiple repeated observations per vest condition for both Tmc and RHmc. A one-way repeated measures ANOVA was used to assess the effect of vest type on Tmc and RHmc, using data from the four iButton sensors for the three subjects (n = 12). The analysis was performed separately for different time points (30, 60, 90, and 120 min), followed by Bonferroni-adjusted post hoc comparisons. The results are reported with p-values and partial η2 (effect size: 0.01 indicates a small, 0.06 a moderate effect and 0.14 or higher a large effect). 33 Reported means (M) and standard errors (SE) are model-adjusted. To further validate the findings and increase statistical power, an additional one-way ANOVA was conducted using data from a single sensor location (front upper chest), with six measurements collected per interval (25–30 min and 55–60 min) for the three subjects (n = 18, per vest per parameter). In addition, individual response trends were analyzed through graphic representations of objective Tmc and RHmc parameters and subjective thermal and wetness sensation ratings over time, to assess whether vest-related differences outweighed inter-subject variation.
Results
Microclimate temperature and relative humidity
The graphs in Figure 4 show the Tmc slopes of one subject, including range-based error bars. Table 4 shows mean Tmc values from the front and back of torso at different time points, while Table 5 shows the cooling effect of each CV compared to Ref: the mean ΔTmc. Over the entire test duration (0–120 min), PCM provided an average Tmc reduction of 1.5°C compared to Ref., while both water-based CVs reduced it only around 0.2°C. At the start, Tmc in all test conditions was slightly higher than the ambient air. CVs immediately reduced Tmc by 1.5 to 2°C compared to Ref., with PCM showing the largest average reduction followed closely by WF and WS. This can be attributed to the PCM refrigeration at 7°C before the test as well as the initially cool water (15°C) in the water-based vests. Water-based CVs showed a much faster Tmc increase than PCM, with a plateau at 35 to 45 min. At 60 min, the PCM showed the biggest cooling effect (1.89°C), while water-based CVs had only mild cooling (≤0.38°C). The Ref. Tmc maintained the same level from 60 to 120 min (37.01 ± 0.19°C). At 120 min, only PCM provided mild cooling at the front of torso by 0.46°C, while WF and WS increased Tmc by around 0.5°C at the back compared to Ref. In general, the back Tmc appears to be slightly higher than the front in the second half of the tests, possibly due to the daypack. Mean microclimate temperature (Tmc) from 0 to 120 min for one subject taken from: (a) two sensors at the front, and (b) two sensors at the back of torso. Mean microclimate temperature (Tmc) from the front and back of torso at different time points. Note. Front and Back represent average Tmc from the two sensors at the front or back of torso, respectively. Front + Back represent average Tmc from 0 to 120 min. Values shown are average from all subjects. Cooling effect of Cooling Vests, based on microclimate temperature difference with reference (ΔTmc) at 60 and 120 min. Note. Front and Back represent average Tmc from the two sensors at the front or back of torso, respectively. Front + Back represent average Tmc from 0 to 120 min. Values shown are an average from all subjects. ΔTmc, 60 min = CV Mean Tmc, 60min – Ref. Mean Tmc, 60 min ΔTmc, 120 min = CV Mean Tmc, 120min – Ref. Mean Tmc, 120 min


Figure 5 shows the RHmc change in time for different CVs and the Ref. Table 6 shows the mean RHmc for each CV and Ref. at the front and back at different time points. Over 0–120 min, RHmc was in the order of PCM, Ref., WF and WS, from lowest to highest, but there were only small differences compared to Ref. (2%–3%). Across the different testing conditions, RHmc at the back of torso was 5%–10% higher than the front. At 0 min, RHmc was highest for WS (79.47 ± 6.00%), followed by Ref., WF, and PCM. WS had higher RHmc from the start due to soaked water, while the initially lower RHmc of PCM and WF compared to Ref. indicates a slightly delayed sweat response. RHmc slopes from all test conditions plateau between 30 and 40 min, similar to Tmc slopes (Figure 4), except for the PCM where Tmc increase seems to be slower than RHmc. At 60 min, water-based CVs show high RHmc (90%) which is similar to Ref., while PCM maintains a slightly lower level by 3%–5%. At 120 min, mean RHmc range from 90%–93% for all test conditions, showing similar saturation of the microenvironment. Mean microclimate relative humidity (RHmc) values from 0 to 120 min for one subject taken from: (a) two sensors at the front, and (b) two sensors at the back of torso. Mean microclimate relative humidity (RHmc) values from the front and back of torso across different time points. Note. Front and Back represent average RHmc from the two sensors placed on the front or back of torso, respectively. Front + Back = average RHmc from 0 to 120 min. Values shown are an average from all subjects.

Heart and breathing rate
Mean Heart Rate and Breathing Rate over the wear trials.
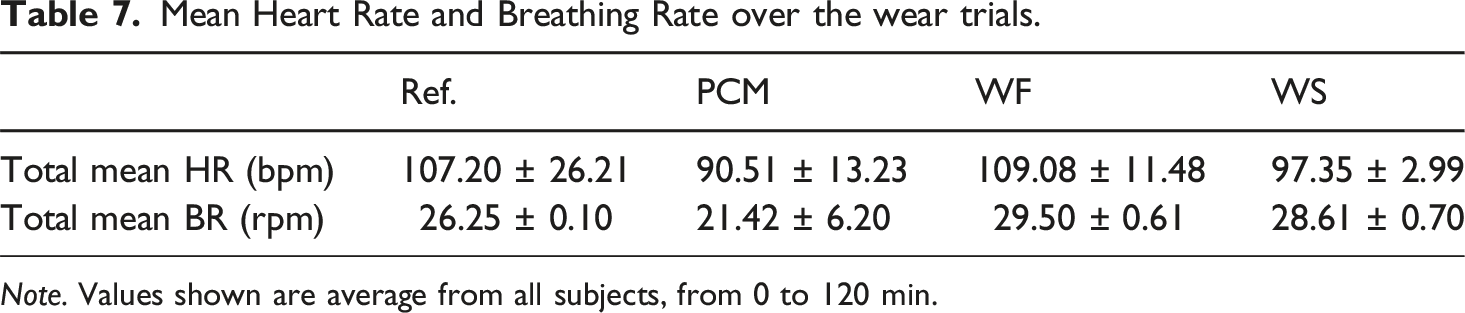
Note. Values shown are average from all subjects, from 0 to 120 min.
Sweating and weight changes
Figure 6 shows the mean values for Total Body Liquid Loss (ΔWL), Sweat Evaporation (ΔWfully clothed) and Clothing Liquid Absorption (ΔWCL) for each CV. Their calculation was explained in Protocol Description. The mean weight changes per CV after each test were recorded: +3 g for the WF and −141 g for the WS. PCM did not change its weight due to the impermeability. Total liquid loss, sweat evaporation, and clothing absorption increased consistently after the tests in the following order: PCM, WF, Ref., WS. During the Ref. test, subjects lost around 1819.5 ± 95.5 g of water through sweating, which equals to 1 L per hour. PCM CV shows the lowest total liquid loss: around 398.5 g lower than Ref., with reduced clothing absorption by ∼ 131.5 g and sweat evaporation by ∼177.0 g. WF reduced total liquid loss and sweat evaporation by ∼126 g, but had similar liquid absorption in clothing as the Ref. WS showed the highest liquid loss: higher evaporation by ∼71.5 g and clothing absorption by ∼ 127 g compared to Ref. Total Mean Liquid Loss, Sweat Evaporation and Clothing Liquid Absorption per cooling vest after 120 min. Values are average from all subjects.
Subjective data
The mean subjective ratings per cooling vest are presented in Figure 7 and Table 8. Warmth was reduced by around 1 point when subjects were wearing CVs, with PCM having the best results. All CVs reduced sweating wetness sensation, the PCM and WS showing the biggest reduction of 1 point. Overall comfort was slightly better with the WS compared to Ref., while the PCM slightly reduced it (still, by less than 0.5 points compared to Ref). Subjects commented that PCM felt uncomfortable at the start, not in terms of thermal comfort but due to the sharp edges of the solid PCM. Weight was perceived as neutral across all different CVs, despite the actual difference in weight between CVs. Mean Subjective Ratings per cooling vest. Values are average for all subjects, from 0 to 120 min. Mean subjective ratings during the wear trials per cooling vest. Note. Values are average from all subjects, recorded from 0 to 120 min at 30 min intervals. The scales to describe each parameter are given in Protocol Description.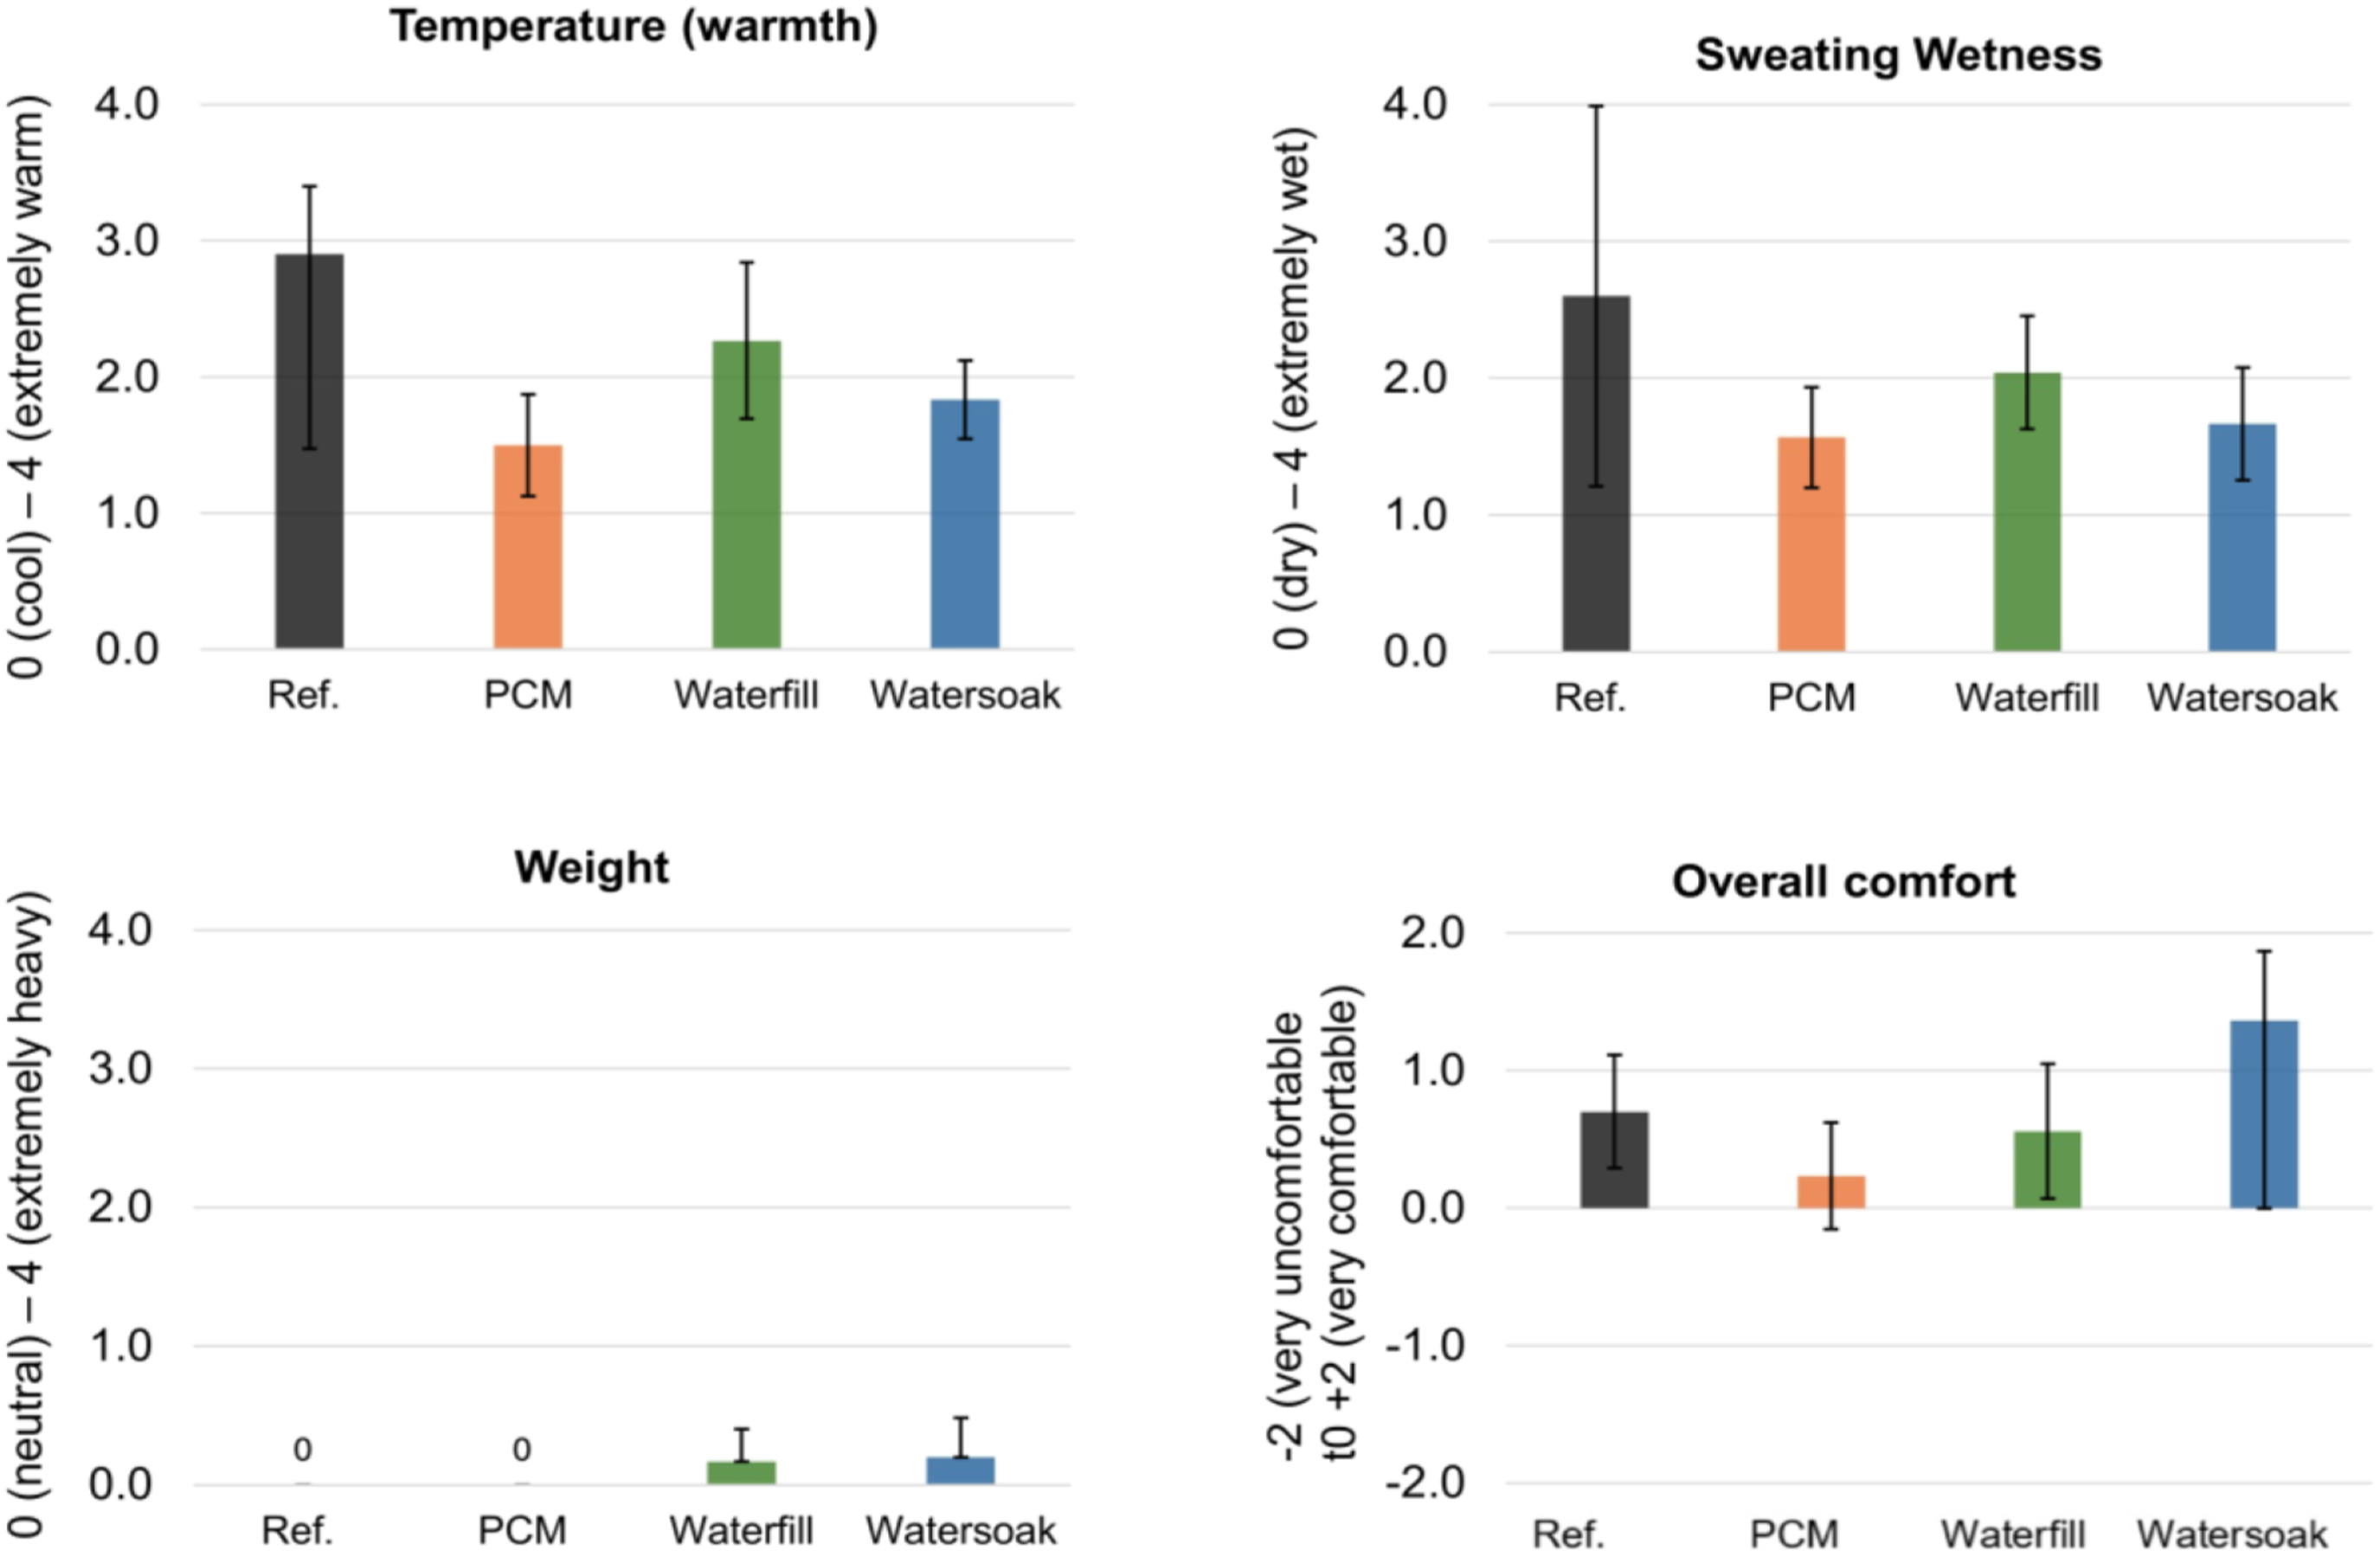

Statistical analysis of microclimate parameters
The ANOVA analysis from the four-sensors (n = 12) indicated significant differences in the first hour of testing. At 30 min (p < 0.001, partial η2 = 0.60): PCM showed significantly lower Tmc (M = 34.50, SE = 0.39) than Ref. (M = 36.54, SE = 0.27, p = 0.002), WF (M = 35.99, SE = 0.26, p = 0.008), and WS (M = 36.00, SE = 0.31, p = 0.006). WF was also lower than Ref. with p = 0.038. At 60 min (p < 0.001, partial η2 = 0.51): PCM (M = 35.15, SE = 0.35) remained significantly lower than Ref. (M = 37.04, SE = 0.27, p = 0.003), WF (M = 36.71, SE = 0.31, p = 0.010), and WS (M = 36.66, SE = 0.34, p = 0.017). No other CV showed significant reduction compared to Ref. At 90 and 120 min, no significant Tmc differences were found. RHmc results at 30 min showed significant differences (p = 0.024, partial η2 = 0.246) between PCM (M = 82.72, SE = 3.61) and WS (M = 89.36, SE = 4.46, p = 0.006), but not with Ref. At 60 min (p = 0.001, partial η2 = 0.326): PCM (M = 87.20, SE = 1.09) was significantly lower than WF (M = 91.44, SE = 0.80, p = 0.013), but not compared to Ref. At 90 and 120 min, no significant differences were found.
The results from single sensor location (front upper chest) and six time points per interval (n = 18) further strengthened the findings. Tmc results from the 25–30 min interval showed significant differences: p < 0.001, partial η2 = 0.897. PCM (M = 34.52, SE = 0.18) was significantly lower than Ref. (M = 37.11, SE = 0.07, p = 0.001), WF (M = 36.60, SE = 0.09, p = 0.001), and WS (M = 36.71, SE = 0.48, p = 0.001); WF and WS were also lower than Ref. (p = 0.001). For the 55–60 min interval (p < 0.001, partial η2 = 0.786): PCM (M = 35.49, SE = 0.25) and WF (M = 37.22, SE = 0.06) were both significantly lower than Ref. (M = 37.60, SE = 0.08, p < 0.001). PCM was also lower than WF and WS (M = 37.21, SE = 0.20, p < 0.001). RHmc at 25–30 min showed significant differences (p < 0.001, partial η2 = 0.666). PCM (M = 77.87, SE = 0.79) was lower than Ref. (M = 80.66, SE = 0.94, p = 0.027); PCM, Ref., and WF (M = 78.83, SE = 1.53) were all significantly lower than WS (M = 87.99, SE = 1.42, p < 0.001). At 55-60 min (p < 0.001, η2 = 0.401), PCM (M = 87.75, SE = 1.06) was lower than Ref. (M = 91.97, SE = 0.18, p = 0.001) and WF (M = 92.43, SE = 0.12), while WF was significantly higher than Ref. (p = 0.043).
Cooling vest effect and individual response
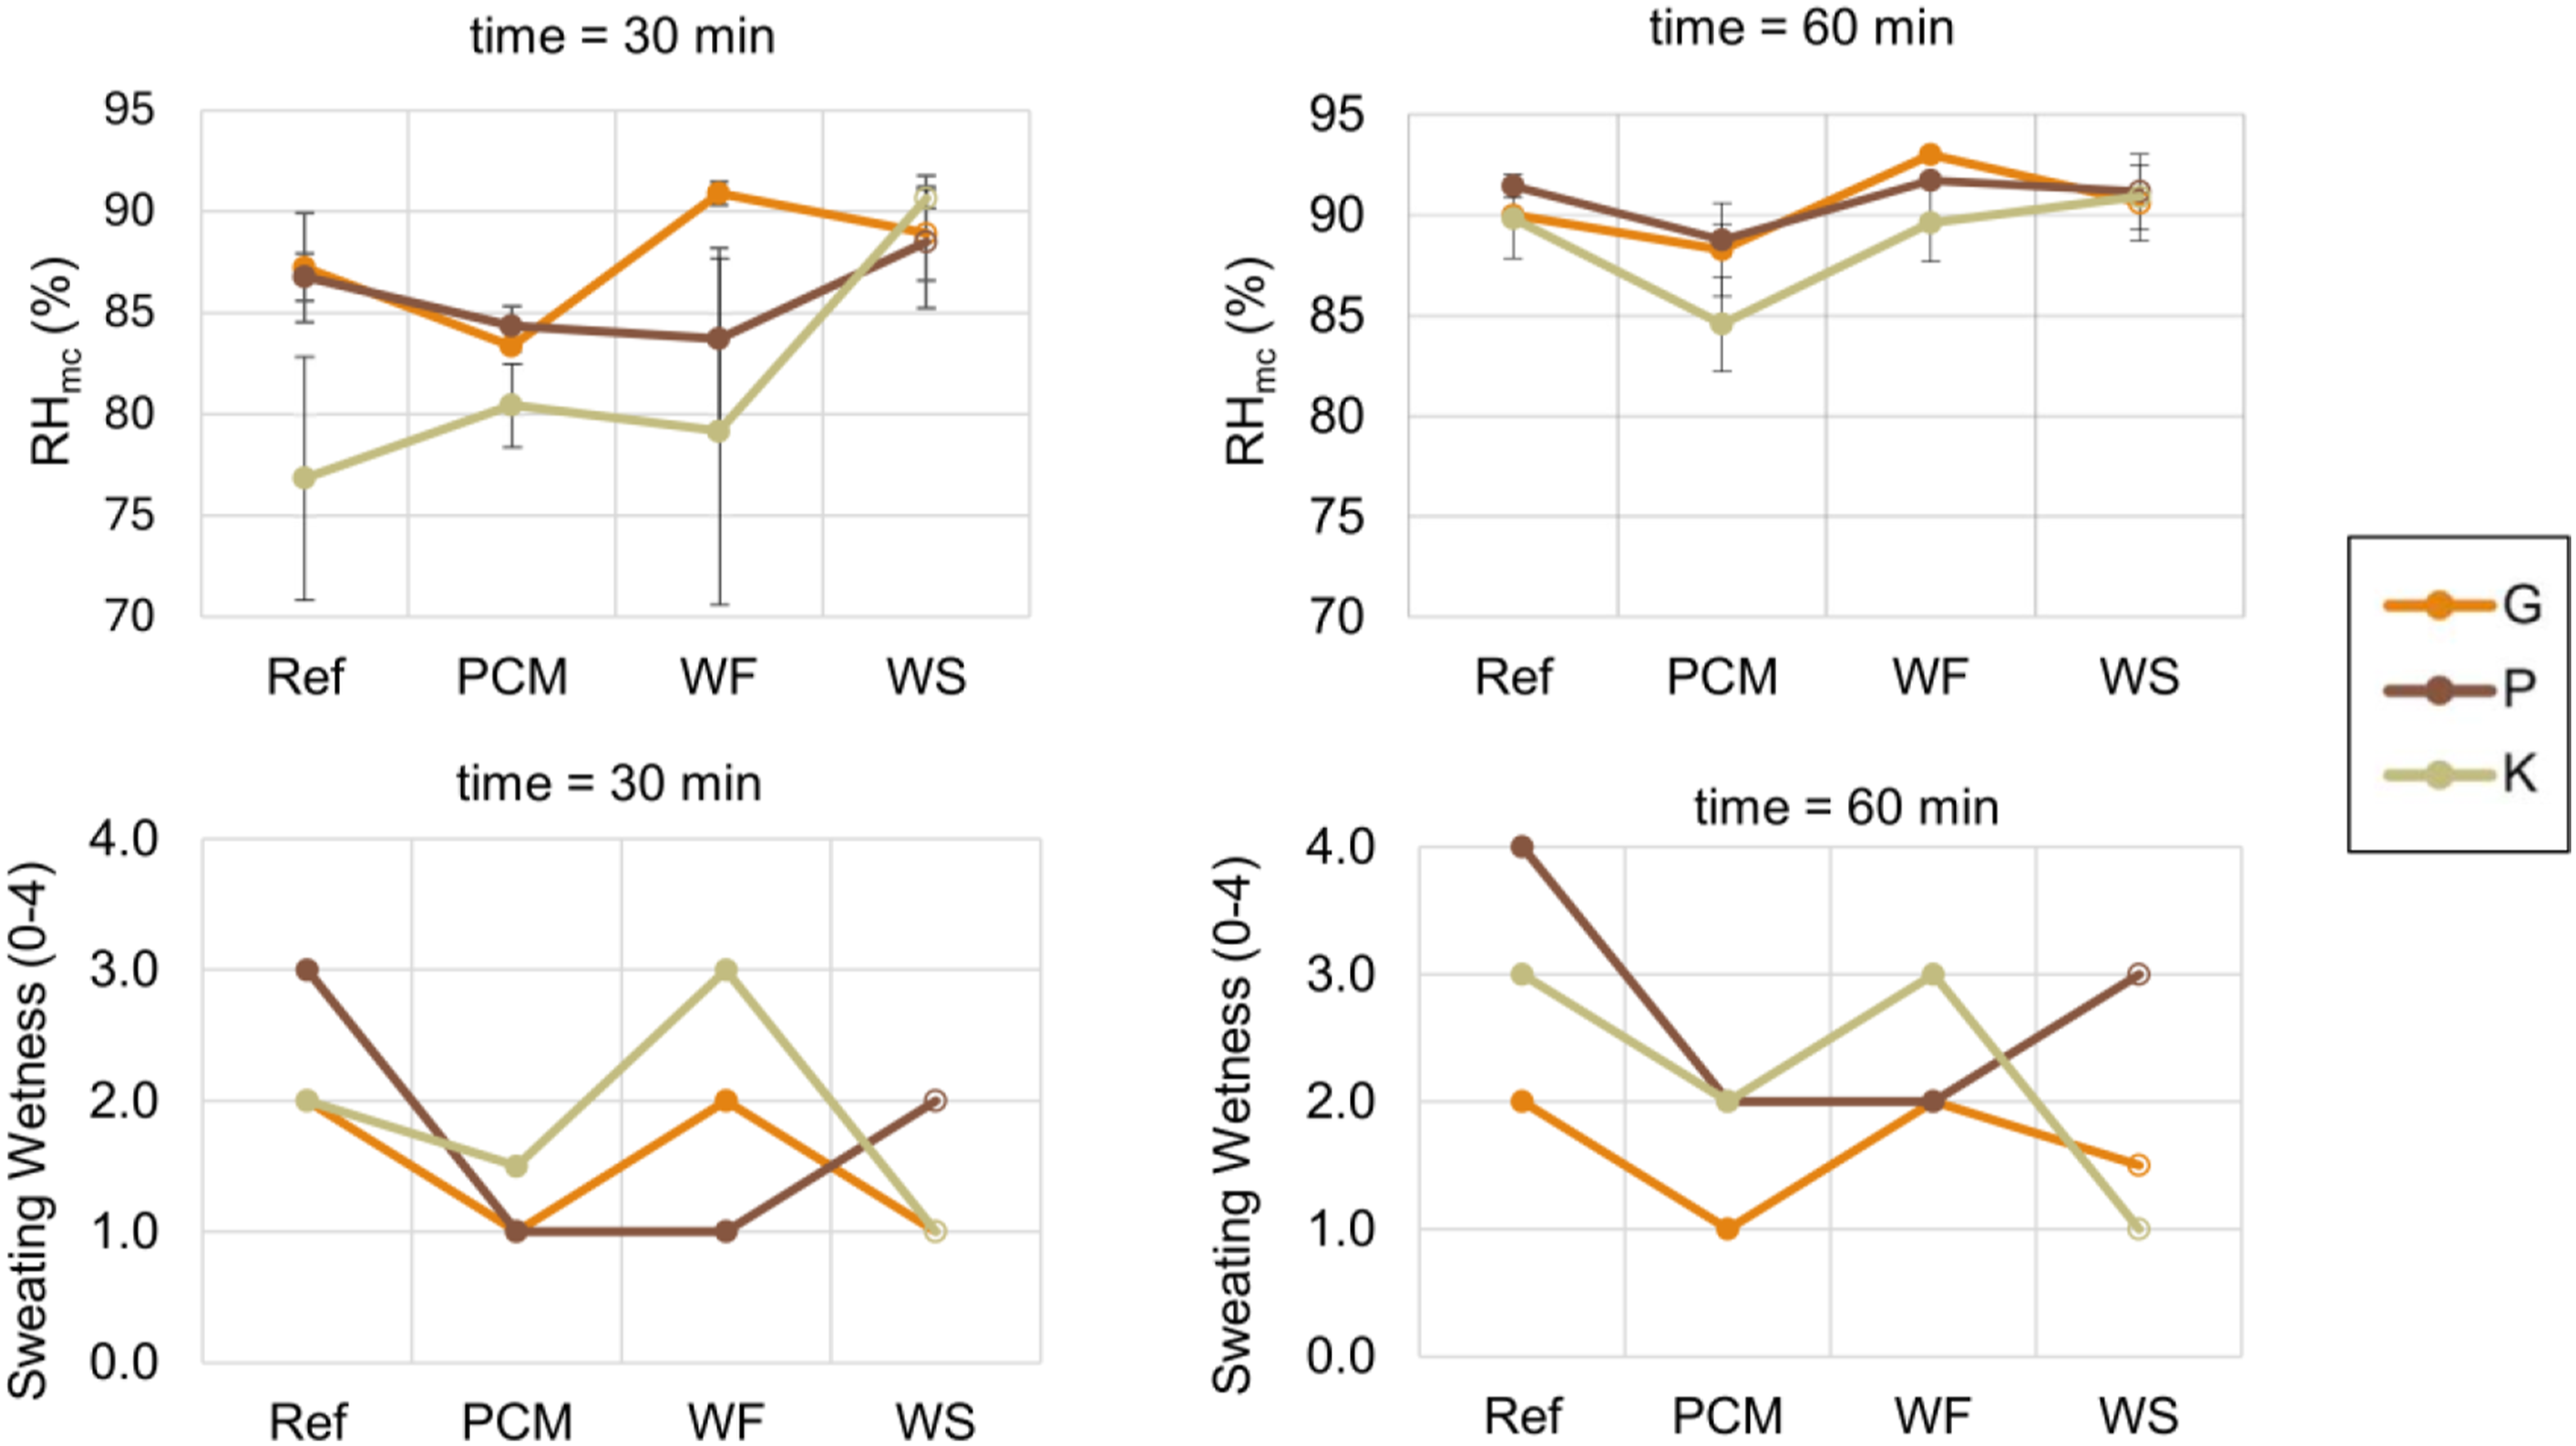
Figures 8 and 9 compare microclimate and subjective data per subject and cooling vest to see whether individual differences are outweighed by the impact of the vest. PCM has consistently lowest Tmc values across subjects. Two subjects show similar Tmc trends across vests, while P displays a distinct response for WS (higher Tmc than PCM and WF at 30 and 60 min). Subjective thermal responses do not consistently follow Tmc trends. CVs reduce warmth compared to Ref., except for one subject (K) where only PCM is perceived as less warm. Generally, PCM yields lower warmth ratings (except for P at 30 min). RHmc values show a similar trend across subjects at 60 min, with PCM having lowest %. Subjective sweating wetness follows a similar trend for two subjects across CVs, except for P (where PCM and WF have identical ratings and WS has higher ratings). This comparison shows that PCM has consistently lowest Tmc and RHmc values across subjects, while for WF and WS there is greater inter-subject variability. The relative differences between cooling vests in the objective data remain consistent across subjects. There is greater variability in subjective perception between subjects, and they do not fully match the objective microclimate data. The lower daypack load (% BW) for subject K (Table 2) appears to contribute to lower objective Tmc and RHmc values compared to the other subjects that had similar body weight percentages. However, this effect is not reflected in the subjective responses. Mean microclimate temperature (Tmc) and thermal warmth ratings at 30 and 60 min for three subjects (G, P, K) across the cooling vest conditions. Lines represent individual values with standard deviation. Mean microclimate relative humidity (RHmc) and thermal warmth ratings at 30 and 60 min for three subjects (G, P, K) across the cooling vest conditions. Lines represent individual values with standard deviation.
Discussion
This study provides novel insights into the thermophysiological effects of three passive cooling vests (PCM, WF, WS) worn beneath restrictive military clothing. Both advantages and limitations of these cooling systems are identified by integrating objective and subjective assessments. The study identifies when the passive cooling of each vest shifts from thermal relief to a thermal burden. While PCM consistently lowers microclimate temperature and humidity, subjective thermal and sweating wetness perceptions vary, indicating that personal comfort may not always match objective performance.
The reference clothing was identical across all CV conditions. Combat Shirt sleeves likely facilitated some evaporative heat transport from the arms, whereas evaporation the torso area was restricted by the backpack and ballistic vest. The wicking T-shirt exhibits a good one-way moisture transfer and a greater evaporative heat transport capacity than the combat shirt over it (Table 3). It likely contributed to a moisture gradient between the skin and combat shirt until moisture saturation was reached at around 30 min. Generally, the body’s ability to cool through dry heat transfer (conduction, convection, radiation) declines in an ambient T > 35°C, after which only sweat evaporation is effective. 36 The microclimate Tmc values show that this critical temperature was reached within the first 10 min for Ref., at 20–30 min for water-based cooling vests, and at 60 min for the PCM vest. The introduction of CVs increases total clothing weight, thermal and evaporative resistances. For the vests studied, this has a negative impact only once their cooling effect is exhausted. Once Tmc and RHmc plateau, cooling vests become a burden and the PCM delays this by prolonging cooling by dry heat transfer.
Evaporative cooling vests performance
Both water-based vests provided immediate cooling from the initially cool water, but this quickly diminished as the absorbed heat raised the water temperature. After 60 min, both vests became a thermal burden (Tmc values exceeding the Ref.) leading to moisture buildup, thermal and respiratory stress. Their rapid loss of cooling effect under restrictive layers supports manufacturer warnings proving their limited practicality in such settings. In contrast, without restrictive layers over them, evaporative CVs showed cooling of up to 3.5 h in thermal manikin tests. 12 Ciuha et al. 12 discussed that WS and WF vests both rely on surface evaporation but restrict sweat evaporation. They showed that WF provided significantly less cooling than WS. In our study, WF showed significant Tmc reduction compared to Ref. at 30 min, confirmed by both single and multiple-sensor ANOVA analyses. However, at 60 min it retained significantly more humidity than PCM and Ref., which might have compromised comfort. Based on our study and previous findings by Ciuha et al., the WF vest shows low cooling power due to its design, regardless of the presence of restrictive layers. The minimal weight change of the WF vest (Sweating and weight changes), lower evaporation, and comparable absorption to Ref. suggest inhibited sweat and water transport that caused greater sweat accumulation in the baselayer below it. WS initially increased RHmc by around 20% due to the soaked water. WS showed significant Tmc reduction compared to Ref. only from the ANOVA results at the 25–30 min interval, though with less significance than WF. It showed the highest weight loss and evaporation compared to other CVs and Ref., which is contrary to other studies on water-soaked clothing. Zhang et al. 17 reported that a water-soaked shirt under an air-ventilation jacket reduced total water loss, skin temperature, HR and sweat rate. Ciuha et al. 6 found that WS vests did not enhance evaporation even without additional layers. Still, in our case WS raised Tmc higher than in the previously mentioned study, indicating reduced performance when air flow is restricted over the vest. The increased total evaporation could be due to soaked water diffusing into areas not covered by the ballistic vest. Compensatory evaporation from uncovered areas like face and neck might have also occurred. 37 The reduced sweating wetness sensation in WS, despite the high objective RHmc and liquid absorption, may be related to the water-skin contact leading to a more pleasant sensation. This further supports the findings from Fillingeri et al. 30 that surface wetness sensation can differ from actual wetness, depending on thermal or tactile cues. Additionally, wetness in warm environments can be perceived as more pleasant due to sensory adaptation and psychological expectations. 38
PCM cooling vest performance
The PCM vest provided the longest cooling duration, slowing the Tmc increase, reducing cardiovascular strain (HR and BR), sweat rate, total liquid loss and improving subjective thermal and sweating wetness. Here, the reduced HR suggests lower cardiovascular strain since it is supported by the observations from the other parameters. The PCM reduced Tmc on average by 1.5°C compared to Ref. over the 2 hours of testing. The slightly reduced RHmc and lowest clothing absorption which indicate reduced sweat rate likely contributed to the lower sweating wetness perception. The PCM cooling effect diminishes more quickly after 60–70 min as observed by the more rapid Tmc rise above this point. As the microclimate temperature rose well above the PCM’s phase transition temperature (29°C), the increased sensible heat absorption contributed to a faster rise in Tmc. One way ANOVA confirmed the consistency of PCM in reducing Tmc significantly lower than all other vests and Ref. at 30 and 60 min, while RHmc differences are less consistent. Single-sensor analysis confirmed significantly lower RHmc for PCM compared to Ref. and WF, and generally lower RHmc for PCM than WS in the first hour of testing. Despite the added weight compared to Ref. and the other vests, this vest was not perceived as heavier. Despite better thermal and wetness perception, the PCM vest was not rated as more comfortable, mainly due to the solid-state rigidity and sharp edges at the start, suggesting further design improvements.
Direct comparisons with other studies are challenging due to differences in clothing, measurement methods, and test conditions, though some parallels can be drawn. In Ciuha et al. 6 passive and active cooling vests were tested at 35°C, 40% RH, 4.5 km/h for 2.5 h with lighter clothing and no restrictive outerwear. PCM showed the highest cooling efficiency, with a more pronounced effect than in our study (mean Tmc 24.8 ± 2.1°C vs 35.17 ± 0.53°C). This suggests ballistic wear may reduce PCM performance, although differences in exposure time or the unknown PCM melting temperature could also play a role. RHmc increased under PCM (85% ± 8%) after 150 min, similar to the values observed in our study. Further research should compare cooling vests under identical conditions with and without ballistic wear to verify these effects.
Practical considerations of PCM cooling vest
The PCM vest could be a better solution for shorter operations under ballistic wear compared to active technologies, providing similar cooling effect along with added benefits of silent operation, low power consumption, easy maintenance. A liquid circulating vest tested under ballistic wear in a similar ambient (30°C, 40% RH), but shorter duration and higher walking pace (50 min, 6.5 km/h), reduced skin temperature by 1.2°C over 50 min 7 This is slightly lower if compared with the PCM’s near-skin Tmc reduction in our study (2°C below Ref. at 60 min). As previously observed, the current PCM vest is not suitable for applications in hot climate exceeding 2 h. The observed discomfort from sharp edges in its solid state should be further addressed through different design or using encapsulation materials with better skin comfort. The studied vest is good in preventing cold-related discomfort due to its higher phase-change point that allows storage at higher ambient temperatures. In field applications, the current PCM with a phase change temperature of 29°C could be reactivated in the field using a portable fridge for around 30 min or during cooler nighttime conditions. The vest can be easily maintained by wiping it with alcohol. However, quick reactivation remains a logistical limitation if a portable fridge cannot be used. In further optimization, enhanced passive cooling can be achieved by covering a bigger body surface with PCM packs, but cooling extremities should be avoided to prevent impairing fine motor skills. 11 Adding passive elements like drying agents beneath the vest to absorb sweat appears unpromising - a study on a PCM vest showed that while microclimate humidity was reduced in heated cylinder tests, microclimate temperature increased by 0.6°C due to higher thermal resistance and heat release during moisture absorption. 39 Although insulation over PCM packs can reduce heat absorption from a hot environment and may be beneficial during lower-intensity activities, 40 under the current test conditions where skin temperature exceeds ambient T, this approach is unlikely to be effective. Durability after repeated use is an important practical consideration. PCM performance can degrade over multiple thermal cycles leading to changes in melting point, latent heat capacity, thermal conductivity, leakage, depending on the PCM composition, encapsulation, system design, and cycling conditions. 41
Study limitations and future work
The current study shows meaningful trends in responses to different passive cooling vests even with the small sample size. Moreover, other related studies on cooling vests have recruited a similar number (one to four subjects).42–46 However, this small sample size limits generalizability of the findings. Due to time and budget constraints, it was impossible to recruit more subjects or include thermal manikin testing. A larger sample size of at least eight subjects (minimum sample size calculated in Study Participants) would increase the statistical power, reduce variability, standard error and allow for more complex analyses. Guidelines for thermal comfort studies advice to include three to six more subjects beyond the minimum calculation to account for participants dropout or individual variation. 18 Hydration status was not carefully controlled - it was assessed only through camelback weight changes without accounting for sweat, respiratory, or metabolic losses, electrolyte balance, or prior fluid intake. Sweat measurements lacked precision, and clothing absorption was estimated only from main garments, excluding items like the backpack, QRV, helmet, socks, and shoes. Future studies should use more accurate methods, such as urine specific gravity, bioelectrical impedance, or precise sweat loss measurements. Core temperature, a key marker of heat strain, could not be analyzed due to Bluetooth data storage failure during the trials. As it directly reflects internal thermal load, improved core temperature monitoring in future studies is necessary. Also, measuring both near-skin microclimate and direct skin temperature could provide clearer insights into temperature gradients and individual responses and improve comparability with other studies. A broader challenge in personal cooling research is the lack of standardized testing methods, which can improve consistency and research progress. Further evaluation of the PCM cooling vest in additional settings (sun radiation, low RH, different clothing) could yield different insights. It would be interesting to study the effect of outer and inner clothing layers on PCM performance and PCMs with melting temperature higher than 29°C. Assessing long-term stability, cooling performance and wear resistance after repeated will provide clearer evidence of longevity. For example, using methods such as an accelerated thermal cycling technique, heat transfer experiments by contact (with hotplate) and radiant heat, or extended field trials such as the study by Chan et al.47–49
Conclusions
This study evaluated the performance of three passive cooling vests (PCM, WF, and WS) under Belgian Defense clothing with ballistic wear in hot climate. Wear trials determined the point where cooling vests shift from providing thermal relief to becoming a thermal burden. Once microclimate temperature and relative humidity plateau, vests become a burden and the PCM delays this by prolonging cooling by dry heat transfer. The PCM vest with phase transition point at 29°C was the most effective cooling solution, lowering Tmc by 1.5°C over 120 min compared to the reference, consistently across subjects. It also reduced sweat, cardiovascular strain, perceived warmth and wetness. The vest can be a better solution than active cooling for operations up to 2 hours, allowing silent use, low energy consumption and easy maintenance. However, its performance declines after 1 hour and after 2 hours of use it likely becomes a burden. This is supported by the significant differences in Tmc and RHmc found in PCM compared to the other CVs and Ref., at 30 and 60 min. No significant differences were found between CVs at 90 or 120 min for either Tmc or RHmc, suggesting the cooling effects are most distinct in the first hour of use. Design improvements are needed for better comfort under ballistic wear and long-term durability of the PCM needs to be further investigated. Water-based vests (WS and WF) showed limited effectiveness under ballistic wear with only temporary cooling. They showed significantly lower Tmc than Ref. at 30 min, with the WF vest demonstrating stronger statistical evidence. Both vests showed Tmc reduction up to 0.5°C at 60 min followed by a rapid performance drop after 1 hour beyond which they become a thermal burden. Regardless of the presence of an outer layer, both vests limit natural sweat evaporation, but the additional airflow restriction from ballistic wear accelerates their loss of cooling effectiveness. Subjective comfort did not always align with objective cooling performance, especially sweating wetness, highlighting the importance of individual perception during evaluation of cooling systems. These findings provide direction for improving thermophysiological comfort of restrictive clothing in hot climate and support further research and design refinement of wearable passive cooling systems.
Footnotes
Acknowledgments
The authors extend their gratitude to the Ministry of Defense for funding this research. They also sincerely thank the test subjects for their voluntary participation, collaboration, and valuable feedback. Appreciation to Inuteq for generously providing the cooling vests used in the study.
Informed consent
Informed consent was obtained from all individual participants included in the study. The authors confirm that all participants provided explicit consent for the publication of anonymized data derived from this study.
Funding
The authors disclosed receipt of the following financial support for the research, authorship, and/or publication of this article: This research was funded by the Ministry of Defense, grant number FED.DIV.2020.0031.01.
Declaration of conflicting interests
The authors declared no potential conflicts of interest with respect to the research, authorship, and/or publication of this article.
Data Availability Statement
The datasets generated and analysed during the current study are available from the corresponding author on reasonable request.