
Abstract
The emergence of highly instrumented manufacturing systems has enabled the paradigm of smart manufacturing that provides high levels of prognostics functionality. Of particular interest is to precisely determine geometric conformance or non-conformance of workpieces during manufacturing. This paper presents a new dimensional product health monitoring system that learns from in-process sensor data and updates the prediction of the product quality as the product is manufactured. The system uses data from multiple manufacturing stages, unlike from a single stage at a time, to predict the dimensional quality of the finished product that is updated with subsequent measurements such as On-Machine Measurements (OMMs), in on-line incremental learning fashion. It is based on self-supervised neural networks for dimensionality reduction, Gaussian Process Regression (GPR) models for probabilistic prediction about the end product condition and the associated uncertainty, and Bayesian information fusion for updating the conditional probability distribution of the end product quality in the light of new information. The monitoring approach was tested on the prediction of diameter deviations with validation results showing its ability to achieve an average accuracy better than 5 μm in terms of the Root Mean Squared Error (RMSE). Having obtained a Probability Density Function (PDF) for the measurand of interest, the conformance and non-conformance probabilities given the tolerance specifications are computed to support the principle of inspection by exception. This ability to construct a conformance probability-based product quality monitoring system using probabilistic machine learning methods constitute a step change to manufacturing prognostics.
Keywords
Introduction
Today’s manufacturing enterprises face many challenges to remain innovative, flexible, competitive and sustainable. One of the focuses of the upcoming fourth industrial revolution is the application of advanced data analytics and Artificial Intelligence (AI) algorithms in manufacturing systems to minimise the volume of non-value adding processes such as inspection while elevating end product quality. There are different terms used to describe the fourth industrial revolution including ‘Industry 4.0’ and ‘Smart Manufacturing’. Industry 4.0 envisions the factory of the future with interlinked, intelligent autonomous manufacturing systems to enable manufacturing with enhanced capabilities, such as time-effective decision-making for energy and resource efficiency as well as production agility.1,2 It combines features of other earlier manufacturing paradigms, such as lean manufacturing (eliminating all kinds of waste and non-added value operations without sacrificing quality and productivity) and agile manufacturing (enabling manufacturing systems to respond quickly to changing conditions and customer demand without compromising cost and quality), with the main concept being to develop intelligent Cyber-Physical Systems (CPSs) to allow machinery to make informed decisions from real-time data.3,4 Therefore, data analytics and machine learning are essential tools to achieve manufacturing intelligence.
Machine learning is a branch of AI, aimed at developing computer algorithms that can learn from a given set of data to perform specific tasks, such as classification, regression, and clustering, efficiently and accurately. These algorithms have the ability to progressively improve their performance over time, provided that more data are used for learning. 5 With the impressive amounts of manufacturing data available today, there has been growing interest in developing software systems capable of learning from their experience for complex decision-making. 6 More specifically, process and product health monitoring and control has received a great deal of attention in recent years as a means of addressing some of the long-lasting challenges in the manufacturing sector. One such challenge involves reducing the volume of non-added value processes and, hence, the manufacturing cycle time and cost without making concessions to product quality. 7 The main goal of product health monitoring and control systems is to ensure that the manufacturing process under consideration produces parts or products with desired properties, such as geometric dimensions and surface finish. Manufacturing processes typically involve several workstations or operations, such as heat treatment, subtractive Computer Numerically Controlled (CNC) machining, dimensional inspection, and assembly, to produce products of complex shapes with the desired properties and functional performance. Each operation is fraught with various sources of errors, many of which are difficult to quantify. In addition, because multiple manufacturing steps are usually performed to obtain the final product, the product quality deviations from nominal at a specific step are a combination of the errors generated at the current step, and the accumulated errors transmitted from preceding steps. 8
The purpose of product health monitoring in manufacturing is to map the sensor signal data to the product conditions and determine conformance or non-conformance of the product to the tolerance specifications. This typically involves generating sensor signal features that are sensitive to changes in process conditions and then mapping these process features, or a portion of them, to the product quality characteristics using machine learning techniques. Over the years, there have been many attempts to monitor product quality in manufacturing using machine learning techniques and sensor signals.9,10 However, most research studies have focused on predicting surface metrology characteristics. The application of machine learning algorithms for predicting dimensional metrology characteristics, which are typically of greater concern and importance depending on the product and application, is considerably limited. 11 In addition, most approaches to product health monitoring have focused on simple mappings that typically involve relating machining process signals such as tool vibrations and cutting forces to the finish-machined part condition whilst neglecting the variations propagated from previous manufacturing stages.7,12 Therefore, this research work will focus on the modelling of the product dimensional variations using in-process data from multiple different manufacturing stages. The data will be used to accurately predict the final part condition and determine compliance or non-compliance of manufactured parts to their design specifications. We formulate the regression problem in a probabilistic framework for monitoring the dimensional deviations of features of a product as it goes through a series of production operations using Gaussian Process Regression (GPR) modelling and Bayesian information fusion. A GPR model is a non-parametric kernel-based probabilistic model that provides predictions with uncertainty information. 13 To handle the high dimensionality of the input data, Principal Component Analysis (PCA) or replicator neural networks are used initially for dimensionality reduction. The features are derived from the bottleneck nonlinear hidden layer of the replicator network (or the extracted principal component scores in the case of PCA). Then, the GPR model uses the features as inputs and predicts the product health metric deviation vector obtained by a comparative Coordinate Measuring System (CMS).
A major research goal for product health monitoring is to develop intelligent monitoring systems able to function properly under various manufacturing conditions (e.g. milling at different speeds, feeds and depths of cut) in spite of inherent variability of the manufacturing process and uncertainty of the data used to train the predictive models. 14 Therefore, this paper proposes a new product health monitoring system that learns from in-process metrology data obtained from multiple manufacturing stages and updates a prediction of the product quality using new metrological information obtained from additional sensor data, such as On-Machine Probing (OMP) data. In fact, the robustness issue is particularly important when designing monitoring and control systems for process and product health. It is a key enabler for the manufacturing industry to adopt machine learning solutions for product quality assessment. The prediction of conformance probability developed in this paper will facilitate the idea of inspection by exception 7 by which parts that have high or low probabilities of conformance do not undergo time-consuming inspection. This results in significant savings in the manufacturing value chain. Another major enabler is to achieve robust performance with limited training datasets due to the high cost associated with experiment-based data gathering from manufacturing processes. Design of Experiments (DOE) is a powerful statistical technique enabling us to design, perform and analyse experiments efficiently and increase our understanding of the relationship between manufacturing process variables or controllable factors and product quality characteristics. 15 The novel contributions can be summarised as follows:
The monitoring system learns from in-process multistage manufacturing data to provide probabilistic predictions of the dimensional product health quality including uncertainty.
Unlike other dimensional quality prediction studies, and given new metrological data, the system can update its probabilistic predictions during manufacturing.
The proposed system can compute the conformance and non-conformance probabilities for a given tolerance interval leading to the minimisation of risks relating to incorrect accept/reject decisions.
The remainder of the paper is organised as follows: Section 2 reviews the literature relating to dimensional metrology, manufacturing process monitoring, and quality assessment. Section 3 describes the problem formulation and manufacturing case study that includes the experiments performed. Section 4 presents the proposed methodology, its application, and the analysis of the results. Concluding remarks are given in section 5.
Literature review
Dimensional metrology relates to the use of measurement or gauging devices to check whether the dimensional and form properties of a manufactured part conform, or not, to tolerance specifications. Tolerances are assigned to the product by the designer to ensure that the manufactured product will satisfy its functional requirements. In addition to dimensional inspection, manufactured products may undergo other inspections and tests such as surface analysis and mechanical and chemical tests to guarantee the overall quality of the product.16–18 Dimensional metrology is usually accomplished using automated measurement systems, such as Coordinate Measuring Machines (CMMs), because of their immense flexibility and low measurement uncertainty relative to the tolerance specifications of the products being manufactured, given that some calibration of the CMM has been undertaken. 19 However, CMMs require temperature control of their working environment to adequately meet their measuring capability and thus sacrificing part throughput. In addition, significant efforts have to be made towards evaluating the uncertainties associated with CMM measurements due to the large range of influence factors, such as environmental effects, kinematic and geometric errors, software errors, and probing effects.20,21 Techniques for task-specific Coordinate Measuring System (CMS) uncertainty evaluation and uncertainty sources associated with CMSs are described in Wilhelm et al. 22 The term ‘task-specific uncertainty’ refers to the uncertainty associated with the measurement of a specific feature of the workpiece by following a specific measurement strategy.
With advances in coordinate metrology, manufacturing enterprises have been able use CMSs to measure parts accurately on the shop floor, for example, enhanced CMMs (CMMs integrated with thermal error compensation techniques) as an alternative to traditional inspection approaches based on conventional CMMs and labour-intensive methods, such as hard gauging. 19 However, CMMs are based on heavyweight Cartesian structures which make rapid operation difficult and can cause hysteresis. In recent years, automated comparative gauges based on parallel kinematic structure have been developed for shop floor inspection tasks. These gauging systems are CMSs operating in comparator mode via software to minimise the influence of systematic effects associated with the CMS. 23 Parallel mechanisms, in contrast to serial mechanisms, have higher structural stiffness and lower moving mass and exhibit smaller inertial effects when under acceleration. However, they also possess important disadvantages, such as limited operational workspace compared to machine size and highly nonlinear kinematics and dynamics, which make their calibration and control schemes more difficult and challenging. 24 In terms of uncertainty evaluation, a major advantage of employing a CMS as a gauging/comparator measurement system is that the effort required to evaluate the uncertainties associated with absolute CMSs is greatly simplified because many of the systematic errors associated with the comparative CMS need not be mathematically modelled.25–27 Nevertheless, the traceability path associated with comparative coordinate measurement is not strictly defined as it originates from indirect measurement. 28
CNC machine tools are often employed as CMSs for in-process dimensional inspection of finish or semi-finish machined parts by loading a machine tool probe into the spindle. Although On-Machine Measurement (OMM) can reduce workpiece dimensional errors and allows immediate re-work of the machined part based on the inspection results of critical features, product quality deviations due to machine tool-induced errors, such as geometric errors, cannot be detected by this inspection approach. OMM is influenced by the same sources of error as CMM measurement, but differences may be found in their magnitude and dynamics. 29
Although shop floor CMSs are increasingly employed to claim conformance to tolerance specifications, manufacturers need to adopt more efficient methods for product quality assessment in order to remain competitive, increase revenue, and optimise the use of labour, machines, material, energy, and natural resources. Along with the rise of shop floor CMSs for dimensional inspection, the amount of in-process sensor data obtained from a manufacturing process has increased dramatically during the last years due to the recent developments in sensor and computing technologies. Therefore, smart manufacturing strategies are being developed and implemented to make timely decisions based on real-time data during manufacturing. They also aim to minimise or eliminate non-added value production stages, such as dimensional inspection, without compromising product quality. 30 In fact, customers’ requirements for ever more precise parts, shorter lead times, and greater product complexity and variability at lower cost have been the driving force for many advances in the manufacturing sector. In recent years, manufacturing informatics has emerged as an interdisciplinary and promising field of study to the development of technology that meets these growing demands. Manufacturing informatics aims to optimise the use of data and information within and between manufacturing processes in order to obtain gains in quality, agility, productivity and sustainability. A major component of manufacturing informatics is concerned with developing and implementing AI-based metrology informatics systems for process and product health monitoring and control since mathematical or physical models cannot precisely represent the true manufacturing system behaviour.31,32 The majority of research work performed in this area has focused on monitoring strategies for cutting tool wear and surface metrology characteristics, such as surface roughness heights. 33 However, the literature contains very few results on the development of monitoring and control systems for dimensional metrology characteristics. 11
Gao et al. 34 focused on online product quality assessment and developed a Support Vector Regression (SVR)-based product health monitoring system to predict the dimensions of the final parts in injection moulding from measured melt pressure, temperature, velocity and viscosity. Papananias et al. 12 applied a Bayesian linear regression model to predict the surface flatness of machined parts from OMP data and other in-process sensor data or available information during multistage manufacturing. Papananias et al. 7 also presented a machine learning-based approach to reduce the volume of dimensional inspections by actively detecting and then inspecting only those products whose health status is uncertain. Fernández-Pérez et al. 35 studied the influence of cutting parameters including cutting speed and feed on tool wear and hole quality for composite fibre reinforced plastics drilling operations using carbide countersink drill bits with diamond coating. Mondal et al. 36 focused on drilling experiments and developed Adaptive Neuro-Fuzzy Inference System (ANFIS) and SVR models to predict burr height and burr thickness using drill diameter, point angle and spindle speed. They then applied genetic algorithms to optimise both models and determine the optimum drilling process parameters in order to minimise burr height and thickness. Imani et al. 37 used genetic algorithms and Artificial Neural Networks (ANNs) to predict and optimise cutting force and surface roughness in milling of nickel-based super-alloys using various input parameters, such as cutting speed, feed rate, the axial depth of cut and coolant presence. Wang et al. 38 focused on improving the performance of product quality monitoring systems and developed a generative ANN model to predict product quality for a powder metallurgy process. Da Silva et al. 39 correlated hole quality parameters (roughness and cylindricity), power and electric current signals, and Acoustic Emission (AE) signals with tool condition to determine the best output parameter for tool wear monitoring in drilling of high-strength compacted graphite cast irons. They concluded that the electric current signal was the best output parameter for tool wear monitoring. Leco and Kadirkamanathan 40 focused on multi-robot countersinking applications and developed a perturbation signal based data-driven GPR model using multiple sensors, such as accelerometers, power transducers, and AE sensors, for monitoring the machined countersink depths in composite aircraft components. Liu et al. 41 proposed an adaptive ensemble learning framework for GPR models to monitor quality-related, but hard-to-measure variables in industrial processes. Duro et al. 42 proposed a multi-sensor data fusion framework for machining process monitoring to overcome the major limitations of AE-based monitoring, such as the sensitivity to sensor location and machining parameters. Measurement of AE from machining operations has become very popular as AEs can provide a cost-effective approach to machining process monitoring. McLeay et al. 43 presented an unsupervised learning method to observe the changing state of a milling process over time for the identification of faulty machining conditions using AE, vibration and spindle power data. Unlike other studies in this domain, the system is applicable to unfamiliar processes due to its unsupervised learning nature and another advantage is its sensing setup, which is minimally intrusive to the manufacturing process. Bai et al. 44 investigated three different dimensionality reduction techniques including PCA, Locally Linear Embedding (LLE), and Isometric Mapping (Isomap) to tackle the problem of multi-parameter manufacturing quality prediction using Support Vector Machines (SVMs), concluding that the Isomap-SVM model outperforms the other studied models. Moore et al. 45 proposed a machine learning-based method for machine tool and process condition assessment using various sensor signals including vibration and power to rapidly indicate that the machine tool or machining process has exceeded acceptable limits. Xia et al. 46 proposed a fault diagnosis method of flexible production line machining centre using a combination of the PCA and the Artificial Bee Colony based Learning Vector Quantisation (ABC-LVQ) neural network, using vibration signals. Su et al. 47 developed prediction models based on SVR for specific energy consumption of machine tools and surface roughness taking into account the tool wear evolution. They used as input variables the cutting depth, feed rate, spindle speed and tool flank wear. The results obtained from wet turning of AISI 1045 steel showed that the models built using cutting parameters and tool wear are more accurate compared to the models considering only cutting parameters.
A manufacturing system usually involves a combination of equipment, systems, materials and labour, and a series of production steps, involving material forming and heat treatment for material preparation, machining of the part, in-process and post-process inspection for part quality, followed by assembly, and testing. For a Multistage Manufacturing Process (MMP), each production step brings the workpiece closer to the designed, final form of the product, but additional variability in the workpiece is also introduced due to the local variations and the propagated variations from previous steps. 8 Interest in manufacturing process and product health monitoring and control has grown significantly during recent years. However, the implementation challenges and more demanding conditions and scenarios posed by shop floor environments have made the manufacturing industry to adopt few monitoring and control systems towards reducing the volume of non-added value processes, replacing manual, skill-based tasks, etc. Therefore, more practical solutions for industrial exploitation are required. This research work presents a new intelligent product health monitoring system that learns from in-process monitoring data obtained from various manufacturing stages and updates a prediction of the end product quality given new information obtained from subsequent measurements, such as OMP. In small-batch manufacturing, the main challenges for variation control of manufactured parts are the nonlinearity, uncertainty, high-dimensionality and sparsity of the data. Therefore, data-driven product health monitoring and control requires scalable and robust machine learning algorithms to adequately deal with these issues. We propose a kernel-based probabilistic framework for manufacturing process monitoring and control using feature-extracting self-supervised neural networks-based GPR modelling and information fusion via a Bayesian formulation. Having obtained a Probability Density Function (PDF) for the measurand of interest, the conformance and non-conformance probabilities for a given tolerance interval can be computed. To balance the risks associated with making an incorrect accept/reject decision for prediction results close to the tolerance specifications, an acceptance interval, such as an uncertainty interval may also be adopted.
Problem formulation and manufacturing case study
This section presents the manufacturing case study that provides a platform for the development of the machine learning approach to predict the final product quality and its conformance to manufacturing requirements. The case study involved experimental work for the generation of multi-operation manufacturing process data. The problem formulation is defined by the nature of the data and the monitoring requirements leading to the development and validation of a probabilistic AI framework for intelligent manufacturing. The manufacturing process included heat treatment, grinding, material surface hardness testing, subtractive CNC machining, in-process inspection, and shop-floor post-process inspection. The starting material blocks (steel EN24T) were hardened by heating at 835°C–845°C using a VECSTAR furnace and then quenched in oil. The quenched blocks were then tempered at different temperatures of 450°C, 550°C and 650°C to add variation in material properties. Five K-type temperature thermocouples were placed within the furnace to measure variation in the temperature gradient during this process. Following heat treatment, the heat-treated material blocks were ground to improve their surface quality and then mechanically tested for surface hardness using a Rockwell device.
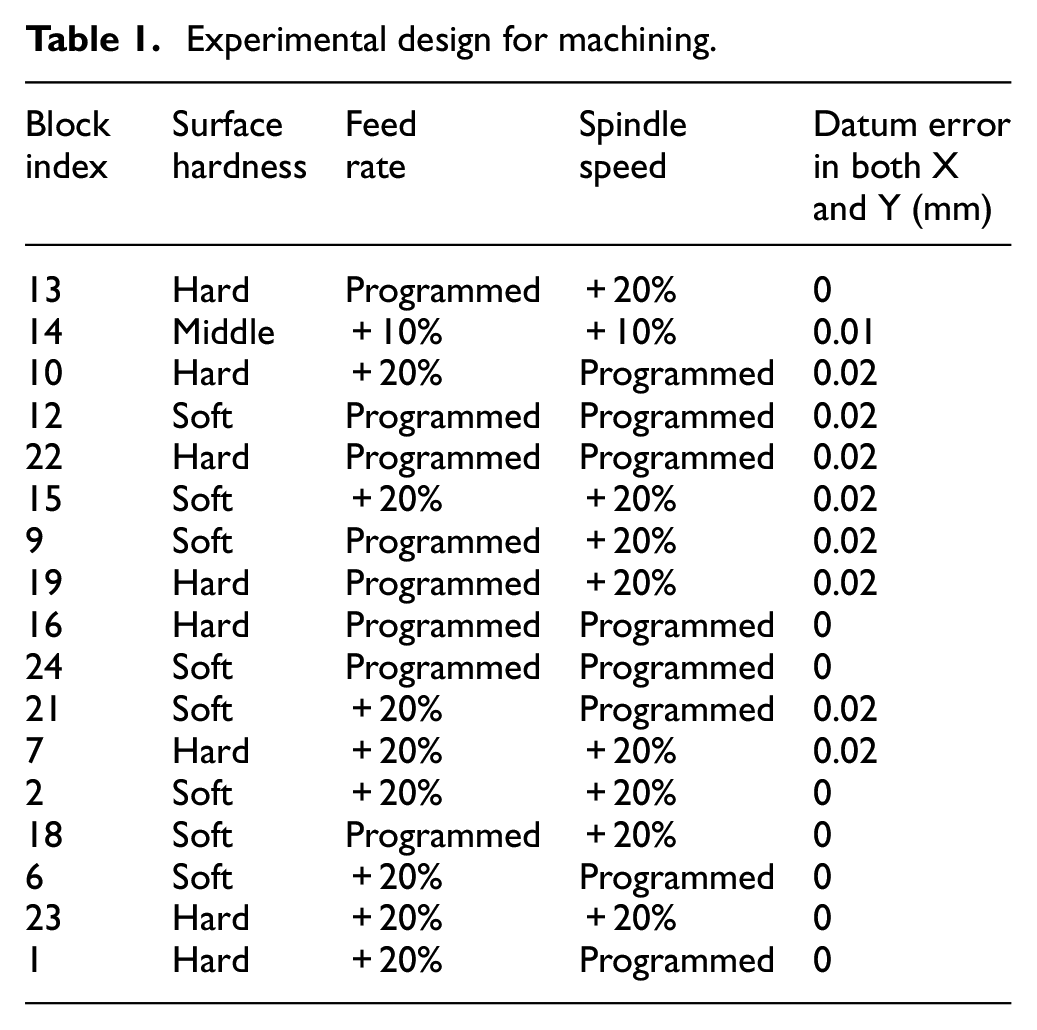
A 3-axis CNC vertical milling machine (DMG MORI NVX 5080) was used for subtractive machining. The X-axis maximum travel, Y-axis maximum travel, and Z-axis maximum travel are 800, 530 and 510 mm, respectively. A full factorial DOE was performed for machining, considering four input variables (factors): surface hardness of the workpiece material, feed rate, spindle speed, and datum error in both X and Y axes when setting the workpiece in the second orientation (see Table 1). All the factors included two levels and one centre point. Before each experimental run, a Leica microscope was used to evaluate the level of wear of each flute of the cutting tools used for machining. The tools were replaced when exceeding specific flank wear width values. During machining, force and tool vibration signals were obtained at 10 kHz using a plate dynamometer and an accelerometer sensor, respectively. The dynamometer was a Kistler multicomponent dynamometer (9255B). The Kistler DynoWare and the National Instruments (NI) LabVIEW SignalExpress software packages were used to measure cutting forces and tool vibrations, respectively. The workpiece was fixed using a vice bolted to the dynamometer. Coolant was used for all the experimental runs. Besides the 17 parts manufactured according to the full factorial design, another part was produced to be employed as a master part during dimensional post-process inspection.
Experimental design for machining.
After machining each side of the workpiece, OMP was performed using a Renishaw OMP60 optical transmission probe whose unidirectional repeatability is 1 μm 2σ. The probing cycles were developed using the Renishaw Inspection Plus software package. A Renishaw Equator comparator measurement system was also employed for close-to-manufacturing measurement using the CMM Compare Method and a Mitutoyo CMM located in a metrology lab. With this method, the uncertainty of comparator measurement achieved is dependent on the CMM used to calibrate the reference master part. The comparator measurement system was used in both probing and scanning modes. Because the Equator applies a point-to-point comparison, careful consideration of the scan measurement is required, for example, scanning over the same section of a geometric feature twice may lead to problems with the comparative analysis software used to compare the production parts to the master part. The fixturing design and methodology for comparative coordinate measurement were validated using the Golden Compare method prior to actual tests. Figure 1 shows the developed MMP and the product Computer-Aided Design (CAD) model. The measurand of interest in this work is the diameter of the circular feature labelled in Figure 1. The nominal value of the measurand is 40 mm.
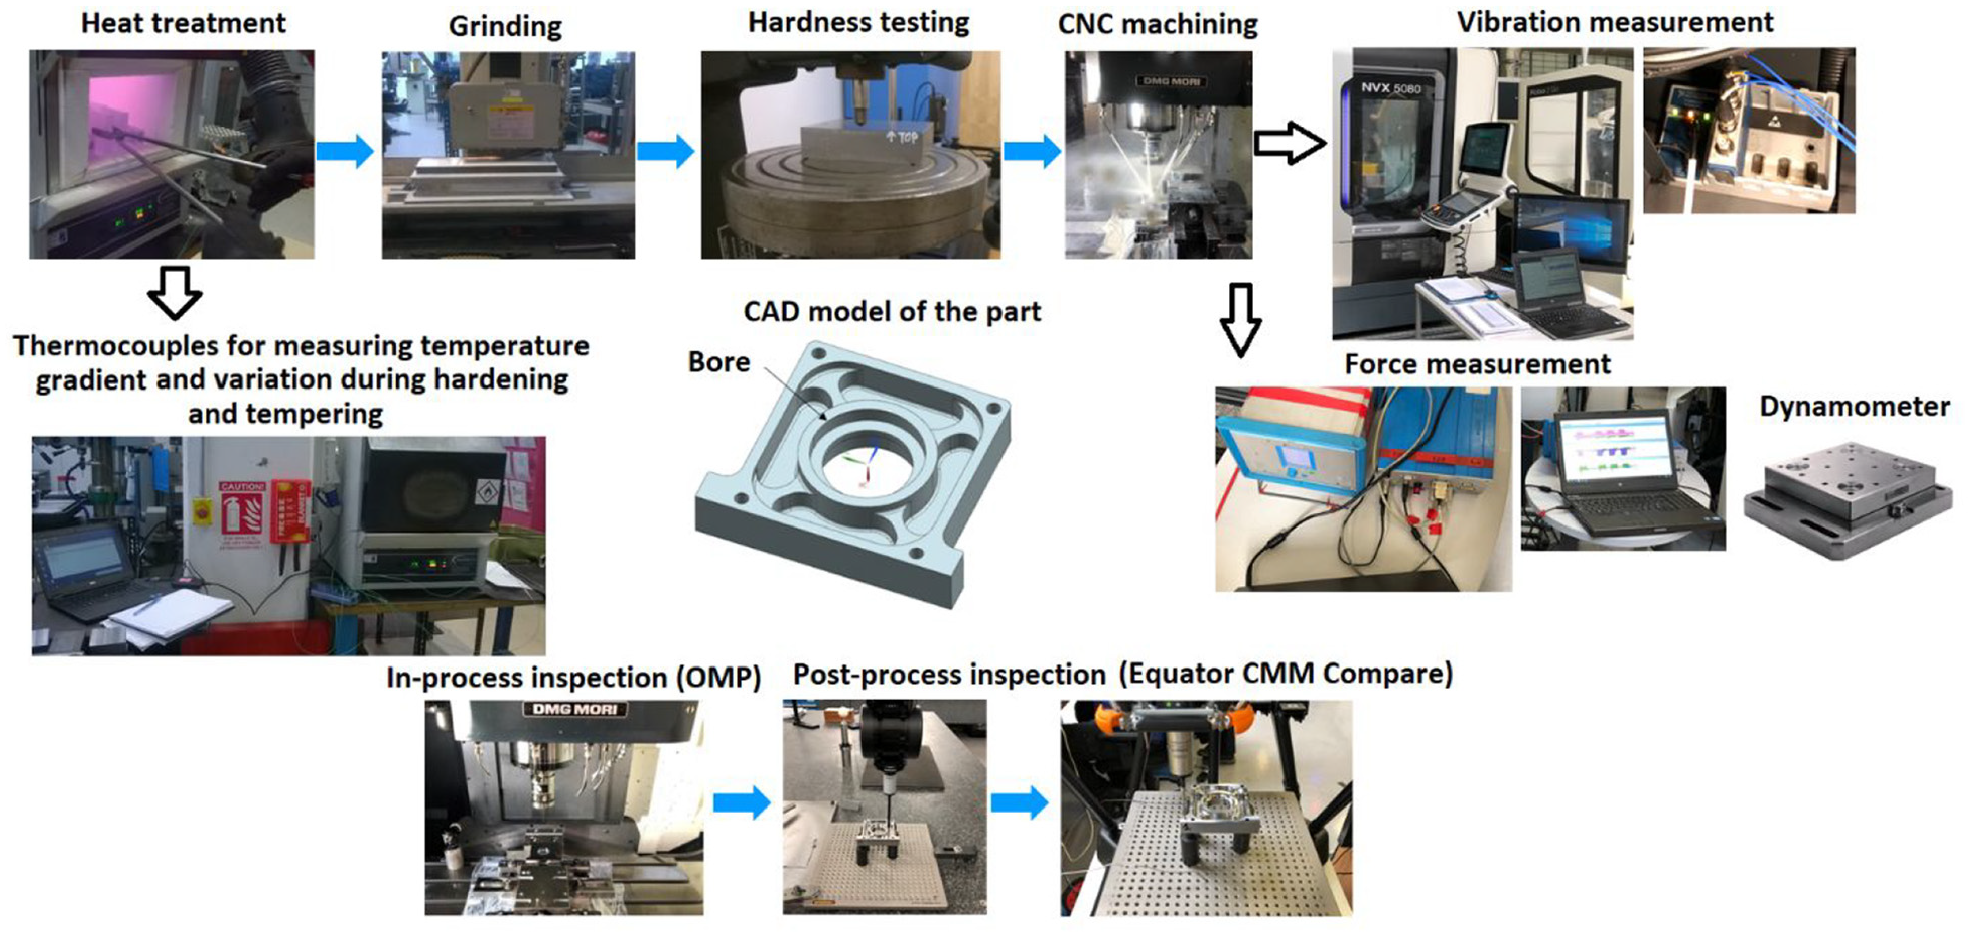
The experimental setup and the CAD model of the part. The manufacturing stages are indicated above the panel of subfigures as are the measurement instruments.
The proposed framework for manufacturing process monitoring and control
The majority of machine learning applications in the context of manufacturing systems for process monitoring and control are concerned with learning from in-process monitoring data obtained during a single-stage process. However, multiple different processes are typically involved to produce a metallic product and thus, the end product quality variation is an accumulation of variations from all the manufacturing stages the product went through. The steps towards developing and validating the proposed probabilistic machine learning-based framework for monitoring all equipment and processes required to manufacture a part are the following: the pre-processing of the collected data, for example, data cleansing and feature generation for transforming the sensor signals into useful features; feature extraction/transformation using statistical and machine learning techniques, such as PCA and unsupervised ANNs, for using the most meaningful features which best characterise the manufacturing process conditions; training and testing a certain machine learning model, such as ANNs and GPR models, and an information fusion algorithm in case of subsequent measurements during manufacturing; and finally decision making for conformity assessment given the product tolerance specifications and metrological information about the measurand of interest in the form of probability distributions. The product health measure probability distributions are used to describe the uncertainty associated with the computed value of the measurand obtained by probabilistic machine learning or an inspection report. MATLAB was used to implement the proposed framework. The framework relies on the inherent assumption that part dimensional quality parameter is predictable using in-process multistage manufacturing data. Furthermore, it also relies on the assumption that the uncertainty in the model prediction has a Gaussian distribution. These assumptions are common in engineering applications including manufacturing and have underpinned successful applications. Figure 2 shows the proposed methodology for intelligent manufacturing.
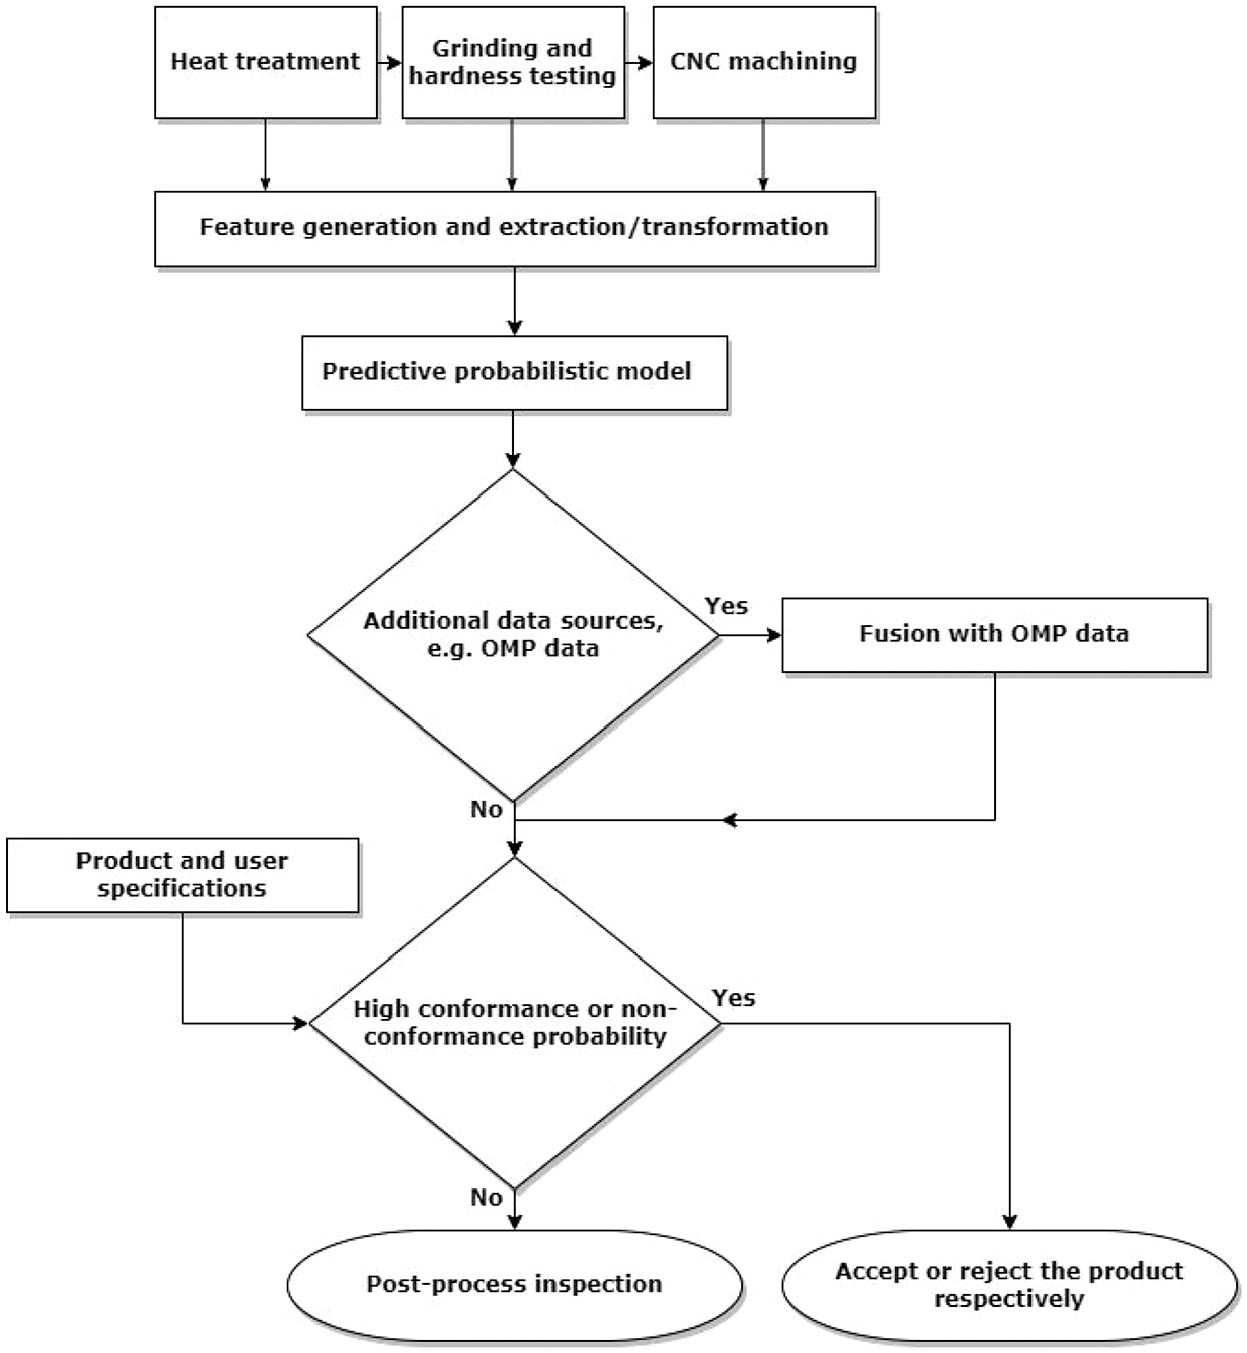
Proposed methodology.
Feature generation and extraction/transformation
The following features were generated from the MMP monitoring data: (i) the maximum tempering temperature; (ii) a three-state variable associated with the material hardness; (iii) the Root-Mean-Square (RMS) and sample kurtosis, skewness, variance and mean features of tool vibration components (Vx, Vy, Vz) and average values of force components (Fx, Fy, Fz). Normalisation by the 2-norm of the extracted features was followed by scaling to achieve zero mean and unit variance. The dimensional metrology characteristics of the product were obtained using the Equator comparator measurement system based on CMM Compare. For modelling the final product quality, the product health metric deviations computed as the difference between the post-process inspection measured value and the nominal value were used as output data. Figure 3 shows a number of bivariate histogram plots of the force and vibration data to emphasise the challenges of the resulting data-driven modelling problem characterised by high dimensionality and sparseness. Such data characteristics are encountered in many manufacturing processes, for example, low-volume aerospace manufacturing applications.
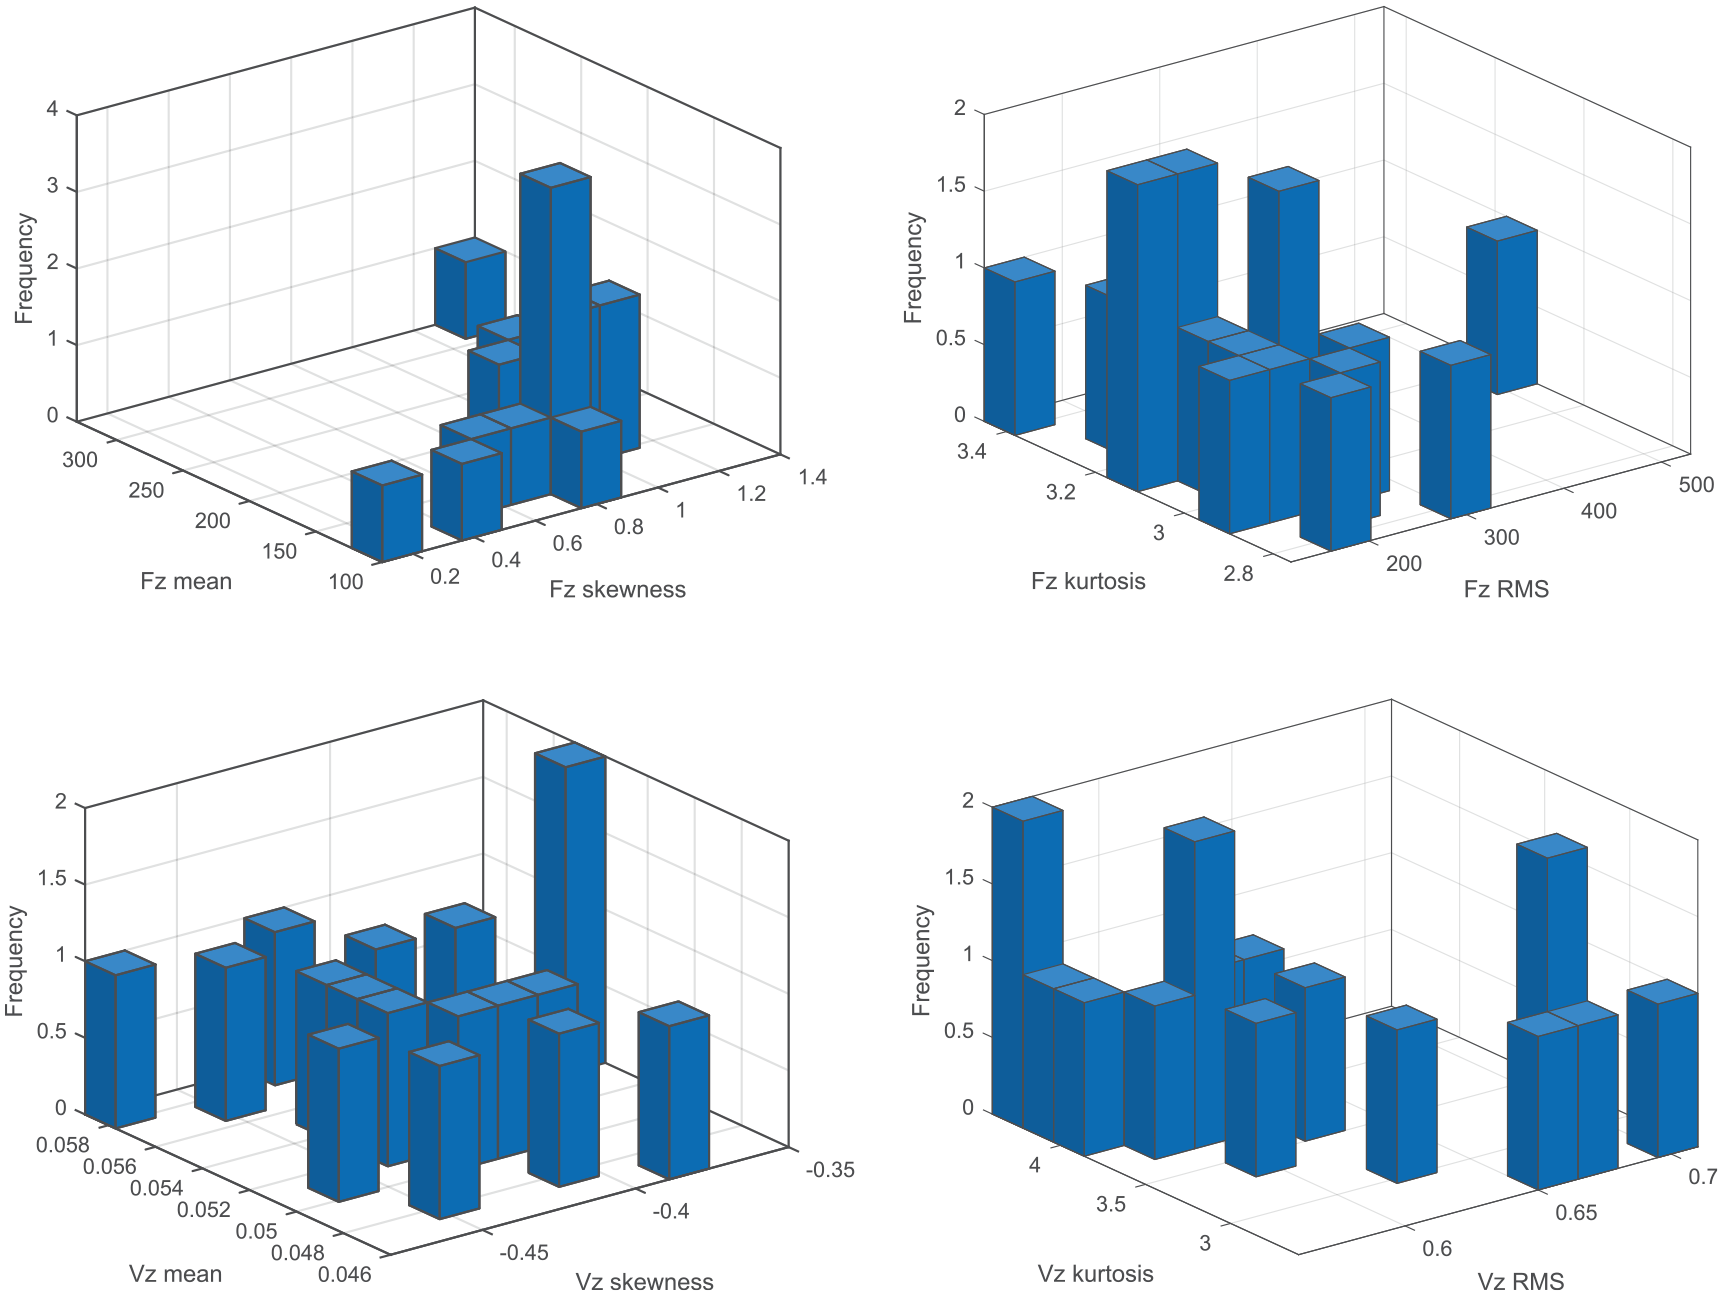
Bivariate histogram plots of the force and vibration data.
Due to the multidimensionality and the limited sample size available for training a data-driven model for a specific machine learning task, dimensionality reduction tools such as PCA and unsupervised ANNs are used to identify low-dimensional structures in high-dimensional data. To linearly transform the set of measured variables into a smaller set (

where both
ANNs can also be used as unsupervised learning models for dimensionality reduction. These networks are known as autoencoders or bottleneck MLPs because the size of the hidden layer is smaller than the size of the input and output layer. In particular, an autoencoder is an ANN that learns from experience to reconstruct the input at the output in order to act as a feature detector. Therefore, the input layer and the output layer have the same size,

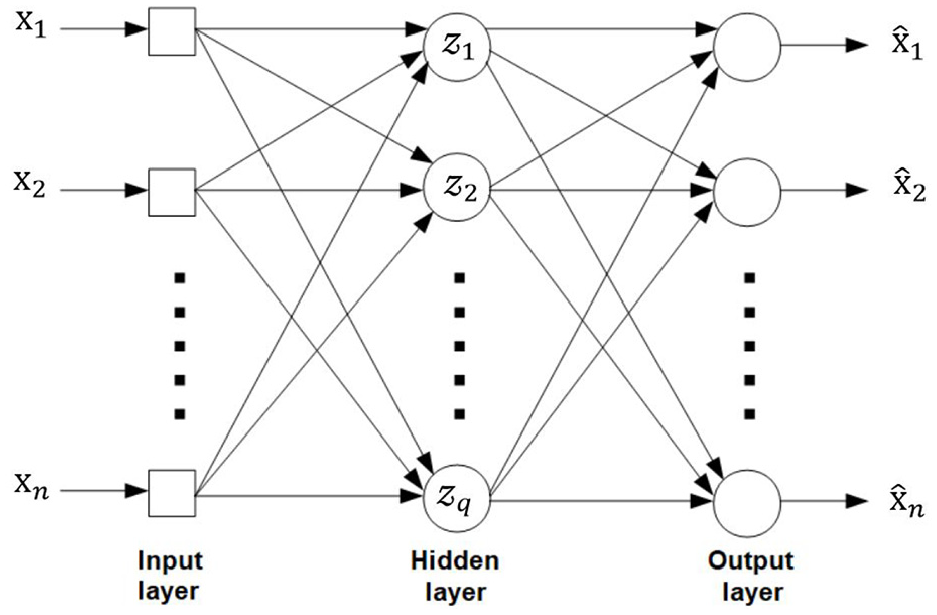
Autoencoder with a single hidden layer.
The mapping

As manufacturing systems are highly complex and uncertain, preliminary simulations were carried out to determine the key parameters for the modelling problem. In this work, logistic sigmoid activation functions were used for the hidden layer and linear transfer functions for the output layer. The size of the hidden layer was set to five. The cost function used for training was an adjusted Mean Squared Error (MSE) function in order to construct a sparse autoencoder and ensure good generalisation properties. The training criterion involved three terms: the MSE loss function
Predictive probabilistic modelling
In this paper, we use predictive probabilistic models for supervised learning, and specifically, linear probabilistic regression and GPR models. Although linear regression models are interpretable and straightforward to implement, it may lead to poor predictions if the target function cannot be well modelled by a linear function. A different modelling approach is to approximate the input-output mapping function using a set of basis functions whose parameters are optimised during training. However, instead of explicitly specifying a set of basis functions, we use a probabilistic framework based on GPR modelling which combines kernel methods (a class of algorithms that solve the modelling problem using a similarity function over pairs of data points) with Bayesian inference. This approach treats the unknown input-output mapping function
Consider a model of the form as follows 13 :

where
A Gaussian process is a distribution over functions and is completely specified by its mean function:

and covariance function:

The mean function

A common kernel function choice is the squared exponential kernel function
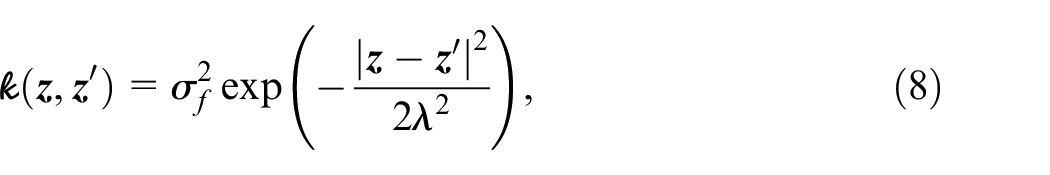
where
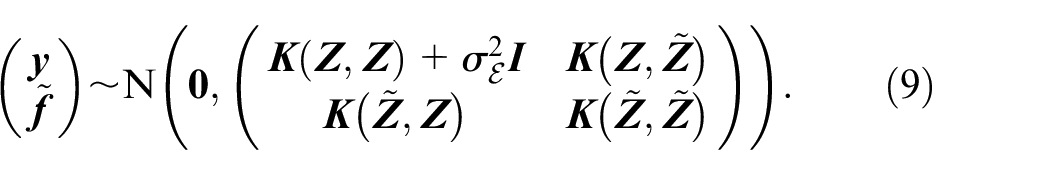
Hence, the posterior predictive density for
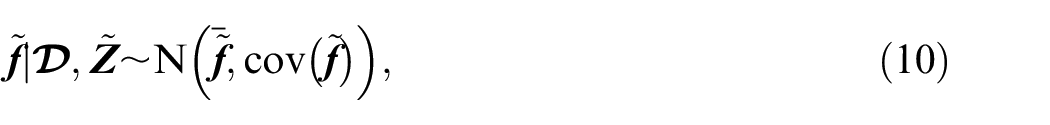
where,
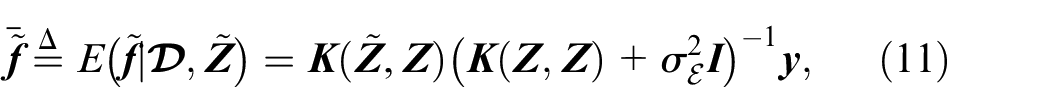
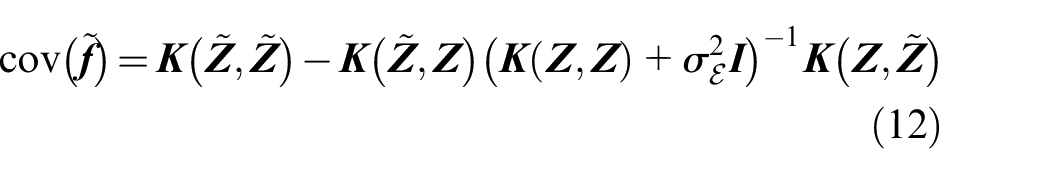
Using a more compact notation, that is,
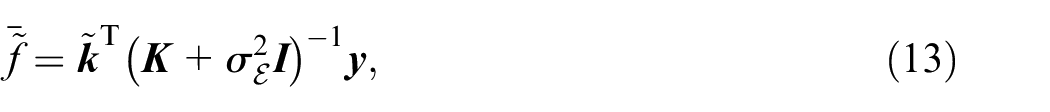
and
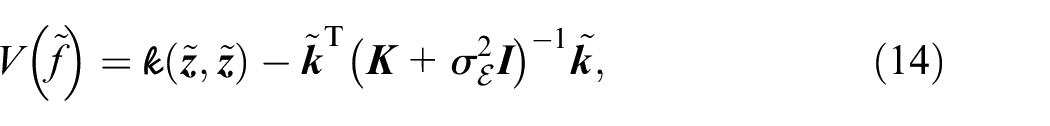
with
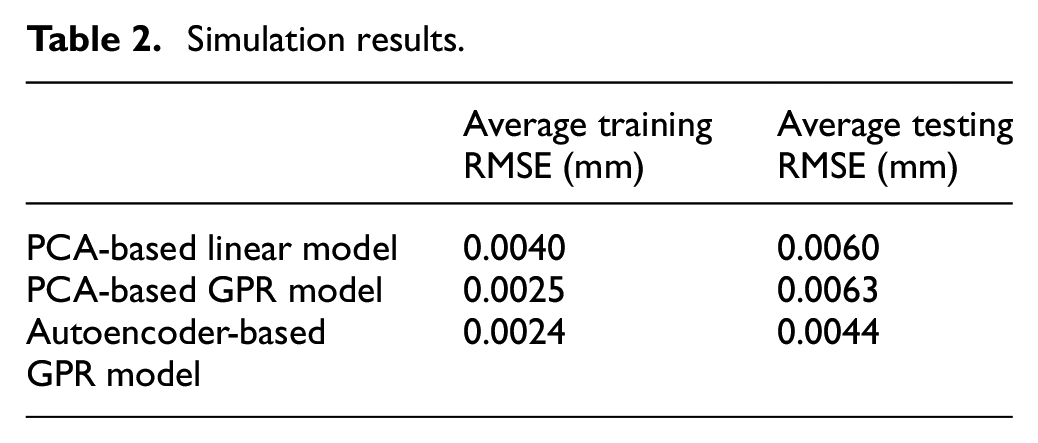
The leave-one-out cross validation approach was used to measure the performance of the product health monitoring system on unseen data. This validation approach was chosen to maximise the amount of data available for building the predictive model given the challenges of the cost and time associated with manufacturing parts. For each validation case, 16 parts were used for training the intelligent dimensional product health monitoring system and one part was used for testing it and repeated across all folds. The average percentage variability captured by the first five components on the training data was 95.31% and by considering only the first five components the average reconstruction Root Mean Squared Error (RMSE) was 0.0160. The average testing reconstruction RMSE considering the first five components extracted with the trained dimensionality reduction model using the test dataset was 0.0314. The average training RMSE of the autoencoder was 0.0474 and the average testing RMSE was 0.0614. The average training RMSE obtained by the PCA-based linear regression model was 0.0040 mm and the average testing RMSE was 0.0060 mm. The average training RMSE obtained by the PCA-based GPR model was 0.0025 mm and the average testing RMSE was 0.0063 mm. The average training RMSE obtained by the autoencoder-based GPR model was 0.0024 mm and the average testing RMSE was 0.0044 mm. Table 2 shows the RMSE results obtained by the predictive models. Table 2 shows that the predictive model with the lowest RMSE is the autoencoder-based GPR model.
Simulation results.
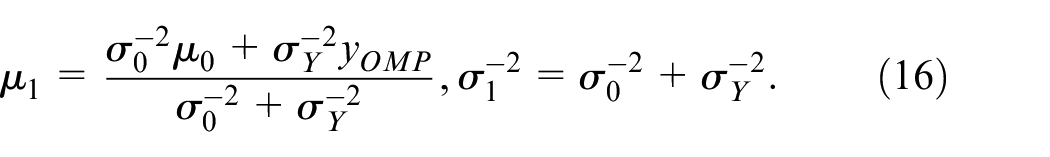
Finally, we can update our predictions and prediction intervals by considering any future metrological information, such as OMP computed results
With the use of a conjugate prior distribution, that is,
Decision making – Conformity assessment
In a conventional manufacturing process, the determination that a machined part conforms to its specified tolerance specifications usually relies on a CMS inspection report, such as a CMM. However, because of the measurement uncertainties and sampling effects (reflecting the fact that the metrological information obtained by the CMM provides only partial information about the complete part geometry as the part is only measured at a finite number of coordinate data points), there is always the risks of incorrect accept/reject decisions. During recent years, there is an increasing interest in monitoring the manufacturing process to evaluate the end product quality through in-process measurements and machine learning. This section presents a framework for calculating the conformance and non-conformance probabilities, given a tolerance interval and a PDF for the product quality characteristic of interest.
A tolerance interval is used to specify permissible values for the measurand

where

where
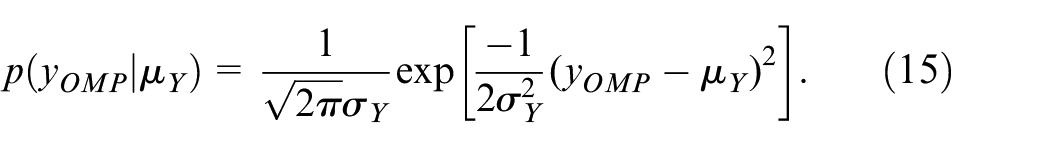
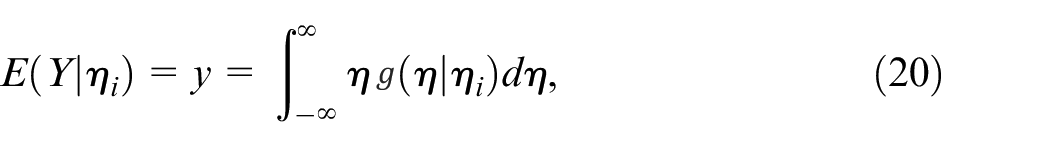
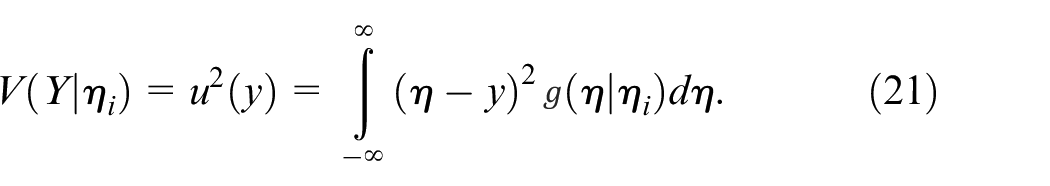
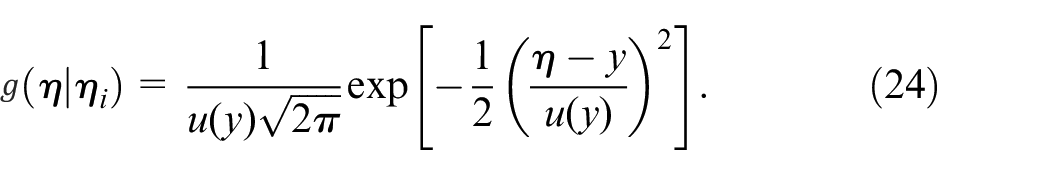
The measurand is characterised as a continuous random variable

where
A supplementary uncertainty measure is given by the expanded uncertainty

where
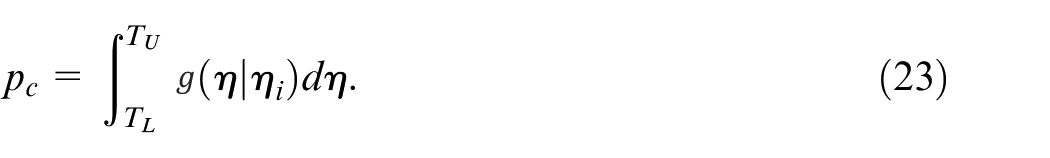
The non-conformance probability is given by
For a two-sided tolerance interval with tolerance limits
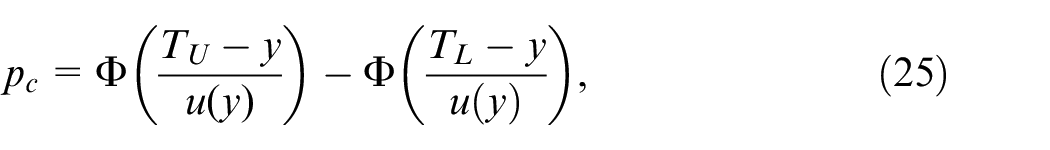
where
Our manufacturing capability can be represented as a probability distribution using historical dimensional inspection results from the production of the same item and Monte Carlo simulation (see Figure 5). Provided the product tolerance specifications for diameter,
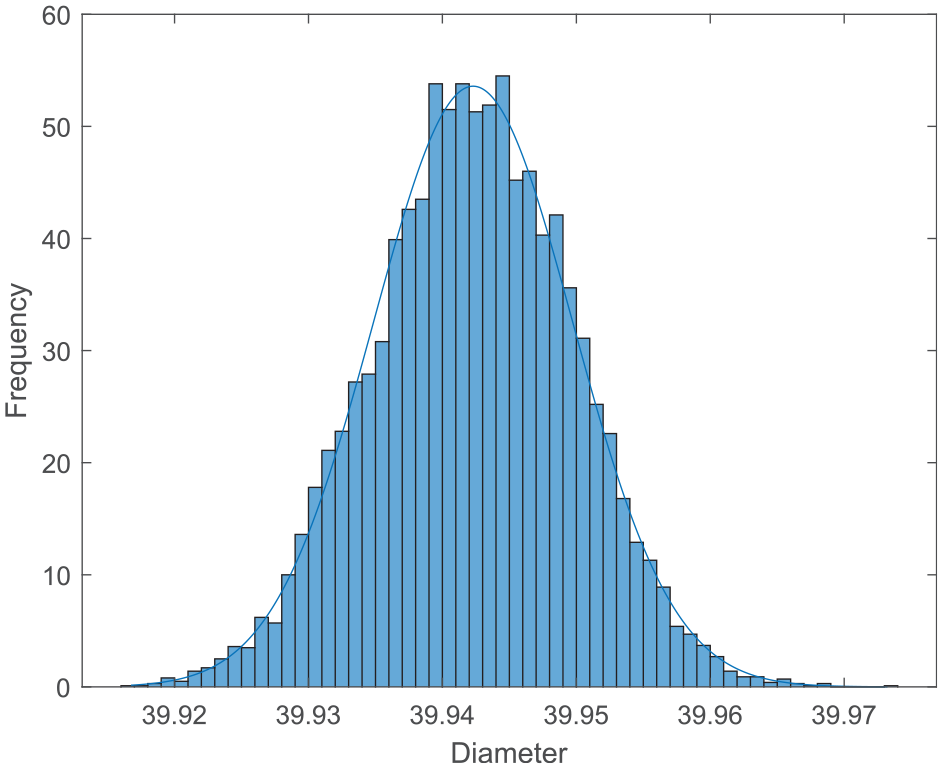
Manufacturing capability (without part 23).
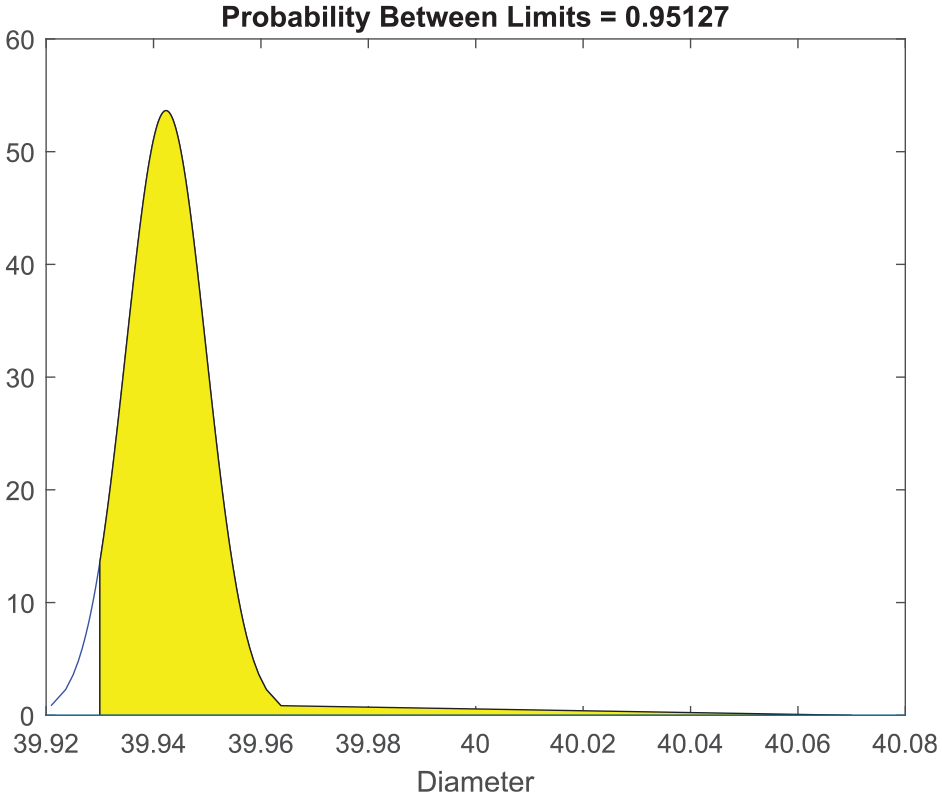
Probability of conformance with no information about Part 23 being manufactured.
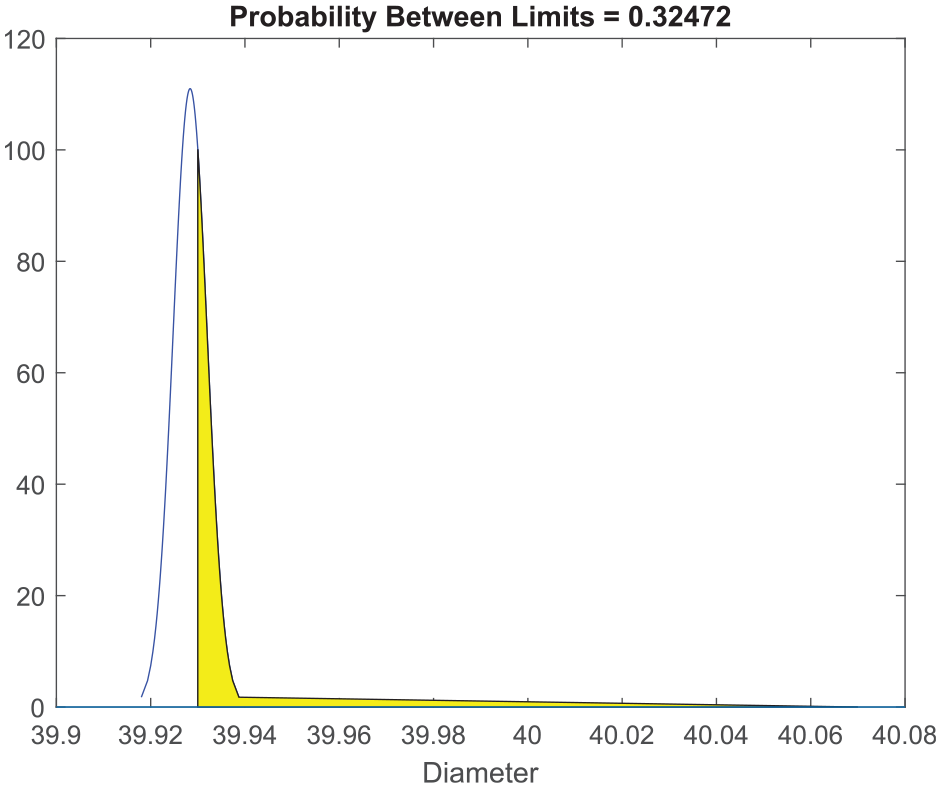
Probability of conformance for Part 23 based on probabilistic machine learning.
In addition, we can update our prediction results in the light of new data using Bayesian statistical inference. For example, by combining the information obtained by an OMP inspection cycle with the prediction results via Bayes rule allows us to obtain a posterior distribution of the end product quality. The OMP inspection data were obtained using a 3D Touch-Trigger Probe (TTP) with optical signal transmission. For example, for part 24, the probability of conformance with no information about the specific product is 87% (see Figure 8). This part (24) is a conforming product. Figure 9 shows the probability of conformance based on the prior probability distribution obtained by probabilistic machine learning while Figure 10 shows the probability of conformance based on the posterior probability distribution that combines the prior knowledge gained by predictive modelling and the new information gained after machining using OMP. In this way, we can predict the feature dimension and calculate the conformance probability on a specific part over the full manufacturing chain. Note that, in this example, both sources of information are well represented with normal distributions. The evaluation of uncertainty associated with OMP measurement was also performed based on ISO 15530-3. 50
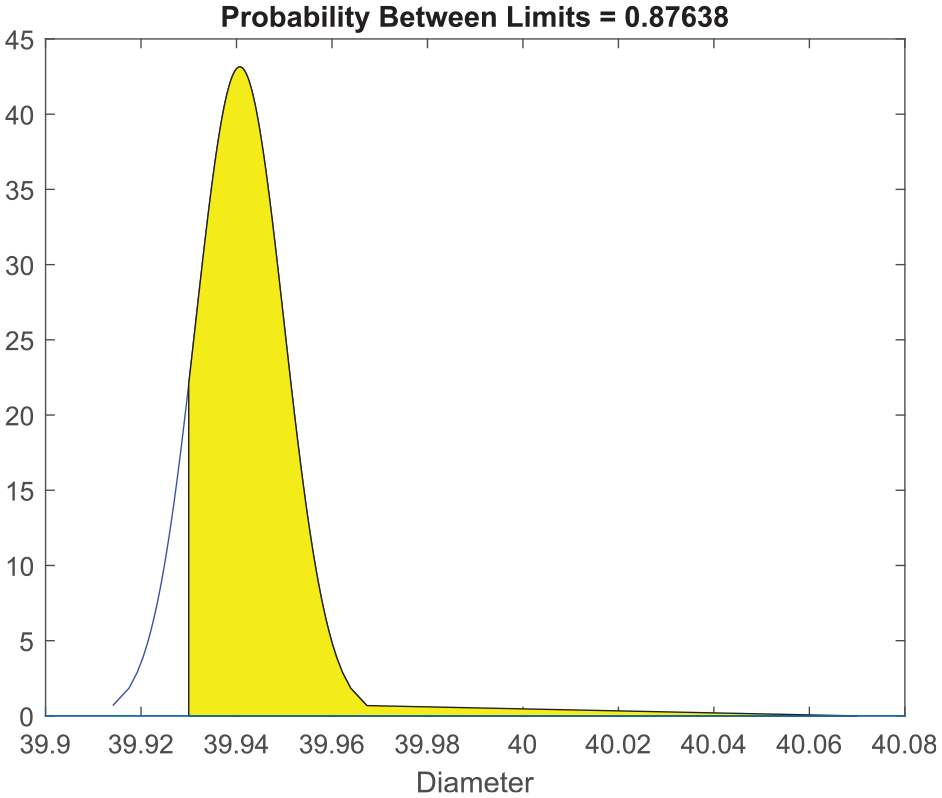
Probability of conformance with no information about Part 24 being manufactured.
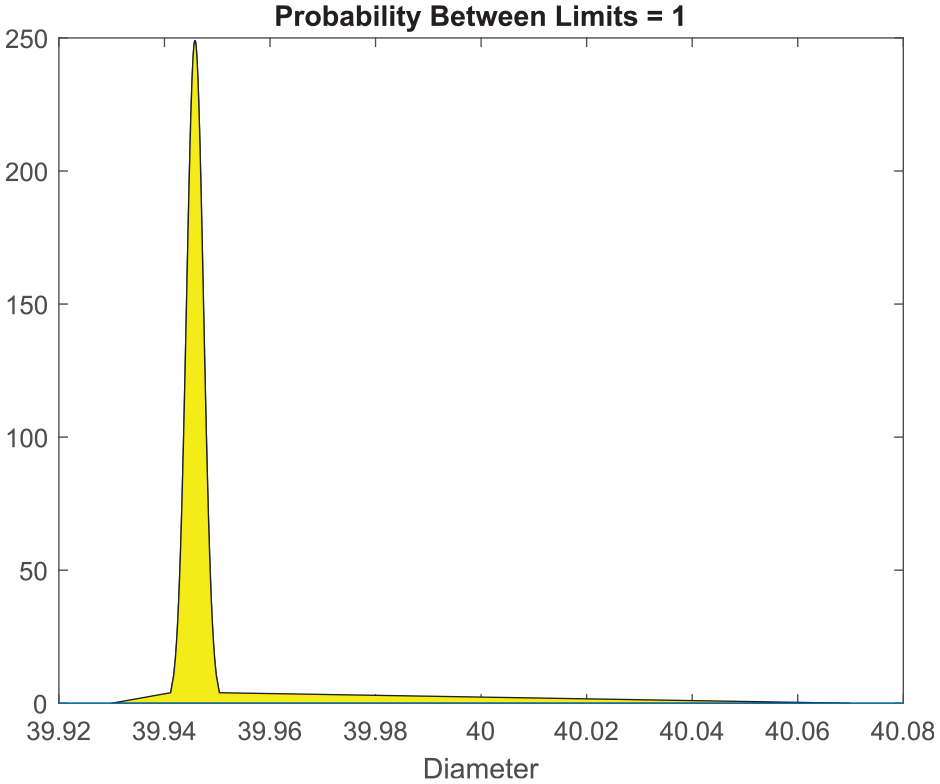
Probability of conformance for Part 24 based on probabilistic machine learning.
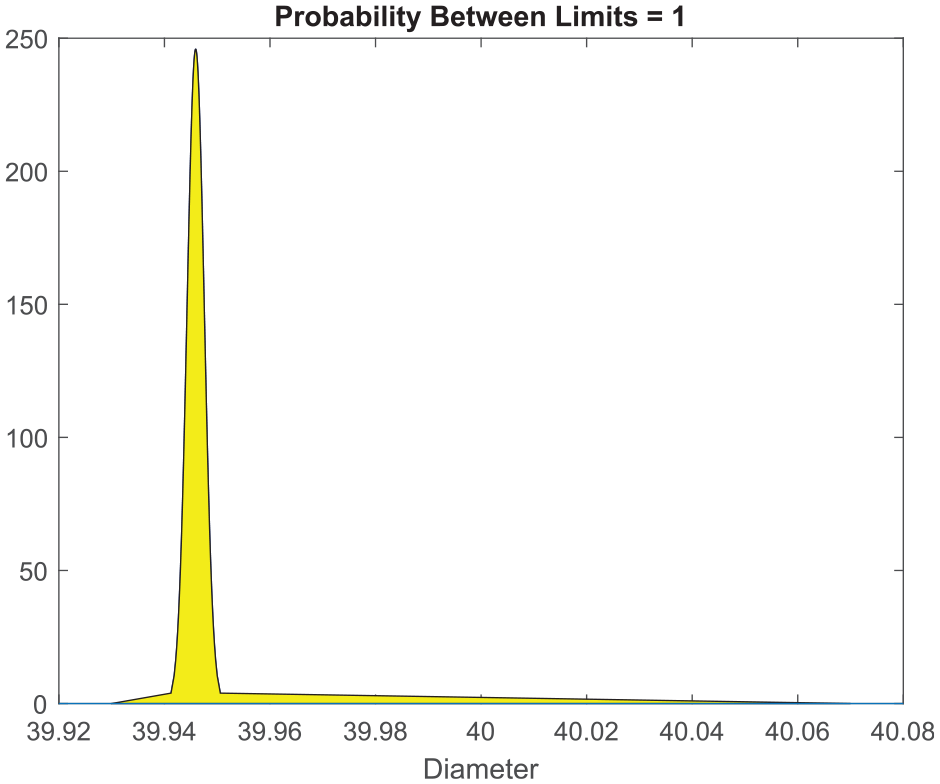
Probability of conformance for Part 24 based on Bayesian information fusion.
The risks of incorrect accept/reject decisions can be reduced by adopting the concept of inspection by exception method
7
according to which the value of conformance and non-conformance probabilities based on the prediction results can illustrate the need for post-process inspection. For example, the part being manufactured can either be accepted or rejected if the conformance and non-conformance probabilities, respectively, are high. However, if they fall below a user-specified limit, then, the part will need to be measured by an accurate CMS in order to evaluate its conformance or non-conformance to tolerance specifications. Nevertheless, accepting or rejecting a part may lead to an incorrect accept/reject decision, given prediction results close to tolerance specifications. To balance such risks, a compressed version of the tolerance interval
Conclusions
As manufacturers strive to satisfy customers’ requirements, there is a drive towards intelligent manufacturing processes that produce ever more accurate parts while giving a reduction in manufacturing times, costs incurred by re-working or scrapping out-of-specification parts, and human intervention. Most previous research studies have not investigated the use of machine learning in multistage manufacturing for dimensional product health monitoring, inclusion of additional measurements, and prediction of conformance and non-conformance measures in an integrated manner. The main aim of this research was to develop and validate a probabilistic framework for manufacturing process monitoring and control using machine learning and live captured sensor data from different manufacturing stages. The Multistage Manufacturing Process (MMP) presented in this research work involved various manufacturing stages of heat treatment of the material, machining, On-Machine Probing (OMP), and shop-floor post-process inspection. The in-process monitoring processes from which the data were derived included the tempering temperature, material surface hardness, force, and tool vibration. The product health metric deviations based on post-process inspection were used as output data. The paper has proposed using unsupervised neural networks and Gaussian processes to assess the dimensional product condition and Bayesian updating for exploiting subsequent measurements, such as OMP data, and pooling information. The prediction results compared well with the experimental measurement results obtained by a comparator measurement system. Adopting the concept of inspection by exception method allows the reduction of the volume of non-added value processes including dimensional inspections during manufacturing while also reducing the risks of incorrect decisions. The paper has also advised to consider a user-specified acceptance interval, such as an uncertainty interval, in order to balance the risks of incorrect accept/reject decisions for predictions close to tolerance specifications. Future work will look to incorporate this technology into a manufacturing system. In addition, investigation of this approach to the process quality monitoring in additive manufacturing will be explored.
Footnotes
Appendix
Declaration of conflicting interests
The author(s) declared no potential conflicts of interest with respect to the research, authorship, and/or publication of this article.
Funding
The author(s) disclosed receipt of the following financial support for the research, authorship, and/or publication of this article: This research was funded by the UK Engineering and Physical Sciences Research Council (EPSRC) under the Grant Reference EP/P006930/1.