
Abstract
This study investigates the impact of squeegee blade (natural rubber and polyurethane) and squeegee pressure on printing density in traditional textile screen printing. The research employed a 2 × 2 factorial design with two pressure levels (high and low) for each squeegee blade. Strain gauges and pressure sensors were installed to measure variations in printing density during the screen printing process. Results from statistical t-tests and two-way analysis of variance (ANOVA) reveal that the key factor affecting printing density is the squeegee blade, followed by squeegee pressure and the interaction between blade and pressure, under statistical significance (95% confidence level). Furthermore, the impact of blade on printing density varies depending on the pressure, with natural rubber squeegee blade achieving higher density values compared to polyurethane squeegee blade under both high- and low-pressure conditions. Under the same conditions, natural rubber squeegee blade exhibit smoother fluctuation in printing density, lower variation, higher tensile strength, and better printability than polyurethane squeegee blade. These findings provide empirical evidence for selecting appropriate squeegee blade and pressure settings in textile screen printing applications, potentially improving print quality and consistency across various printing scenarios.
Introduction
Screen printing is a widely used technique that utilizes a squeegee to force ink through a stencil onto the substrate. This method is frequently employed for large-scale printing due to its compatibility with diverse ink formulations, dyestuffs and materials, as well as its cost-effective compared to other printing methods. 1 A 2023 comprehensive review identifies squeegee-material interactions as the most influential yet under-researched parameter in industrial screen printing workflows. 2 In 2023, digital textile printing accounted for approximately 17.9% of global textile printing production, while traditional textile screen printing made up the remaining 82.1%, 3 highlighting its continued dominance in the industry.
The traditional process of textile screen printing is influenced by numerous factors affecting printing quality, including the pre- and post-treatment of the fabric, the precision of screen production, the control of the printing machine during fabric printing, and environmental impact. Based on empirical experience, the key factors that significantly affect the printing effect are the selection of squeegee blade and the control of the squeegee on the production line. 4 Squeegees are often made of rubber, which can be classified as natural rubber, synthetic rubber (neoprene) or polyurethane. The rubber is the main material of the squeegee blade, and its characteristics will affect the quality of the final print. 5
Natural rubber, mainly extracted from the sap of rubber trees, is conventionally considered to have better printability due to its elasticity and ability to control ink penetration and uniformity. 6 However, due to their material characteristics, natural rubber squeegee blades might quickly lead to elasticity fatigue and need frequent replacement. In contrast, polyurethane squeegees, made from isocyanates and polyols, are also popular in screen printing productiion. 7 While polyurethane squeegees have poorer elasticity and weaker control ability than natural rubber squeegees, they offer slower elastic fatigue, allowing for long-term printing and high abrasion resistance, as well as good physical and chemical resistance and anti-wear properties. 8 Recent research highlights that polyurethane’s superior chemical stability make it an ideal material for high-pressure and long-duration textile applications. 9
Regarding the cost factor, natural rubber squeegees typically offer a lower initial investment, but may require more frequent replacements due to faster wear, potentially increasing long-term costs. Conversely, polyurethane squeegees generally have a higher upfront cost but offer longer service life. The choice of squeegee blade significantly impacts ink consumption, print quality, and production speed, all of which have direct cost implications for manufacturers. Recent studies have shown that while natural rubber squeegees may be more cost-effective for short production runs, polyurethane squeegees can provide better long-term value for high-volume printing operations. 10 Additionally, advancements in elastomer formulations have improved polyurethane’s cost-performance ratio in automated textile printing systems. 11
The squeegee plays a crucial role in screen printing by evenly applying pressure to push the printing ink through the screen, improving ink uniformity. The squeegee’s installation height controls its vertical movement and the distance between its tip and the printing board surface, significantly influencing ink flow dynamics during the printing process. 12 The lower squeegee position (closer to the substrate) causes higher pressure from the squeegee tip on the substrate. This pressure influences the paste flow speed under the squeegee, the amount of rubber deformation, and the squeegee’s movement speed. 13
Despite the squeegee is critical important in textile screen printing, limited research has addressed the impact of squeegee blade and pressure on the process, particularly for textile applications. 14 This study aims fill the gap by investigating the impact of squeegee blade and pressure on printing density in textile screen printing, focusing on natural rubber and polyurethane squeegee blades. In printing factories, these two materials are the most widely used, but the differences in their printing performance have largely been based on operators’ experience, without clear, empirical evidence to guide decision-making.
To provide a comprehensive understanding, this research employs statistical analysis and advanced measurement techniques. Strain gauges and pressure sensors were installed to capture real-time data during the printing process, offering valuable insights into squeegee deformation and pressure distribution. This approach allows for accurate monitoring and analysis of pressure and strain changes throughout the process, providing a deeper understanding of factors affecting printing density.
The squeegee installation height is especially crucial in mass production, as even a 1 mm difference can significantly alter printing effects. This study investigates the differences in printing density between natural rubber and polyurethane squeegee blades, as well as the impact of varying squeegee installation heights. The research aims to provide an empirical basis for selecting appropriate squeegee blade and to investigate the characteristics of the squeegees during printing.
The rest of the paper is organized as follows: Section 2 details the experimental procedure, Section 3 presents the experimental results, Section 4 provides the statistical analysis, and Section 5 concludes the study and proposes future work.
Experimental procedure
In order to study the impact of squeegee height and blades on screen printing, a series of experiments were designed. The experiments were conducted on a small-scale printing machine with dimensions of 60 cm in length and 40 cm in width. New, straight-edge squeegee blades made of 7 mm thick natural rubber and polyurethane, both with Shore Hardness Scales of 60 degrees (rubber with a durometer of 60HA), were used. The squeegees of the 60HA Shore Hardness Scale are the most commonly used in textile printing factories.
The screen printing machine used in this study is model HJ-55AC, manufactured by Houn Jien Co., Ltd. The aluminum screen printing frames and screens were produced by Li Meal Printing Platemaking Corporation. The fabric used for printing was supplied by Formosa Taffeta Co., Ltd. Both the squeegee blades and pigment ink were provided by Shine More Enterprise Corporation. All of these companies are local companies based in Taiwan. For the measurement equipment, the strain gauges used were KFGS-5-120-C1 models from Kyowa, a Japanese company. The pressure sensors were also from Kyowa, specifically the PS-KC model.
To record the stability and deformation of the rubber during squeegee action, strain gauges were installed 2 mm from the edge of the squeegee contact surface. These gauges were attached to the left (L), center (C) and right (R) of the squeegee. Pressure sensors were installed on the printing table, positioned at the center of the short edge (P1), the corner (P2) and at the center of the long edge (P3), as shown in Figure 1. Screen printing machine, and the positions of mounted squeegee, strain gauge and pressure sensor.
Measuring pressure at different points (P1, P2, and P3) on the printing table is significant for several reasons: 1. Pressure distribution: By measuring pressure at multiple points, we can understand how pressure is distributed across the printing surface. This is crucial because uneven pressure distribution can lead to inconsistencies in print quality. 2. Identifying pressure variations: The measurements at P1 (center of the short edge), P2 (corner), and P3 (center of the long edge) allow us to detect variations in pressure across different areas of the printing table. This information is valuable for optimizing the printing process. 3. Ensuring printing consistency: By monitoring pressure at these key points, operators can adjust the squeegee pressure and angle to maintain consistent pressure across the entire printing area. This helps achieve uniform ink deposition and print quality. 4. Process optimization: Understanding pressure distribution allows for fine-tuning of the printing process, potentially leading to improved print quality, reduced waste, and increased efficiency.
Ink density is the measurement of a solid printed patch on the substrate, generally relating to ink film thickness. 15 In the printing process, density is an important indicator for controlling print quality. Ink density affects the final visual quality, color gamut and color fidelity. 16 The correct ink density can also ensure ideal color reproduction and accuracy. 17
In this study, two different squeegee heights, differing by 1 mm, were tested. The 1 mm height difference in the squeegee setup was chosen based on practical considerations from actual production line experiences, where even slight deviations can significantly affect print quality. This choice reflects the observed sensitivity to height adjustments as small as 0.5 mm in industrial settings, while providing a clear and measurable distinction between the two height settings for more definitive conclusions about the impact of squeegee height on printing density.
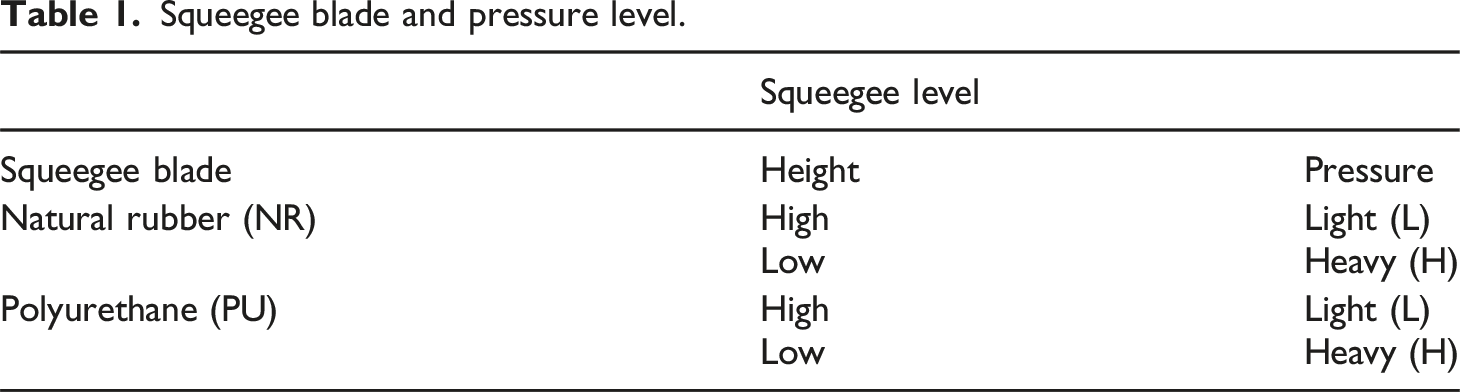
Before starting the experiment, a test chart (Figure 2) with tone values ranging from 1% to 100% in four directions was printed. Since fabrics have varying weaves and are rougher compared to paper, four-directional approach ensures more reliable data by better reflecting the uniformity of ink distribution across different areas of the print. According to the industry’s visual evaluation standard, if more than 60% of the tone values can be clearly distinguished by visual inspection, this printing setting can be established as the standard for the low squeegee height set as 1 mm. The low squeegee height with heavier pressure is denoted as H, while the high squeegee height with lighter pressure set as 2 mm is denoted as L (Table 1). Test chart with tone values ranging from 1% to 100% in four directions. Squeegee blade and pressure level.
It should be noted that at the initial stage of movement, the squeegee is perpendicular to the substrate. As it moves, the angle between the squeegee and the substrate gradually decreases.
Prior to experimentation, it was verified that the squeegee was not worn, aged, or broken, as these conditions can affect the screen printing process. Worn squeegees disrupt ink distribution and deformation due to uneven edges and material fatigue. Aged squeegees experience chemical, elastic, and surface degradation, while broken squeegees lead to irregular pressure, contact angles, and ink deposition. For consistency, the squeegee was thoroughly inspected and leveled. 18
The printed fabric was adhered to roll paper at 120 cm intervals and was pulled forward after printing. Each printing condition was printed nine times. During the machine’s cold start, the screen was dry. Therefore, the result of the first print (cold start) was not used, and data from the second to the ninth prints were recorded. The experiment was conducted using pigment ink. The experiment employed textile-grade pigment ink with a viscosity of 8000 ± 250 mPa·s. This aqueous formulation contains 20% carbon black pigment dispersed in an acrylic-polyurethane hybrid binder system (about 40% solids content) and approximately 5% sodium alginate as a thickener.
After the printed fabric was dried, an X-Rite® Ci64 Handheld Spectrophotometer from the U.S.-based company was used to measure L*a*b* values of 100 patches in four directions on the test chart under D65 illumination at a 10-degree viewing angle. The measured L∗a∗b∗ values were converted to density values using PatchTool software. For each patch, the average density value was recorded. In this study, NR-H stands for natural rubber squeegee with high pressure (H), NR-L stands for natural rubber squeegee with low pressure (L), PU-H stands for polyurethane squeegee with high pressure (H) and PU-L stands for polyurethane squeegee with low pressure (L).
The test fabric selected for printing was 100% cotton 133 × 72 / 40 × 40 twill weave fabric, which is one of the most widely used materials and specifications for home textiles in East Asian countries. Aluminum screen printing frames with a 150 threads/inch nylon mesh were used, with a mesh tension of 8 N/cm. The environmental conditions during experiment were a room temperature of 22°C and a humidity level of 55%. After printing, the fabric samples were hung indoors to air dry naturally.
Experimental results
Figure 3 shows the density values of the four sets of experiments: NR-H, NR-L, PU-H and PU-L (indicated in Table 1). The X-axis represents the desired density level (%) and the Y-axis represents the measured density. Printing density (D) quantifies the optical density of printed ink layers, defined as: Measured density values, average value (red line) and target value (black line) of the four experimental units. NR-H/NR-L have higher density fluctuations but closer alignment with target values. PU-H/PU-L have Smaller deviations but under-deposition.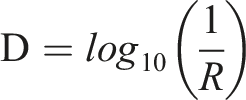

As can been seen in Figure 3, the results show that the density values of the four sets of experiments increase gradually but with different patterns. It appears that the density values for the natural rubber squeegee (NR-H and NR-L) exhibit larger fluctuations but are closer to the target density value. In contrast, the density values for the polyurethane squeegee (PU-H and PU-L) have smaller fluctuations but are mostly insufficient and far from the target value. Additionally, it can be observed from the four figures that when the density value is in the middle section, the degree of fluctuation begins to increase, unlike the front to middle sections of the curve, which remain relatively stable. For example, after 55%, NR-H has a variation of 0.0097, while NR-L, PU-H, and PU-L have variations of 0.00997, 0.03928 and 0.04534, respectively.
Particularly for the natural rubber squeegee, when the pressure is high, the degree of fluctuation is much greater than when the pressure is low, but it generally stays on the target value curve. However, the difference between high and low pressures when using polyurethane squeegees is not as pronounced as with the natural rubber squeegee. In fact, under the same pressure, the natural rubber squeegee provides better ink penetration and ink output, while the polyurethane squeegee has lower ink output. This indicates that the choice of squeegee blade and pressure setting by the factory before printing will affect the ink output density.
Top of Figure 4 illustrates the printing cycle of the squeegee: (1) the squeegee descends from the initial position to contact the printing table, (2) moves forward to print, (3) rises, and (4) returns to the initial position. Increasing the squeegee pressure will cause the squeegee angle to decrease (the initial squeegee angle is perpendicular to the printing board surface). The higher the squeegee pressure, the smaller the angle, resulting in more ink accumulation.
20
Schematic diagram of the squeegee printing cycle and the measured data from the strain gauge and pressure sensor on NR-H.
The middle diagram of Figure 4 shows the average deformation levels collected from the three signal points of the strain gauge on the left (L), center (M), and right (R) on the squeegee. The X-axis indicates response time (milliseconds) when the squeegee was moving, and the Y-axis represents the deformation ratio of the strain gauge. A higher ratio means the squeegee surface has larger deformation caused by the applied force, leading to more ink penetration through the screen.
P1, P2, and P3 represent the installation positions of the pressure sensors. Since the pressure sensors are raised above the surface of the printing table, the data from the strain gauge and pressure sensors show a peak value. From the figure, it can be seen that the pressure at the central position of the squeegee (P1) is much higher than at the edges.
Figure 5 shows the measured data from the strain gauge and pressure sensors on PU-H. As can be seen, during one cycle of movement, the polyurethane squeegee undergoes larger deformation. The Left (L) and Right (R) positions exhibit similar fluctuation patterns, but with significant differences in amplitude. However, the deformation levels at the center (C) present an interesting finding. The center deformation under NR-H is similar to that at the edges. It appears that the center of the natural rubber squeegee is relatively easier to deform, but this is not the case for the polyurethane squeegee, whose strain amplitude at the center (C) is comparatively lower. The diagram shows the measured data from the strain gauge and pressure sensors on PU-H.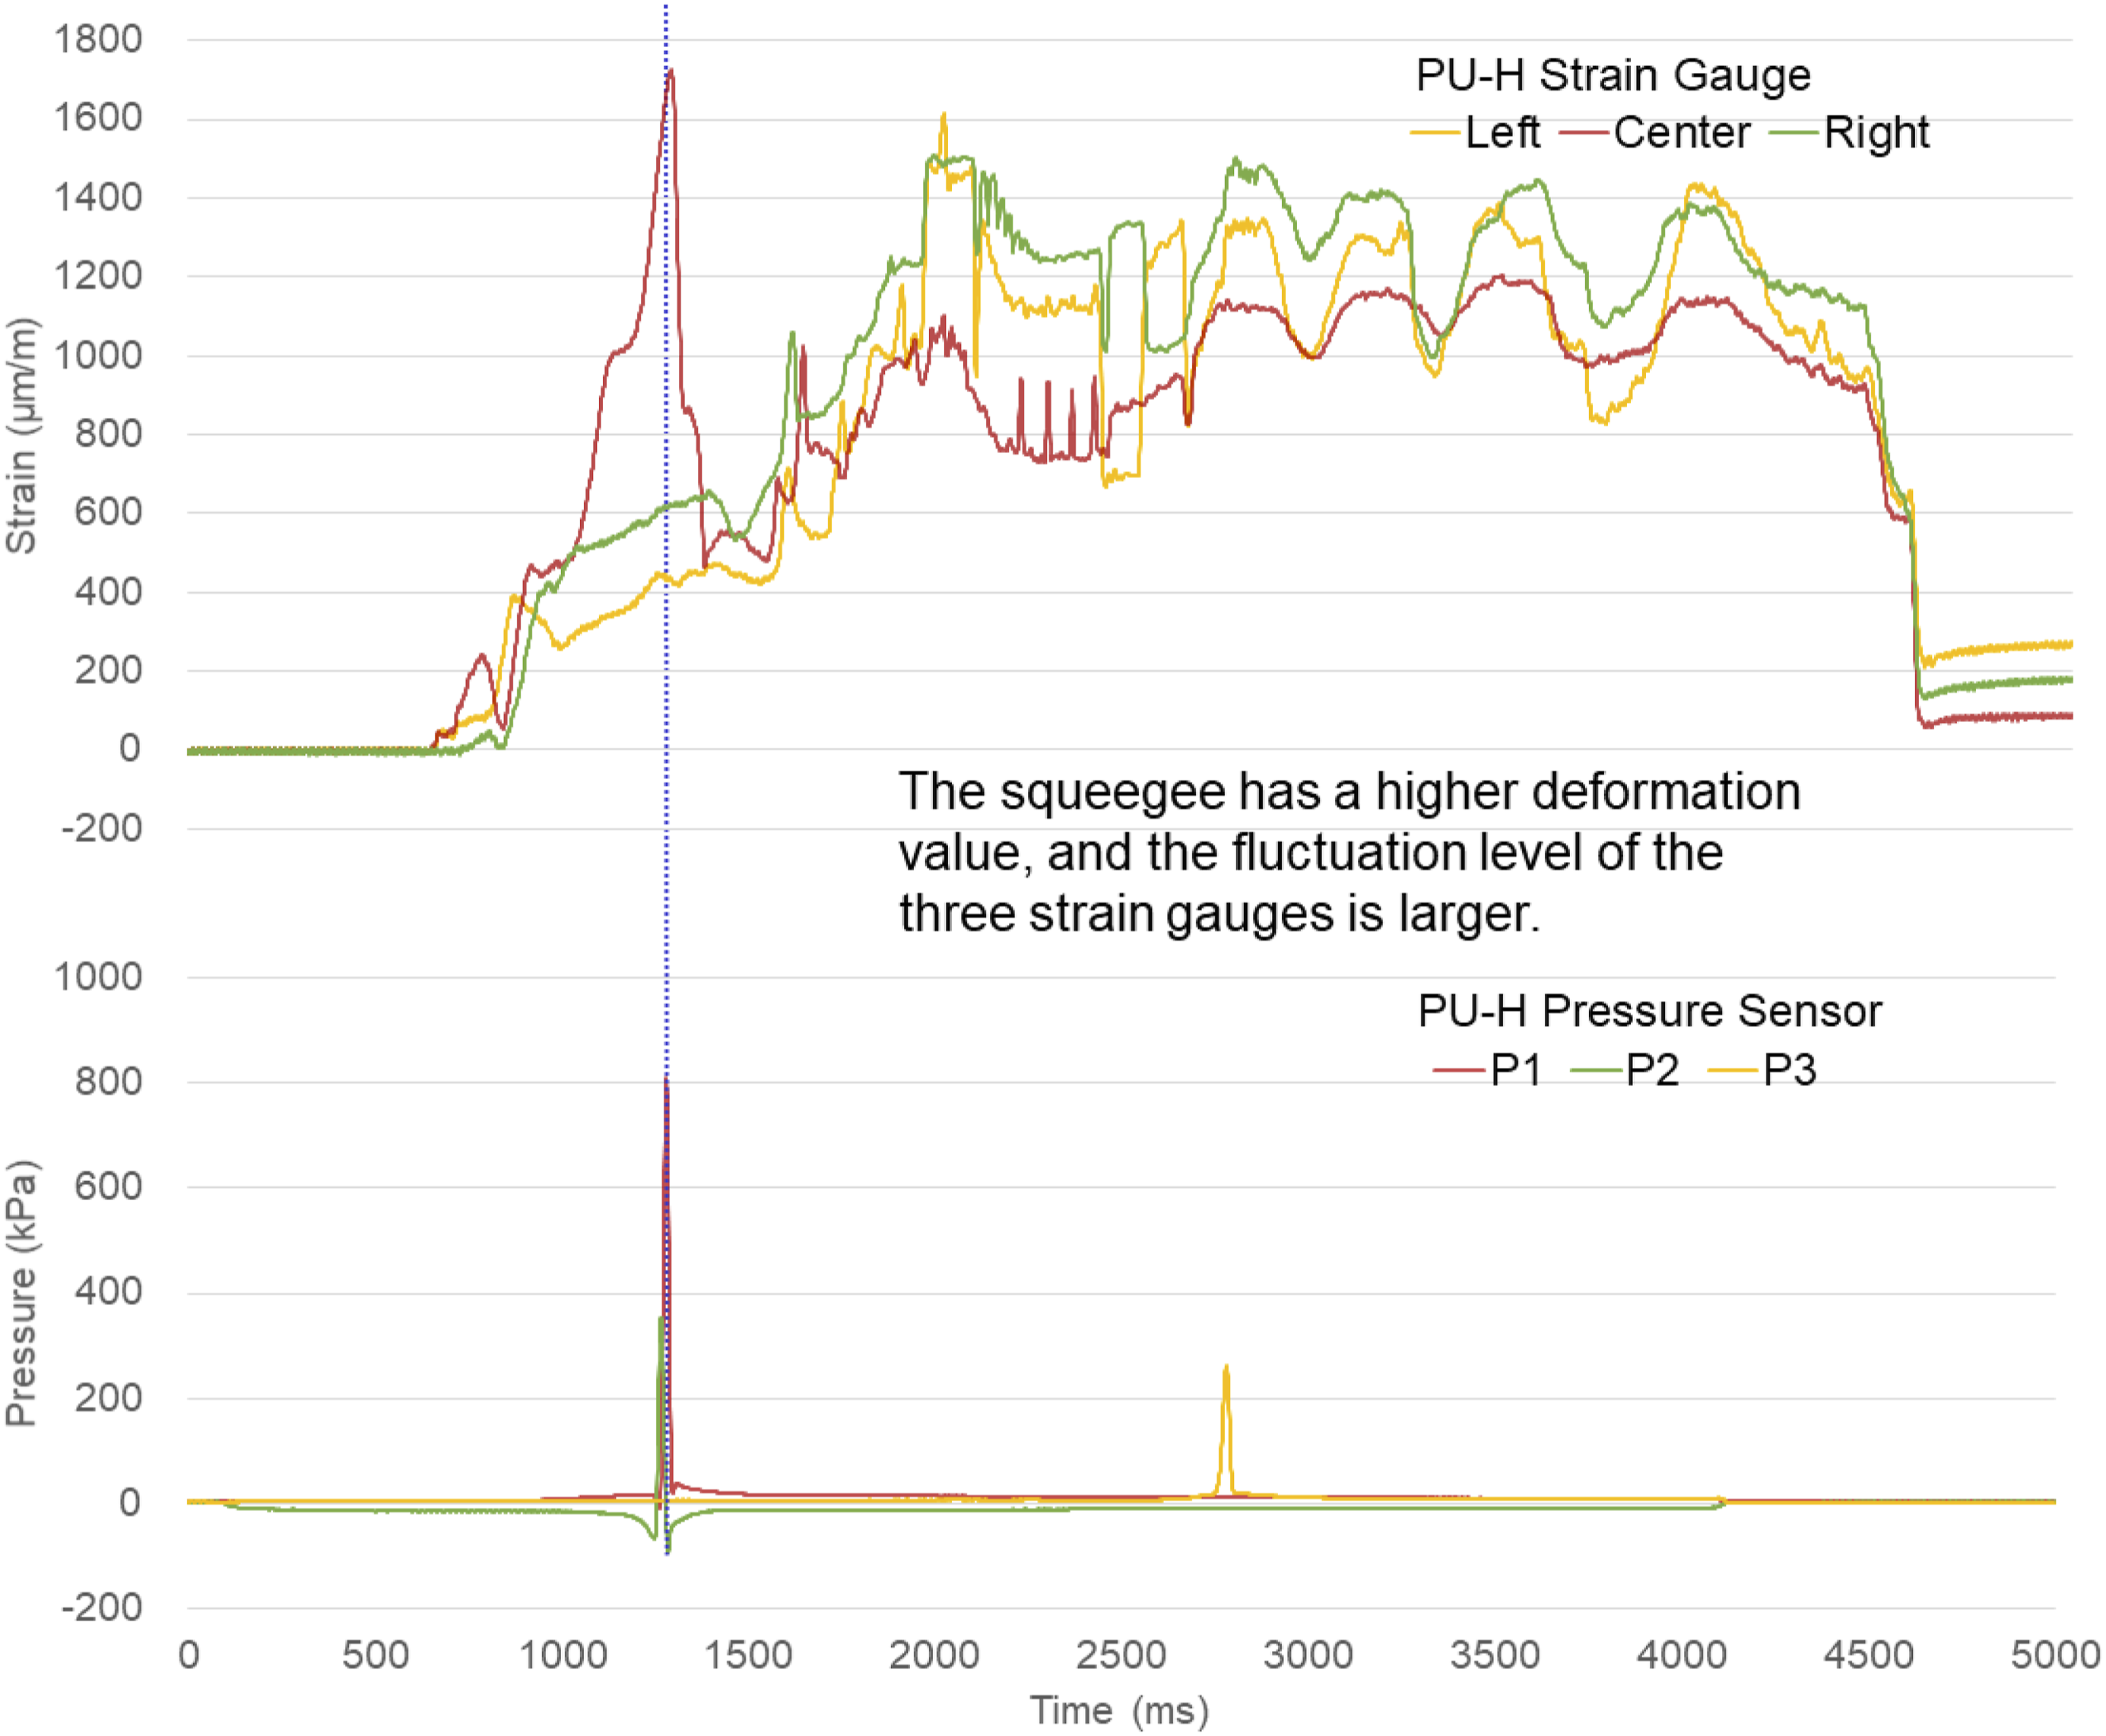
From the deformation curves of the strain gauge, it can be seen that the printing process is not smooth and stable, but fluctuates up and down. It is obvious that the natural rubber squeegee exhibits higher stability. The deformation value of the polyurethane squeegee is significantly higher than that of the natural rubber squeegee. The tail section of the curve for the natural rubber squeegee is closer to the original point, while the polyurethane squeegee is farther from the original point, indicating that the deformation degree and displacement time during the printing process are longer. This indicates that the natural rubber squeegee has a lower strain value over time.
According to previous literature, strain rate and stress gradually increase with increasing pressure, and the strain rate of different materials also varies. 11 At low strain rate (static), polyurethane has a larger elongation than natural rubber, 21 but at high strain rate (dynamic), natural rubber has a higher tensile strength. 22 It can be concluded from the analysis results that the natural rubber squeegee has a lower fluctuation range and variation range in density and dynamic strain value compared to the polyurethane squeegee. This finding aligns with the experience of factory operators that the natural rubber squeegee has better printability.
Statistical analysis
Based on the aforementioned experimental results, statistical verification was performed. This study investigated the effects of rubber blade (natural rubber and polyurethane squeegee blade) and squeegee pressure (high and low, with a height difference of 1 mm) on printing density using the Student's t-test and a 2 to the 2nd factorial design. This statistical approach evaluates two key factors (material type and pressure) and their combined effects. The t-test compares average density differences between material pairs, while the factorial design quantifies how these factors interact. Before performing the analysis of variance, the experimental data were checked to ensure they met the assumptions of statistics analysis, including normality (data following a normal distribution), homogeneity (observations having the same variance), and independence (each observation being independent). 23
First of all, the distribution of the data was observed using Skewness and Kurtosis. The results showed that Skewness was 0.160 and Kurtosis was 2.211, indicating a slight positive skew. Skewness measures data symmetry (0 means perfect symmetry), while kurtosis reflects the likelihood of outlier (3 represents a normal distribution). These values suggest a mild right-skewed distribution, which was addressed using a square root transformation. Therefore, the square root transformation was applied to the dependent variable. 24 The square root transformation was chosen over other methods, such as logarithmic or inverse transformations, because it is particularly effective for moderately skewed positive data. This transformation tends to pull in high values more than low values, which helps to address the positive skew observed in our data. Additionally, the square root transformation is often preferred when dealing with count or measurement data, as it preserves the relative spacing of data points better than more extreme transformations.
The residuals of the transformed data approximated a normal distribution. Figure 6 shows the Quantile-Quantile Plot (QQ Plot) of 6(a) before and 6(b) after the transformation. The homogeneous of variances was checked using Levene’s test, and the p-value was greater than 0.05, leading to the acceptance of the null hypothesis. This confirmed that the variances of the mean values of the printed density of the groups were equal, indicating that the data were homogeneous. This confirms equal variability across experimental groups, ensuring valid comparisons between material-pressure combinations. Quantiles of normal distribution of density residuals from (a) without and (b) with square root transformation.
Finally, the Durbin-Watson test statistic conventionally is used to test for the independence of residuals, which is a key assumption in regression and ANOVA analyses. A value of 0.156, as observed in this study, indicates that the residuals are independent and not autocorrelated. This independence ensures that the statistical results, such as the significance of factors like squeegee blade and pressure on printing density, are valid and reliable. 25
Experiments with four combinations (high and low pressures with NR and PU blades) were conducted in this study. Each experiment was repeated eight times, and the average value was taken. The error value was calculated to observe the degree of dispersion of the four experimental units. After the data were confirmed, statistical analysis was performed using IBM SPSS 25 and Stata 17 software. An independent sample T-test was used to compare the mean differences, and the two-factor variance analysis was used to determine whether the two factors had an impact on the density. The 0.05 significance level was used as the judgment standard.
According to the 2^2 experimental design, there are two experimental factors and two levels. Each experiment was repeated eight times, and the average of the sum of squared deviations from the mean and the square root were taken to obtain each experimental data. Figure 7 shows the data dispersion of the four experimental units. The results show that the median of the error value of the four experimental units is close to 0.01-0.03, indicating that the error approaches 0 after eight repetitions of the experiment. This implies that the data trend after eight repetitions is nearly the same and stable. The box-plot of RMSE against the average.
The significance of observing the error value dispersion in Figure 7 lies in its ability to assess the consistency and reliability of the experimental results. The close proximity of error values to 0.01–0.03 after eight repetitions indicates that the data trends are stable and nearly identical across repeated trials. This stability suggests that the experimental setup, including squeegee blade, pressure levels, and measurement techniques, provides reproducible results with minimal variability.
Such low error dispersion enhances the reliability of the experiment by demonstrating that the observed differences in printing density are primarily due to the experimental factors (squeegee blade and pressure) rather than random noise or inconsistencies in the process. This consistency is critical for validating the conclusions drawn from the study, particularly regarding the effects of squeegee blade and pressure on printing density. It also underscores the robustness of the experimental design and data collection methods, ensuring that the findings can be confidently applied to similar screen printing scenarios.
In addition, according to the research of the compensation method of density,
26
the difference between the measured density value and the target value is observed through the dispersion of the data between the target value and the average value. Figure 8 shows that the median of the target value of the four experimental units of the natural rubber squeegee error value is close to 0.5–0.7, while the median of the polyurethane squeegee error value is 1.5, suggesting that the higher error value of the polyurethane squeegee has a greater variability. It is presumed that this is related to the squeegee blade itself, as the molecular structure of the surface of the squeegee blade affects the adhesion between the ink and the printing substrate, which in turn affects the fluidity of the ink.
27
The box-plot of RMSE against the target.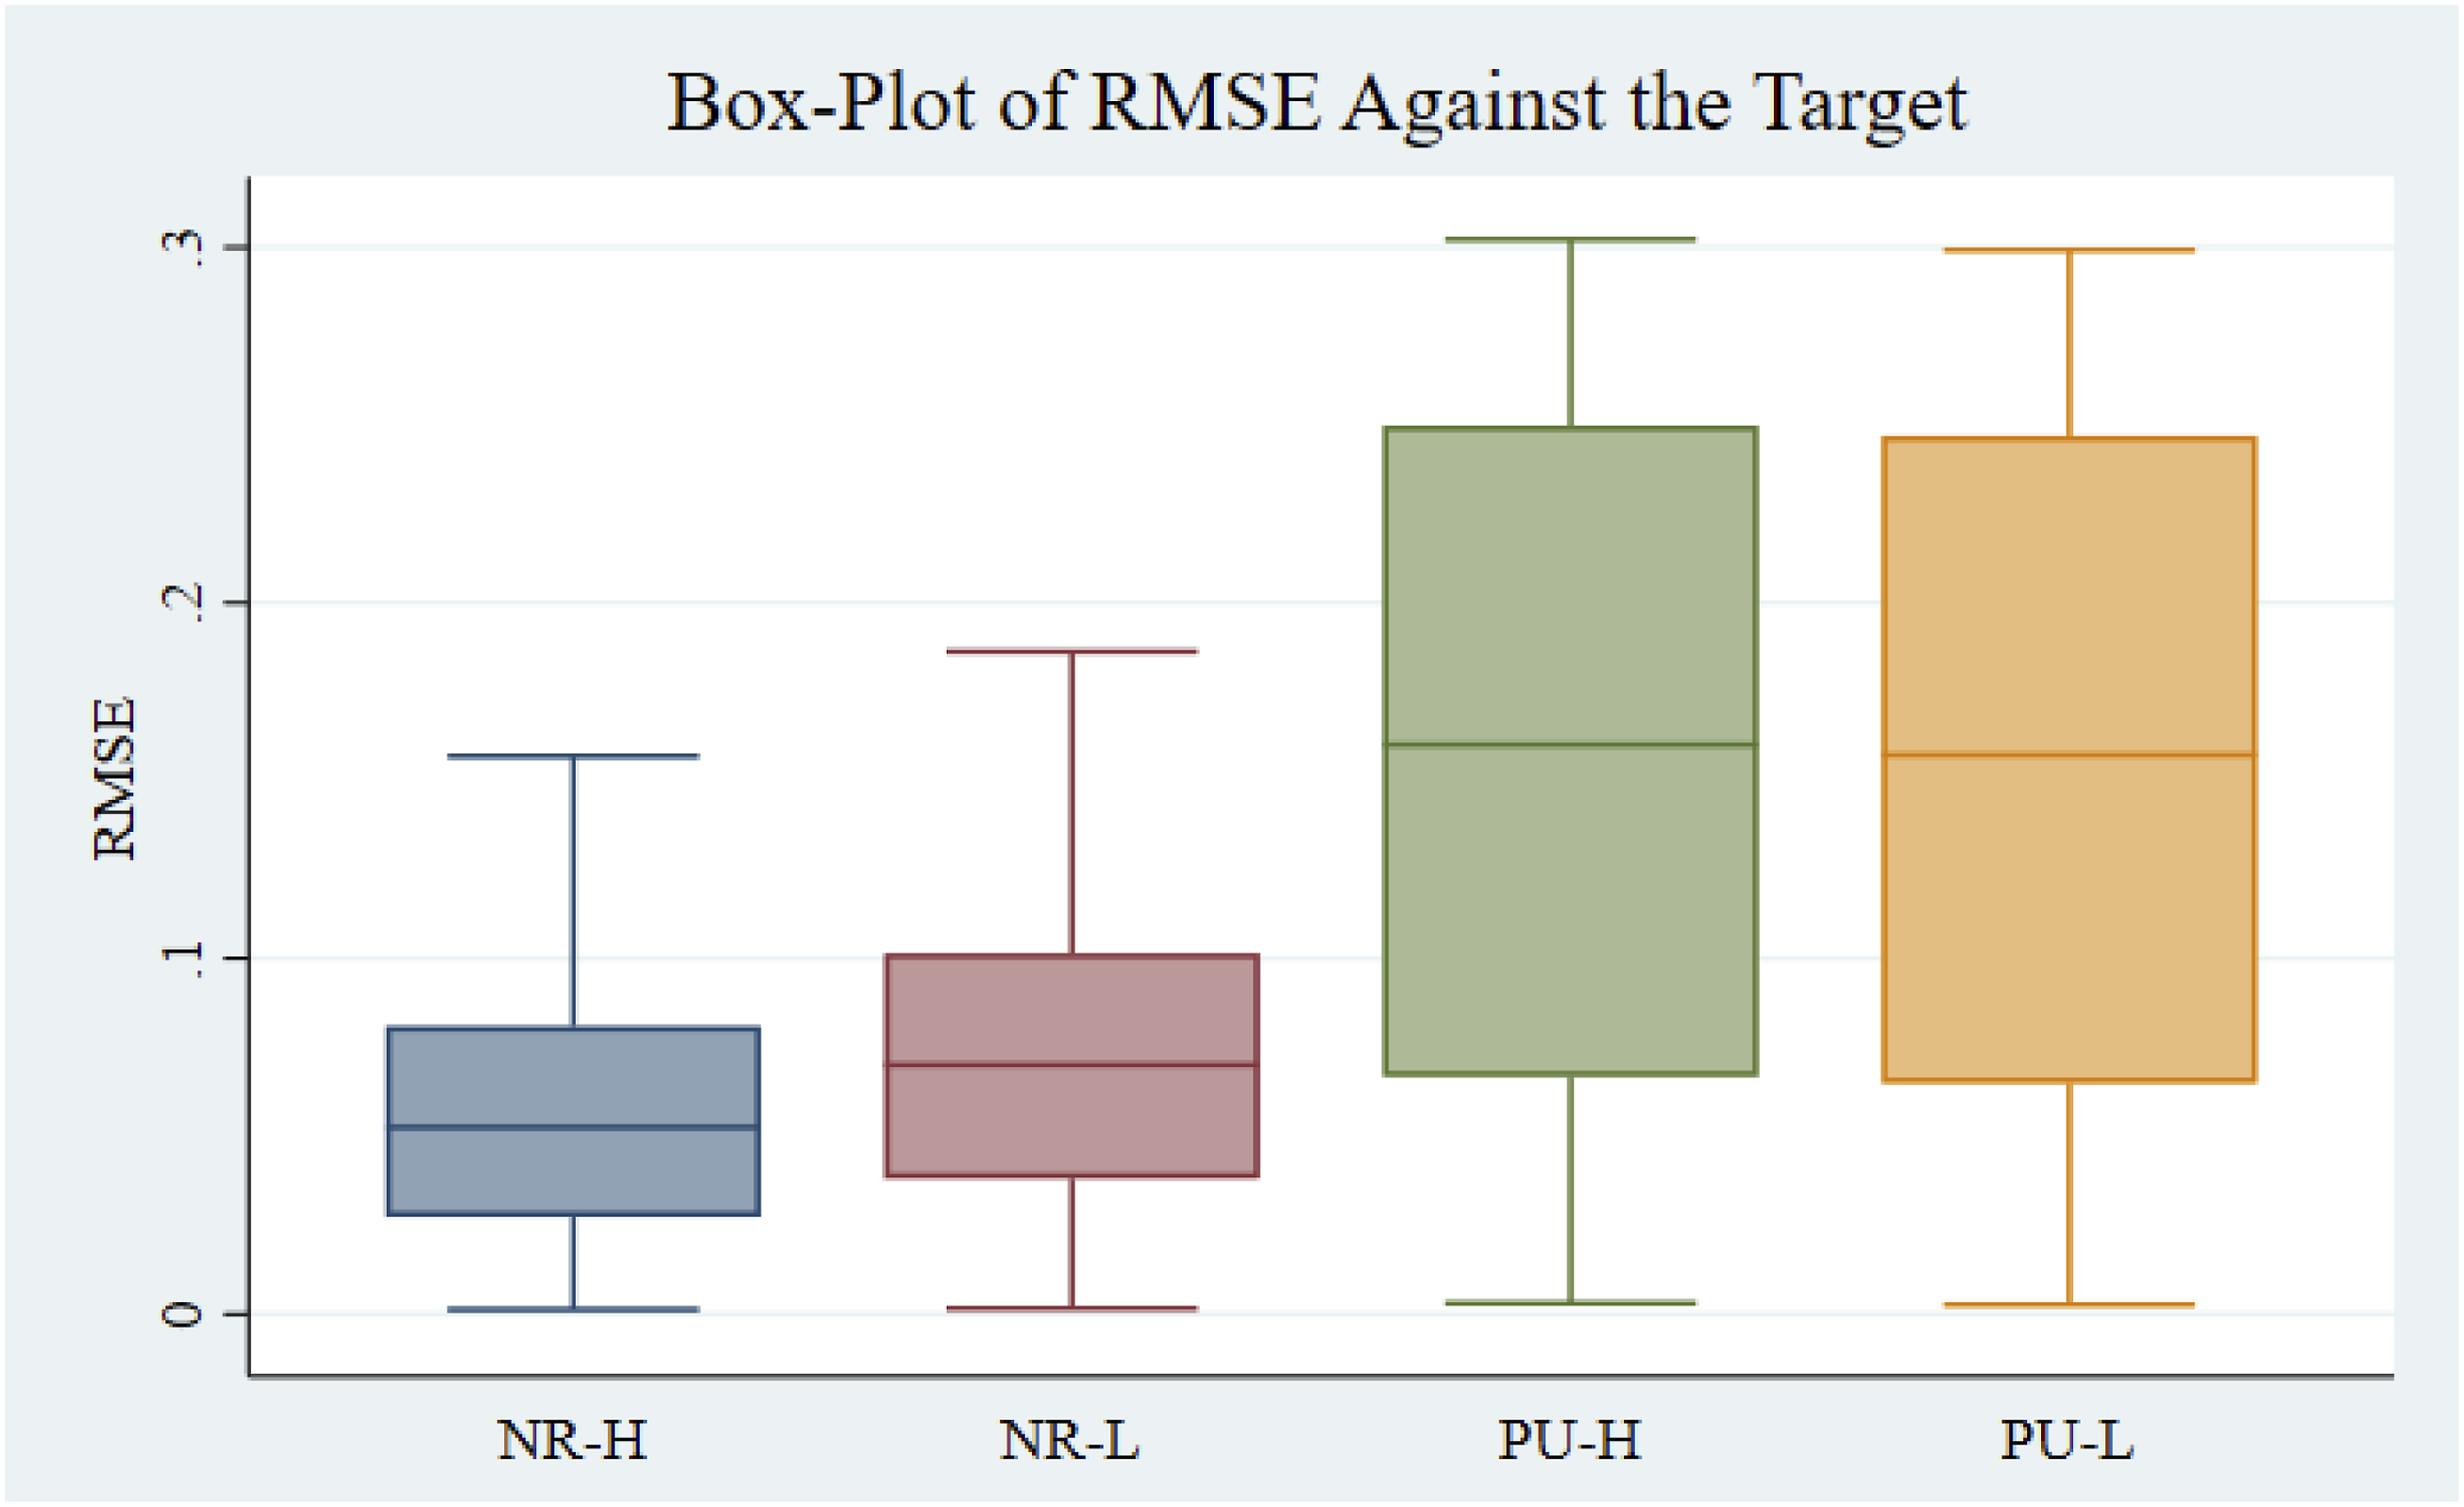
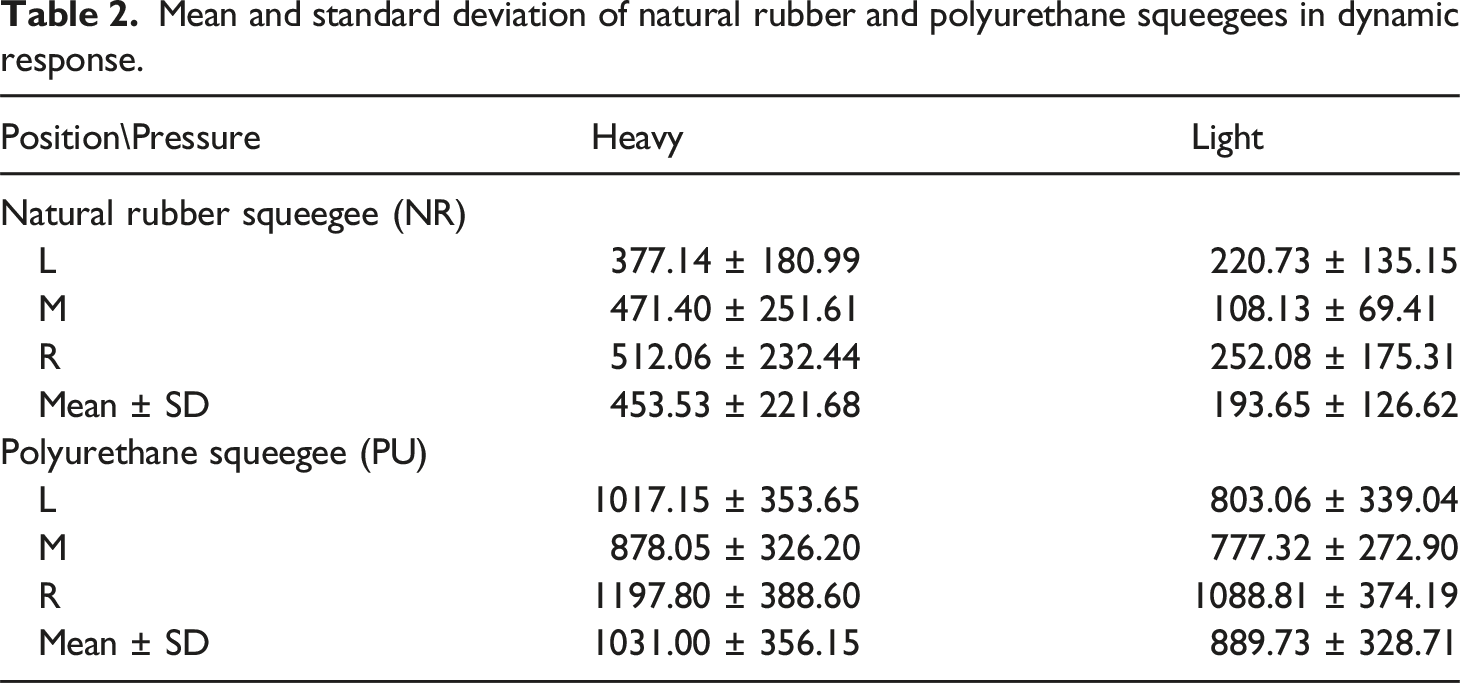
Mean and standard deviation of natural rubber and polyurethane squeegees in dynamic response.
T-tests of squeegee blade and pressure against printing density.
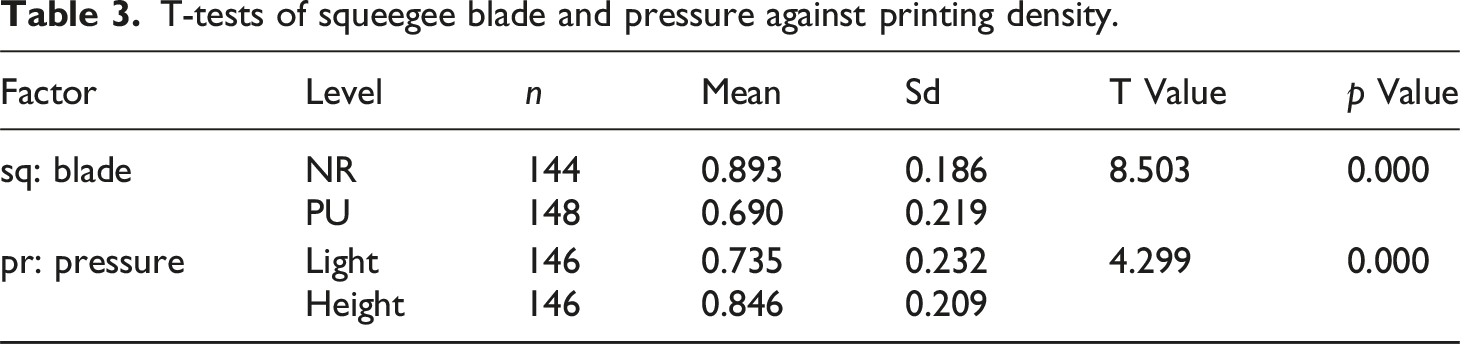
The statistical results show that the average density of natural rubber is 0.893, while the average density of polyurethane is 0.690. The rubber blade shows a significant difference in printing density between natural rubber and polyurethane (p < .000). After the squeegee is pressed down and deformed, it will change the angle of the rubber. Under normal circumstances, the greater the pressure applied, the smaller the angle of the squeegee (i.e., the angle between the squeegee and the surface of the substrate to be printed). The decrease in the angle between the squeegee and the mesh screen surface will increase the flow pressure of the ink, and then squeeze more ink out of the holes in the mesh screen, and the density will also increase. 28 The applied squeegee pressure is linearly related to the degree of ink accumulation. 29 In the experimental results, it is shown that the average density is 0.846 when the squeegee pressure is high, and the average density is 0.735 when the squeegee pressure is low. The squeegee pressure has a significant effect on printing density (p < .000).
Two-way variability analysis of rubber blade and squeegee pressure on ink density.

R2 squared 0.2694 (Adj R2 0.2618), Dependent variable: Density
Summary of key statistical findings.
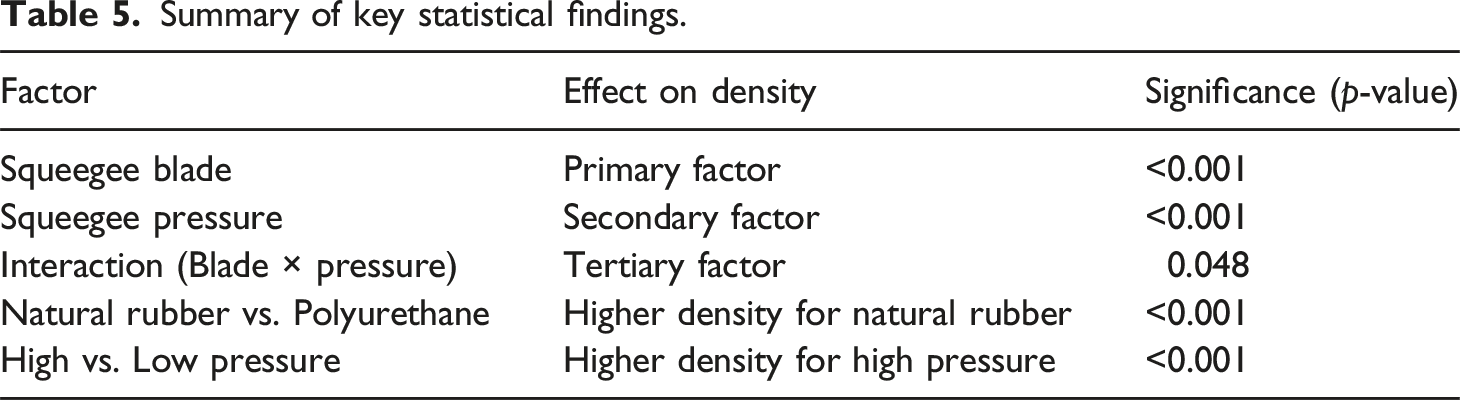
Table 5 shows both squeegee blade (p < .001) and pressure (p < .001) significantly affect density, with a notable interaction effect (p = .048). Natural rubber achieves higher density under high pressure, whereas polyurethane is less sensitive to pressure changes. The effect size indicates material has the greatest impact, followed by pressure and their interaction, emphasizing material selection as the key factor in print quality. These results align with industry findings on natural rubber’s superior ink transfer efficiency.
The main effects of squeegee blade and pressure on ink density.

Note: two-tailed test *p < .05, **p < .01, ***p < .001.
As mentioned above, the model contribution effect size is highest for rubber blade, followed by squeegee pressure, and then the interaction term between rubber blade and squeegee pressure. Based on these results, it can be inferred that the main reason is that the squeegee blade will affect the final printing density. First, natural rubber has flexibility, fatigue resistance, high elasticity, low sensitivity to strain effects in dynamic applications, and good creep resistance.30,31 Polyurethane, on the other hand, has high durability and excellent elastomer properties in the textile industry, with excellent wear resistance. 32 Due to the different properties of rubber itself, the amount of ink pressed out is also different, and the image reproduction will also be different.
The creep resistance of rubber blade refers to the ability of the squeegee to maintain its original shape after bending. When the squeegee is pressed down, it increases the flowability of the ink, which helps the ink pass through the mesh screen holes and enter the substrate. In the printing process, the anti-bending ability can bring a high wear angle and present a sharp edge at the interface between the squeegee and the mesh screen. There is a correlation between the anti-bending properties of the squeegee and the thickness of the ink. 33 The anti-bending ability of the squeegee will affect the printing quality of the ink accumulation process. Polyurethane is known for its excellent wear resistance and compressive strength, 34 which is higher than any other polymer material. 35
The greater the pressure applied in the printing process, the greater the flow pressure of the ink will be, and more ink will be squeezed out of the screen holes, and the density will also increase. 28 Therefore, when the pressure increases, the higher downforce is reflected in the higher ink density. In this case, the deformation caused by the deformation of the squeegee contact point will lead to a larger contact area, which increases the ink coverage. 27 The successful results of the screen printing process are attributed to the interaction of many process parameters.1,12,20,36–38 Although this does not necessarily mean that all variables in the printing process can be controlled, the correlation between each variable and density should be measured as much as possible within a reasonable range.
Conclusions and future works
The most critical aspects of the printing process are the reproducibility and consistency of the replication. Even if the printing process is complex and time-consuming, selecting the correct combination of squeegee blade and pressure is essential to ensure successful printing. This study designs a series of experiments by installing strain gauges and pressure sensors to measure variations in printing density during the screen printing process, thereby identifying the key factors affecting printing density.
The results of this study indicate that the primary factor affecting printing density is the squeegee blade, followed by the squeegee pressure and the interaction between rubber blade and squeegee pressure. The rubber blade will affect the change in ink density with the different squeegee pressures. Under different squeegee pressures, natural rubber squeegee blade will increase the density values more than the polyurethane squeegee blade. Additionally, with different rubber blades affecting density changes, higher squeegee pressure generally results in higher density values.
Ink density is one of the important indicators that affects printing quality. Under the same conditions, the natural rubber squeegee has a smoother variation in density and a larger ink output, while the polyurethane squeegee has a larger variation in density and a smaller ink output. In the dynamic strain graph, the natural rubber squeegee has a shorter deformation displacement time in the printing process, while the polyurethane squeegee has a longer displacement time. Compared with the polyurethane squeegee, the natural rubber squeegee has a smaller variation in density and dynamic strain graph, a lower variation range, and better printability.
The interaction between the substrate, squeegee blade, squeegee pressure, and ink density in the printing process will all affect the printing quality. It is necessary to precisely control the rubber blade and pressure for more extensive application. The empirical results of this study further reinforce the importance of rubber blade and squeegee pressure. This study only uses rubber blade and squeegee pressure as explanatory variables. It is suggested that future studies can add other measurement variables to further explore other factors that affect printing quality.
While this study focused on squeegee blade material and pressure as key variables affecting printing density, future research could explore additional factors that influence screen printing quality in textile applications. Areas for further investigation include: 1. The effects of pigment ink viscosity on different fabric types such as polyester and nylon under various printing conditions. 2. Long-term performance analysis of squeegee blade materials, including wear resistance and print quality consistency over extended production runs. 3. Integration of advanced sensing technologies and machine learning algorithms for real-time optimization of the screen printing process. 4. The interaction between squeegee blade materials and different fabric-dye systems, including cotton with reactive dyes, polyester with disperse dyes, and nylon with acid dyes. 5. The impact of print speed and pressure on different textile substrates to develop more precise guidelines for various fabric types.
These expanded research directions would contribute to a deeper understanding of the complex interplay of factors in textile screen printing, potentially leading to innovations in both materials and processes.
Footnotes
Declaration of conflicting interests
The author(s) declared no potential conflicts of interest with respect to the research, authorship, and/or publication of this article.
Funding
The author(s) disclosed receipt of the following financial support for the research, authorship, and/or publication of this article: This study is supported by National Science and Technology Council, Taiwan (111-2622-E-011-019, 110-2622-E-011-013).