
Abstract
A new approach for functional finishing of cotton fabric using copper oxide nanoparticles and the phenolic compound of Azolla nilotica algae extract synergistically. In this sense, green synthesis nanoparticles have gained enormous attention in today’s world due to the ongoing demand to develop risk-free and high-efficiency functional cotton fabric compared to other methods. This study carried out the green synthesis of CuONPs with algae extract as a reducing agent and CuSO4 as a metal precursor. Phenolic compounds were prepared from algae extract through liquid-phase separation and combined with CuONPs to enhance the functionality of cotton. CuONPs were characterized using X-ray diffraction (XRD), a scanning electron microscope (SEM), FTIR spectral analysis, and a UV-vis spectrophotometer. The average particle size obtained was 21.59 nm. Optimization of process parameters for treating cotton fabric with CuONPs and phenolic compounds of algae extract was done using Box Behenken Design through the dip coating method. Finally, the fabric was evaluated for its multi-functionality in terms of antibacterial activity and percent blocking of ultraviolet radiation. From the optimization solution, the optimum values of 27.625 mm Zone of inhibition (ZOI) for gram-negative bacteria, 23.88 mm ZOI for gram-positive bacteria, and percent blocking of ultraviolet radiation with a value of 99.99% were obtained. In summary, the combination of CuONPs and phenolic compounds in Azolla notica algae extract possesses excellent potential for the functionalization of cotton fabric without affecting its comfort properties. Hence, they can be used as an inexpensive, promising, and efficient alternative for functional purposes.
Introduction
Cotton is the most commonly used natural cellulosic fibrous material for textile and apparel manufacturing; however, due to its inherently nutritious and hydrophilic properties, cotton fiber provides an excellent environment for the growth of bacteria, 1 and fungi. Furthermore, due to the more ideal conditions that cotton fabrics provide for the growth of microorganisms like bacteria and fungi, they are more susceptible to microbial degradation than synthetic fibers. This can lead to a decline in the strength of the textile, unpleasant odors, allergic reactions, and hygiene and health problems. 2 They do not have an effective barrier to UV radiation, especially when dyed in light shades. 3 Therefore, the growing consumer demand for improved functions in conventional textile products drives the modification of these fibers. Nowadays, textile materials undergo numerous finishes to impart multiple functions for different applications, such as sportswear, construction, medical, hygiene, transportation, and agriculture. 4 Antimicrobials and antiviral active surfaces, especially textiles, are becoming more and more popular as a result of the growing interest in lowering the quantity of potentially infectious agents on important high-touch surfaces. 5 Finishing involves modifying, activating, and functionalizing the exterior layers of textile materials. In actuality, the availability of functional textiles sparks innovation for new products that are tailored to the needs of the textile industry. 6 Modification of cotton fabric using nanomaterials has been found to play an important role in developing protective properties against pathogenic bacteria, 7 and UV radiation. 8 In literature, previously plant extracts, 9 Phenolic compounds of microalgae have been used for anti-inflammatory, antioxidant, and antimicrobial properties, among others,10,11 and organic compounds have been used for functional finishing purposes.12,13 The extraction of nanoparticles from the desired part of plant was economic or reduced ecological damage and could be considered a more sustainable, cheaper, and environmentally friendly source of phytoreducing agents, and this is a relatively new and unexplored area of nanoscience in textile technology. 14 Furthermore, the aquatic macroalga, Azolla pinnata (azolla), is called floating fern, mostly grown in ponds and backwaters of rivers. In addition, Azolla has wide applications such as fertilizer (a green manure), animal fodder, antioxidant, antiviral, antimicrobial, anticarcinogenic, anti-inflammatory, anti-diabetic, hepato- and gastro-protective, neuro-protective, cardio-protective, and anti-hypertensive effects due to its high content in proteins, flavonoids, hormones, alkaloids, phenols, triterpenoid derivatives, essential amino and fatty acids, vitamins (vitamin A, vitamin B12, beta-carotene), growth promoter intermediaries, and minerals.15,16 For this research based on the literatures,17,18 Azolla nylotica algae was used to extract sliver oxide nanoparticles for functional finishing.
Therefore, the functionalization of cotton using natural substances of organic and inorganic compounds was studied to impart various properties, including antibacterial,
19
UV protection,
20
wrinkle resistance,
21
hydrophobicity,
22
softening,
12
antioxidant properties,
23
and exceptional flame retardancy.
24
Copper oxide-titanium oxide nanocomposite for UV protection onto
This study aims to make cotton fabric multifunctional with UV protection and antibacterial properties using the phenolic compounds of Azolla nylotica algae extract and copper oxide nanoparticles through simultaneous application in a synergistic way. The box-Behnken design approach is used to create an ideal formulation for optimization. In this research, in comparison to the one factor at a time approach, Design-Expert software is a very successful statistical tool-based strategy that tests multiple factors at once with fewer experimental runs.
Materials and methods
Materials
The bleached plain woven 100% raw cotton fabric was used for the research (20s of count, 60 EPI (ends per inch), 60 PPI (picks per inch), weight of 135 g/m2, and thickness of 0.1 cm). The fabric and chemicals, such as copper sulfate (99.0% pure) and sodium hydroxide (99.8% pure), were supplied by the Bahirdar Textile Share Company (BDTSC), Ethiopia. Other chemicals used for the research, such as ethanol, were purchased from the market, while hexane (99% pure) was obtained from Bahir Dar University’s organic chemistry department. All chemicals used were analytical-grade chemicals. In addition, sample algae were collected from the Abay River and Lake Tana, which are found in Bahirdar, Ethiopia.
Methods
Preparation of plant extract
To prepare fine-sized powder, the collected algae were washed with tap water to remove dirt and dried with sun shad, then powdered using a mixer grinder. The resulting powder was passed through a 250-μm sieve mesh. Then, to prepare the crude extract, 10 g of powder was added to a cylinder containing 100 mL of distilled water with a 1:10 ratio at a temperature of 60°C. The resulting infusion is then filtered thoroughly until there is no insoluble material appears in the broth using Whitman’s high-grade filter paper (No. 1 filter paper).34,35 The pH level significantly influences the extraction yield and stability of phytochemicals. In the literature,36,37 different acidic pH was used to extract phenolic compounds. In acidic pH, the interaction between phenolic compounds and solvent is enhanced, leading to higher extraction yields.
38
Furthermore, direct studies specifically targeting Azolla nilotica may be limited, and similar studies on other plant materials suggest that maintaining a slightly acidic condition (around pH 3) is likely beneficial for maximizing phenolic extraction from Azolla nilotica leaves as well.39,40 Therefore, in this research, the pH of the solution was maintained at 3 with continuous stirring for 30 min, and finally, the crude plant was extracted as shown in Figure 1. The yields of extractions were calculated by comparing the weight of the dried sample with the weight of originally dried ground samples. Experimental setup for Azolla nilotica crude extraction processes.

Separation of phenolic compounds from the crude
Liquid-liquid phase separation, which is based on the variations in solubility of the various compounds in various solvents, was utilized to prepare the phenolic compounds and remove contaminants. Many other contaminants, including lipids and chlorophyll, were found in the crude extracts that were recovered after extraction. Shaking with a tiny amount of hexane removes these contaminants. Until there is no more green segment in the extract, the hexane layer holding the green chlorophyll portion is discarded, and the procedure is repeated. 41 Pour the cooled crude algal extract into a separator funnel and add water and hexane in a 3:1 ratio to ensure proper mixing and extraction. Hexane and water are combined in a 70:30 ratio to coat the top layer of the crude extract.42,43 Letting the mixture settle will allow the layers to separate based on their densities. Hexane, containing the dissolved nonpolar solvents, was the uppermost layer. Remove the uppermost layer of hexane carefully into another container. Dissolved nonpolar solvents should be present in this layer. To get the phenolic compounds, often known as antioxidants, recovery and purification procedures have been carried out to evaporate hexane from the collected layer. 44
Phytochemical screening
Qualitative phytochemical screening of Azolla nilotica algae extract.

Characterization
The chemical properties of the extract have been characterized. In the case of chemical property, FTIR was characterized. Qualitative phytochemical screening was done as a characterization for determining the main components.
Synthesis of copper oxide nanoparticles
To prepare CuO nanoparticles, 0.5 mM CuSO4 was dissolved in 100 mL of distilled water within a 500 mL baker at room temperature. Then the algae extract was mixed with CuSO4 solution at a 3:1 (v/v) ratio in a beaker, respectively.
47
To maintain the pH during extraction of copper oxide nanoparticles, a buffer solution was prepared. To prepare a buffer solution of pH nine for the extraction of copper oxide nanoparticles using plant extraction (Azolla nilotica algae), sodium bicarbonate (0.1MNaHCO₃), weak acid, and sodium hydroxide (0.1MNaOH), which are used for pH adjusting. This buffer can help maintain an alkaline environment suitable for extracting copper oxide nanoparticles from plant materials, as higher pH levels generally enhance metal ion solubility and extraction efficiency. After achieving and stabilizing at pH 9, proceed with the synthesis of CuO NPs by adjusting the temperature. Then the mixture was heated on a magnetic stirrer at 60°C for 2 h, and the solution was allowed to cool to room temperature. Finally, the dark brown color was separated from the cooled mixture using a centrifuge at 4000 r/min for 15 min. Therefore, centrifuges are essential in nanoparticle synthesis, improving separation efficiency, enabling purification, establishing concentration gradients for ordered structures, and facilitating controlled sedimentation and deposition methods. Then it was washed with distilled water to remove impurities and to maintain the pH at 7. The dark brown precipitate was kept in an oven at 70°C for 12 h. The dried CuO nanoparticles were kept in a furnace at 400°C for 2 h for complete evaporation of moisture. These copper oxide nanoparticles were obtained, which were packed with aluminum foil for future use. The synthesis design pictorial is shown in Figure 2. Experimental setup of copper oxide nanoparticle synthesis process.
Characterization
In this research article, UV-Vis spectroscopy was used for the characterization of copper oxide nanoparticles. It typically covers a wavelength range of 190 nm to 1100 nm at a best resolution ranging from 1 nm to 5 nm with an operating range of 20 °C–25°C. In addition, Fourier transform infrared spectroscopy (FTIR) identifies chemical bonds in a molecule by producing an infrared absorption spectrum. The synthesized CuO NPs were characterized by Fourier transform infrared spectroscopy (FTIR) Perkin Elmer version over the frequency range from 4000 to 500 cm−1 at the best resolution of 0.5 cm−1 with an operating range of 5 °C–45°C. Another tool used for characterization and identification of the crystal structure, crystallographic orientation, and phase composition of nanomaterials, particularly copper oxide nanoparticles, was X-ray diffraction. Moreover, the specific surface morphology of the copper oxide nanoparticle was investigated and characterized by scanning electron microscopy. SEM images can provide information about the distribution of the CuO NPs on the surface and whether particles are evenly distributed from clusters, depending on the synthesis method and condition. In addition, the thermal stability of copper oxide nanoparticles was characterized using Thermo gravimetric analysis (TGA). It was determined using a Perkin Elmer Thermo gravimetric analyzer (TGA4000), which works up to a temperature of 1000°C and is 21 CFR Part 11 compatible.
Factor selection for optimization
Run of experimental design for applying copper oxide Nanoparticles and phenolic compounds on cotton fabric by dip coating method.

Testing and evaluating
Antibacterial test
UVR rating and protective category.

UV protection test

Results of the experimental run for the optimization process.

Wash durability test
The AATCC 22 method, which is based on the laundry machine concept, evaluated the wash durability of treated fabrics to measure the fabric’s water resistance after treatment.
Air permeability test
It is the main fabric comfort property testing method since it is related to breathability. The comfort property of treated fabrics was tested as per FX 3300 air permeability tester ASTMD737-96.
Tensile strength test
This test evaluates the fabric’s elasticity and strength following its nanoparticle treatment. The test was conducted per ISO 13934/2 standards, and the results offer important insights into how the nano-treatment impacts the mechanical properties of the fabric, particularly its tensile strength and elongation characteristics.
Fabric stiffness testing
Fabric handles and drapes are influenced by factors such as fabric stiffness and bending angle length. Both the warp and weft directions were evaluated for the effect of finishing chemicals on stiffness. The 20 by 20 cm sample was created, and it was examined using the ISO13934 stiffness test method, which analyzed the bending length of the treated and control samples. Three samples, one for each warp and weft direction, were averaged for the tests.
Result and discussion
Characterization of phenolic compounds
The FTIR spectra, which is used for determining potential functional biomolecules in the plant extract. The spectra of hot water extract of Azolla nilotica algae phytochemicals used for the reduction and stabilization of CuO NPs in the bioreduction process are shown in Figure 3. FTIR spectra of hot water extract of Azolla nilotica.
The maximum wavenumber measured in Azolla nilotica hot water extract showed peaks at 3655 cm−1 indicating the presence of strong O-H bonding of carboxyl groups. While 939 cm−1 shows the bending of O-H groups. 2920 cm−1 indicating the -CH stretching of aliphatic groups; 1619 cm−1 representing the bonds of COO− anions and C = C aromatic are conjugates; and 1462 cm−1 indicating C = O groups from aromatic rings having conjugation; and moreover 1400 cm−1 showing bending vibrations of C-OH alcoholic group and C-O single bond vibrations of ether linkages. Furthermore, based on the previous literature, 54 functional groups such as C-O, OH, C = O, and COOH have a strong affinity to bind metals to produce highly stable nanoparticles. The IR band indicates different phytochemicals present in the Azolla nilotica extract, including phytochemicals that were not screened well by the reagent phytochemical screening methods.
Characterization of copper oxide nanoparticles
The hot water extract of Azolla nilotica was used to achieve the synthesis of CuO NPs. The extraction yield obtained was 71.1% among 7.98 g of copper sulfate, with an actual yield of 5.67 g CuO NPs. It confirmed that the efficiency of Azolla nilotica algae extracts can rapidly synthesize copper oxide nanoparticles due to the presence of strong reducing and stabilizing phytochemicals such as flavonoids, phenolics, and tannins.
UV-vis spectroscopic analysis
As peak positions and forms are sensitive to particle size, UV-visible spectroscopy is a particularly effective tool for studying metal nanoparticles. The signature of the creation of nanoparticles is the surface Plasmon resonance peak, according to this study.
55
It happens when the energy of the photons equals the energy of the free electrons in the nanoparticles, causing the electrons to oscillate and form a surface Plasmon. In this study, the properties of surface Plasmon resonance (SPR) with an absorbance of 421 nm were obtained. This shows the presence of copper oxide nanoparticles displayed in the UV-visible absorption spectrum of the nanoparticle, scanned from 300 nm to 800 nm, and the UV-visible analysis of copper oxide nanoparticles is illustrated in Figure 4. UV–Visible analysis of copper oxide nanoparticles extracted with Azolla nilotica algae hot water extract.
FTIR analysis
From the FTIR GRAPH, the FTIR of the copper oxide nanoparticles appears to be a mirror image of the FTIR of the algal extract from Azolla nilotica, except for a little shift in the peak of the copper oxide nanoparticles as shown in Figure 5. This graph shows that the extract biomolecules contribute to the formation of CuO NPs, improving their ability to reduce, stabilize, and cap the nanoparticles. In addition, the comparison was done for the FTIR of copper sulfate and CuO NPs. A broad absorption peak was observed in the FTIR spectrum of CuO NPs compared to copper sulfate (Cu2SO4), which is caused by the adsorbed water molecules and functional group of the reducing agents. Furthermore, the adsorption of water is due to the high surface area-to-volume ratio of the nanoparticles. Although both copper sulfate and copper oxide nanoparticles contain copper-oxygen bonds, the specific Cu-O stretching frequencies and presence of additional functional groups differ between the two chemical species based on their chemical composition and synthesis methods. FTIR spectra of Copper oxide nanoparticles and copper sulfate.
The above Figure 5 shows that the FTIR spectra were recorded in the solid phase at a range of 4000–500 cm−1 for the precursor and nanoparticles. The peak at 3720 cm−1 indicates the presence of strong O-H bonding of carboxyl groups that is O-H bond stretching. In addition, the peak 2929 cm−1 shows that -CH stretching of aliphatic groups, while the peak 1600 cm−1 represents the bonds of COO-anions and C = C aromatics are conjugates. Moreover, the peak at 1405 cm−1 was indicating C = O groups from aromatic rings having conjugation, and 1025 cm−1 showed bending vibrations of the C-OH alcoholic group and C-O single bond vibrations of ether linkages. In conclusion, the C = O bond indicates the presence of aromaticity in the synthesized nanoparticles.
SEM analysis
The surface morphology of copper oxide nanoparticles was recorded at 6000x, 3000x, 1000x, and 600x magnifications through SEM. The surface morphology analysis was important because the antimicrobial activity of the nanoparticle depends on the morphology of the nanoparticles. Therefore, the CuO NPs graph depicts the SEM image of these samples laid out and clearly shows low and high aggregation white backgrounds with some distributed dark areas, which could be phytochemical components distributed on copper oxide nanoparticles. As can be seen from Figure 6, the nanoparticles appeared small and some agglomerated, with different morphologies, from spherical shapes of various sizes to amorphous shapes. The observations from copper oxide nanoparticle images were recorded at 6000x magnification by SEM (as shown in Figure 6(a)) is distributed in a good manner, and as a result, it has a proper and well-defined homogenous crystallized structure with low aggregations. SEM image of synthesized copper oxide nanoparticles.
The micrograph-derived CuO NPs recorded at 3000x, 1000x, and 600x magnification by SEM (as shown in Figure 6(b), (c) and (d)) are exhibited as voluminous and agglomerated. The agglomeration of nanoparticles is usually explained as a common way to minimize their surface-free energy due to polarity and the strong electrostatic attractive inter-particle force of CuO NPs. The more voids and pores present in the sample show the large number of gases produced during the synthesis of the nanoparticles. 56
XRD analysis
The synthesized CuO NPs from copper sulfate and Azola nilotica algae extract were confirmed 2θ using X-ray diffraction measurements. The diffracted intensities were recorded in a wide scanning range from 0° to 90°, which is shown in Figure 7. The diffraction major peaks were observed at 2θ values of 19.45°, 22.79°, 28.35°, 29.89°, 31.76°, 34.09°, 35.69°, 36.58°, 38.79°, 42.57°, 48.93°, 58.45°, 61.69°, 65.92°, and 67.97°. The absence of diffraction peaks in the XRD patterns and crystal size show the low purity of synthesized CuO NPs. The mean average crystal size of the synthesized CuO NP was calculated using Debye Scherrer’s formula used to calculate the crystalline size of the nanoparticles as shown in equation (3). The average crystal size of CuO NPs corresponding to the most intense peaks was 21.56 nm. XRD pattern of CuO NPs synthesized using Azolla nilotica algae extract.

Thermal analysis
To find out how stable CuO NPs would be at high temperatures, their thermal stability was evaluated using Thermogravimetric analysis. When nanoparticles were exposed to controlled temperature fluctuations, the resulting weight changes were measured as shown in Figure 8. There are about two weight losses from 50 to 200°C and from 200 to 450°C. The first weight loss of about 10% was due to the loss of moisture content on exposure to the atmosphere, whereas the second weight loss, about 40%, was due to the decomposition of copper oxide nanoparticles. TGA curve of copper oxide nanoparticles.
Data presentation
Data presentation about antibacterial test
The antibacterial test for the experimental runs was done, and the results were presented as gram-negative bacteria (E. coli) and gram-positive bacteria (Staphylococcus aurous) (as shown in Figure 9 and respectively) by the zone of inhibition method. However, the samples without an inhibition zone concede that they do not have an antibacterial effect. Therefore, the control sample, which was not treated with antibacterial active agents, did not show a clear inhibition zone. This means the antimicrobial activity of the untreated cotton fabric was too much less compared to the treated one. The test mechanism was done by putting a 10 × 10 mm fabric sample on a nutrient agar plate, inoculating it with a bacterial culture, and then incubating it. Following incubation, the circumference of the inhibition zone surrounding the fabric sample was measured carefully. The measured test results were expressed in millimeters of diameter, as shown in Figure 9. Antibacterial test (a- gram-negative and b -gram-positive bacteria) for treated total run samples.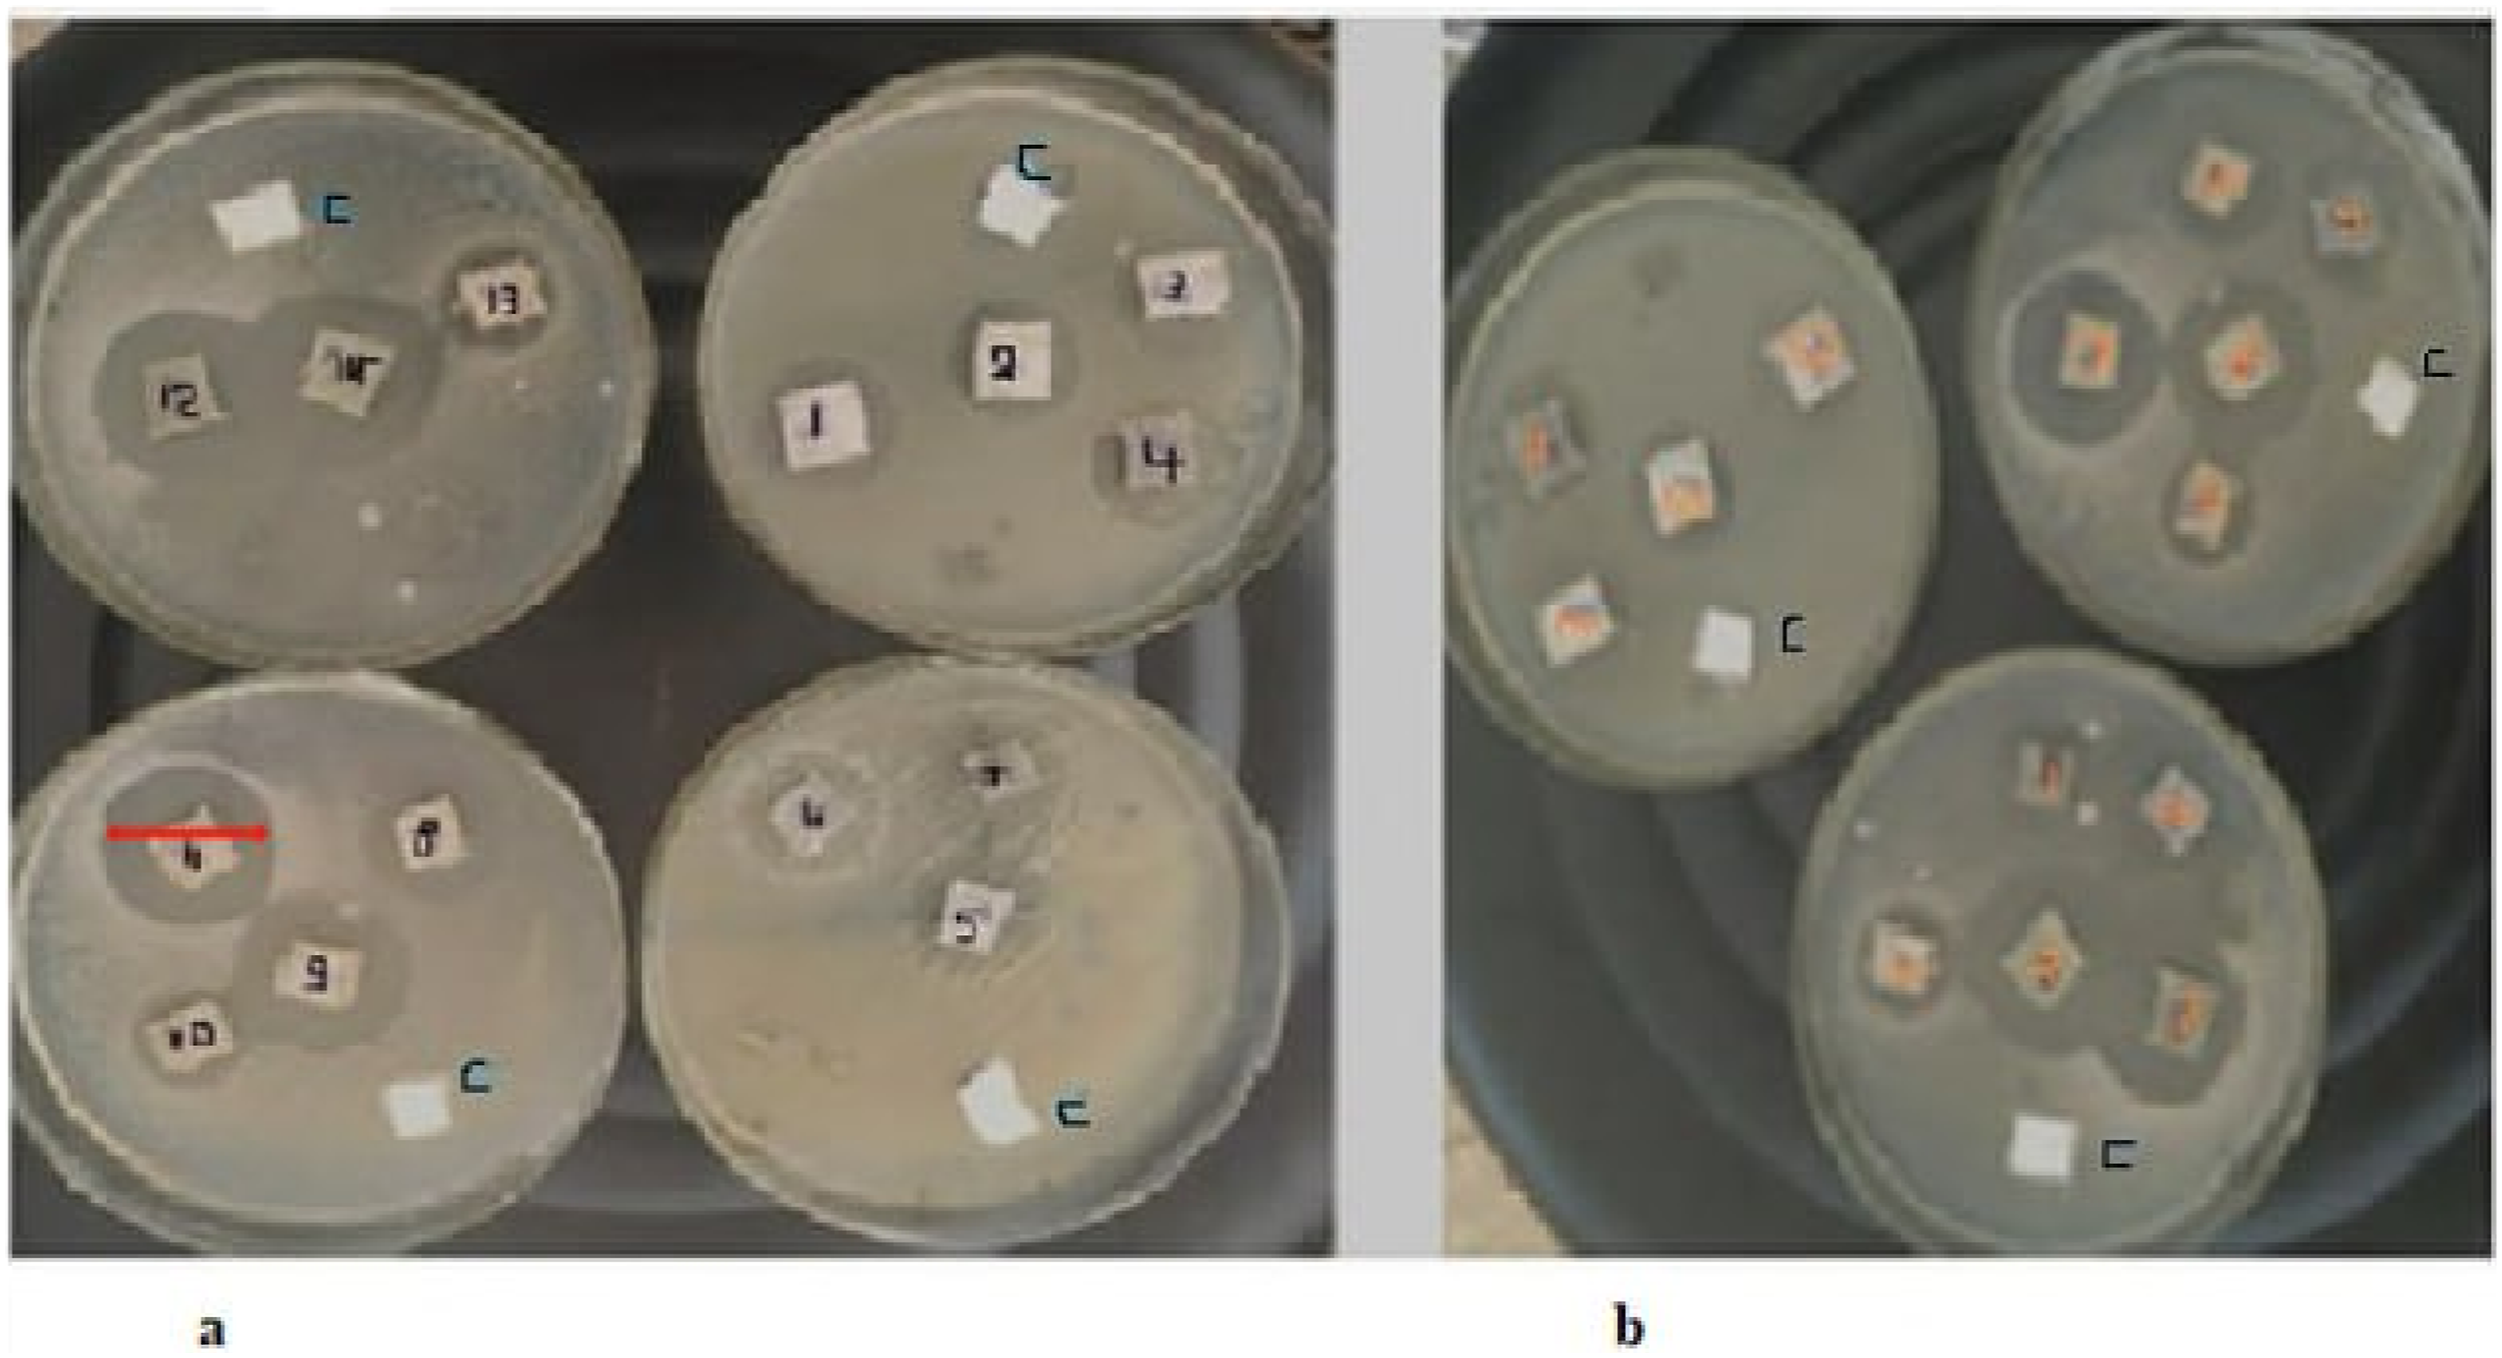
In conclusion, each sample was leveled with numbers; for example, the sample with number one indicates the sample for run number one, and the letter C indicates the control sample or untreated sample, the same for others for both gram-negative and gram-positive bacteria.
Data presentation about UV protection test
The ultraviolet radiation protection test was done in terms of percent blocking of UVR based on average transmittance of radiations. A wavelength of 280-400 nm was taken to calculate the average transmittance of 14 experimental runs for determining the response percent block of UVR. The result was expressed as a percent block rating category. For example, run number one with an average transmittance of 2.0830% will be 97.91% based on equation (1). Therefore, the percent block for run number one is 97.91%. The same % block UVR was recorded for each run as shown in Table 4.
Data analysis
Model fitting
Model fitting and the analysis of variance response surface method were employed with a Box–Behnken design to investigate the effects of phenolic compounds, CuO NPs, and time on the zone of inhibition of gram-negative bacteria gram-positive bacteria, and the percent blocking of ultraviolet radiation of the treated plain cotton fabric. About responding gram-negative bacteria, the difference between the adjusted R2 of 0.9262 and the expected R2 of 0.7821 is less than 0.2. In addition, there is less than a 0.2 difference between the adjusted R2 of 0.9613 and the expected R2 of 0.8665 for gram-positive bacteria, indicating a satisfactory agreement. The modified R2 of 0.9751 and the projected R2 of 0.8910 are reasonably in agreement; that is, the difference in percent blocking of UV light is less than 0.2. A ratio that is higher than four is preferred. Therefore, the model can be used to navigate the design space.
Quadratic polynomial equations for the three responses in terms of coded factors.

In these equations, Y is the predicted response, A, B, and C are the values of the independent variables, phenolic compounds (%), CuO NPs (M), and time, respectively.
Regression equation
In the regression equation, only coefficients of significant factors are included. The following formula gives the quartic model of three factors.
ANOVA
ANOVA for the quadratic polynomial models developed for the response variables; zone of inhibition of gram-negative bacteria, zone of inhibition of gram-positive bacteria, and %Blocking UVR. ZOI gram-negative bacteria ZOI gram-positive bacteria %Blocking UVR.
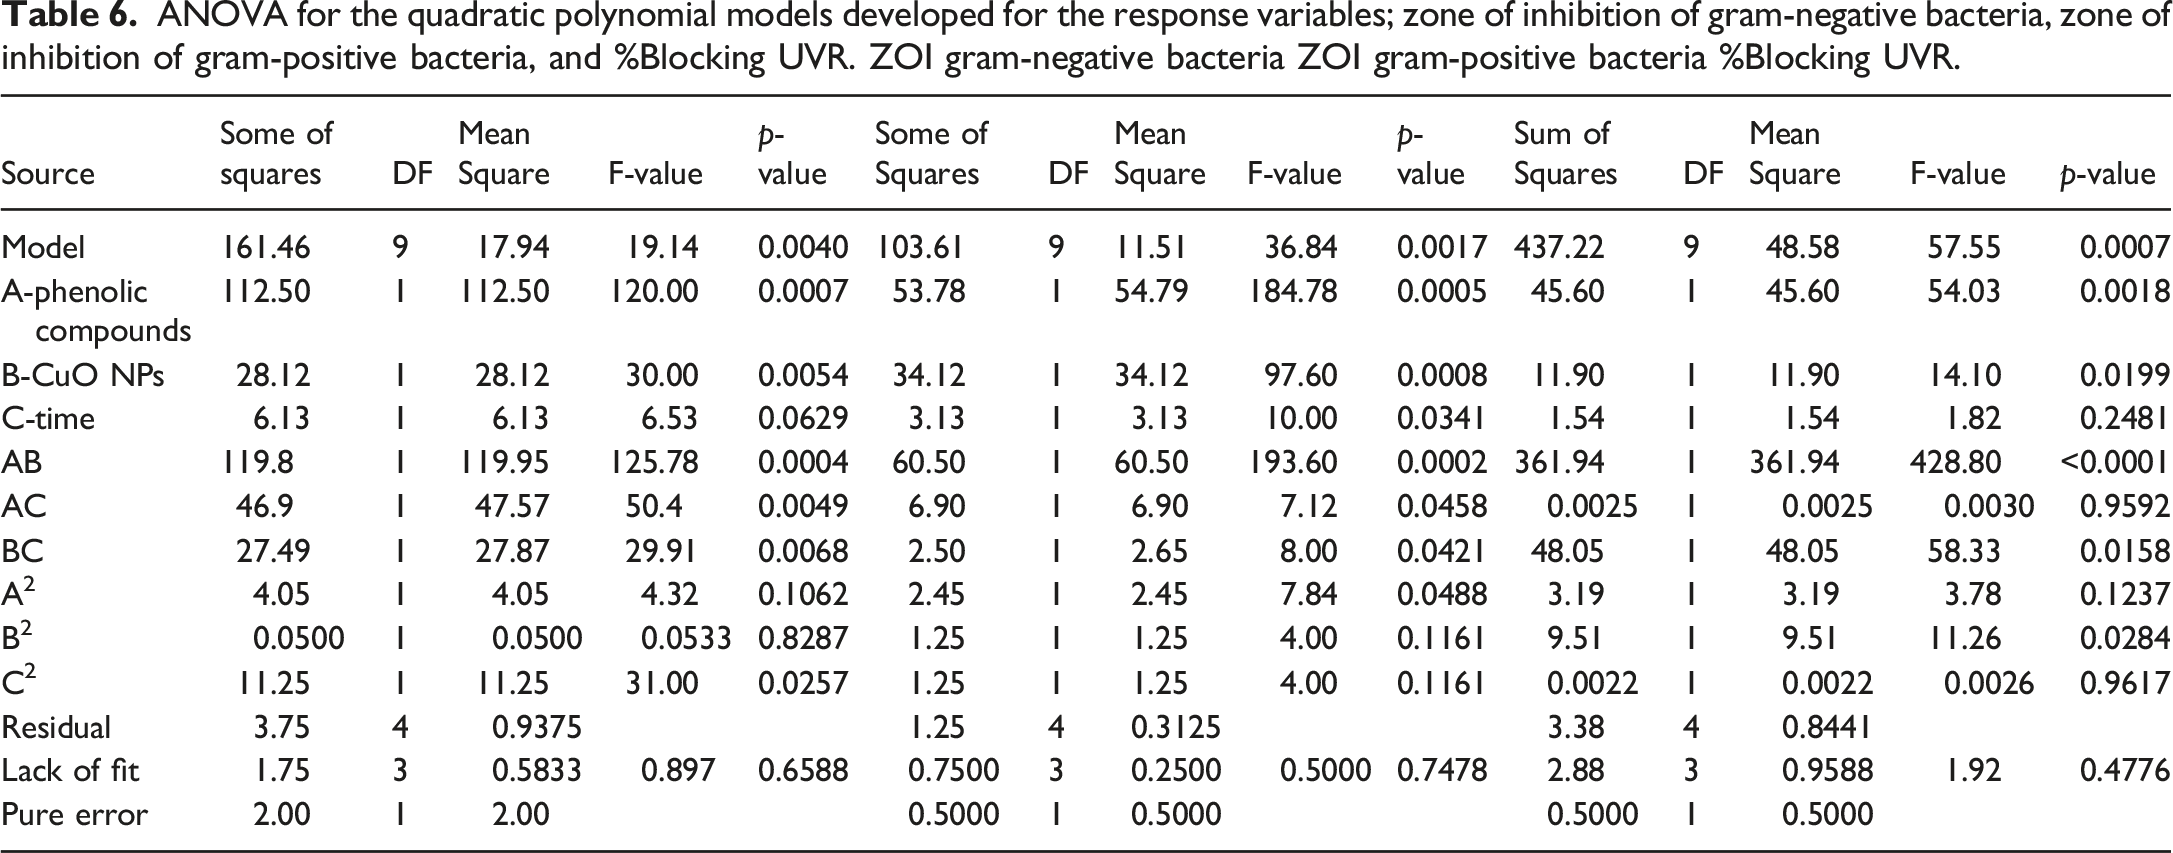
An analysis of variance in the case of gram-negative bacteria reveals an F value of 19.14, indicating a 0.6% probability that noise may cause a high value. Less than 0.05 of the 95% confidence level is represented by the p-value of 0.0040. When studying gram-negative bacteria, model terms are significant, according to both P and F values. Furthermore, the F-value of 0.897 indicates that the lack of fit is not statistically significant in terms of pure error. The p-value, which is greater than 0.05 at a 95% confidence interval, is 0.6588 (0.6588 > 0.05). In contrast to the components B2 and C2, which are not significant, Table 4 demonstrates that factors like A, B, C, AB, AC, BC, and A2 are significant model terms since their p-values are less than 0.05 in a 95% confidence interval. After all, their p-value is bigger than 0.05 in a 95% confidence interval because of terms for the specified model. Additionally, the ANOVA table demonstrates that the majority of terms A, B, C, AB, AC, BC, and A2 significantly influence how gram-positive bacteria respond in the zone of inhibition. Furthermore, the 0.50 F-value for lack of fit indicates that the lack of fit is not statistically significant compared to the pure error. In the case of gram-positive bacteria, the p-value at a 95% confidence interval is 0.7478, which is more than 0.05 (0.7478 > 0.05), indicating a non-significant lack of fit. The ANOVA for percent blocking of ultraviolet radiation protection makes clear that factors such as A, B, AB, BC, and B2 are significant model terms. The other components from the analysis of the variance table are not significant for the given model because their p-value exceeds 0.05 of the 95% confidence interval. The lack of fit F-value of 1.92 implies the lack of fit is not significant relative to the pure error. The p-value at a 95% confidence interval shows 0.4776, which is greater than 0.05 (0.4776 > 0.05), resulting in a lack of fit that is not significant. Therefore, a non-significant lack of fit is good; we want the model to fit. This indicates that a quadratic model properly observes the zone of inhibition of gram-negative bacteria, the zone of inhibition of gram-positive bacteria, and the percent blocking of UVR. The percent blocking of ultraviolet radiation protection with the factors phenolic compounds, copper oxide nanoparticles, and time.
Effect of main factor on the response
The effect of main factors offers a simple method to evaluate the influence of a single factor on the result by quantifying the average change in response variable brought about by varying its level.
From Figure 10 above, the factor (A) or phenolic compounds have an enhanced effect on response. When the concentration changes from left to right, the inhibition of gram-negative bacteria increases since the hydroxyl group of the extract increases. This means the percentage concentration of the OH group increases in a solution prepared. In addition, the hydroxyl group of the phenolic compounds can penetrate, disrupt, and bind to inactivate bacterial enzymes essential for growth and survival. The lipid bilayer causes leakage of cellular contents and ultimately death in bacterial cells.
57
In the case of factor (B) or copper oxide nanoparticles, based on the previous literature, an electron transfer between the negatively charged bacteria and copper oxide nanoparticles is one of the effective mechanisms that cause the bacterial membrane to rupture and exert antibacterial activity.
58
The Cu2+ and Cu + released from CuONPs dissolution undergo a chemical reaction, producing many oxidative free radicals (ROS), which can damage the cell respiratory chain and membrane structure and cause DNA cleavage in gram-negative bacteria. Furthermore, factor (C) or time from the one-factor interactions shown in Figure 10 shows that there is an increasing effect on the response from left to right or from 20 to 30 min. After 30 min, there is a decreasing effect since increasing dipping time of the fabric with active agents reaches a saturation point.
59
Effect of main factors on the zone of inhibition of gram-negative bacteria.
From Figure 11 above, factor A, or phenolic compounds, has a higher effect on the ZOI of gram-positive bacteria. As the concentration changes from left to right, the inhibition of gram-positive bacteria increases since the concentration of the hydroxyl group in phenolic compounds increases. This means the OH group reacts with the bacterial cell, and there is an increase in the inhibition of gram-positive bacteria. Therefore, higher quantities of these antibacterial compounds would be more effective. It can be assumed that raising the concentration of phenolic compounds from low to high would likely result in a larger zone of inhibition against gram-positive bacteria. The hydroxyl group of the phenolic compounds could disrupt and bind to inactivate bacterial enzymes essential for the growth and survival of bacteria.
60
In addition, the effect of copper oxide nanoparticles, or factor B, on the response shows an increasing effect, as from left to right. The graph shows the same increasing effect as the gram-negative bacteria. The electron transfer between the negatively charged bacteria and copper oxide nanoparticles is one of the effective mechanisms that cause the bacterial membrane to rupture and exert antibacterial activity. The Cu2+ and Cu + released from CuO NP dissolution undergo a chemical reaction, producing a large number of oxidative free radicals (ROS), which can damage the cell respiratory chain and membrane structure and cause DNA cleavage in gram-negative bacteria. Furthermore, the dipping time of the fabric to active agents during the coating process affects the ZOI of gram-positive bacteria. There is an increase in nanoparticle deposition through time. Factor C, or time from the one-factor interaction, shows that there is a reasonable increment of up to 30 min and then a decrease afterward due to enough amounts of active agents deposited on the fabric.
61
Effect of main factors on zone inhibition of gram-positive bacteria.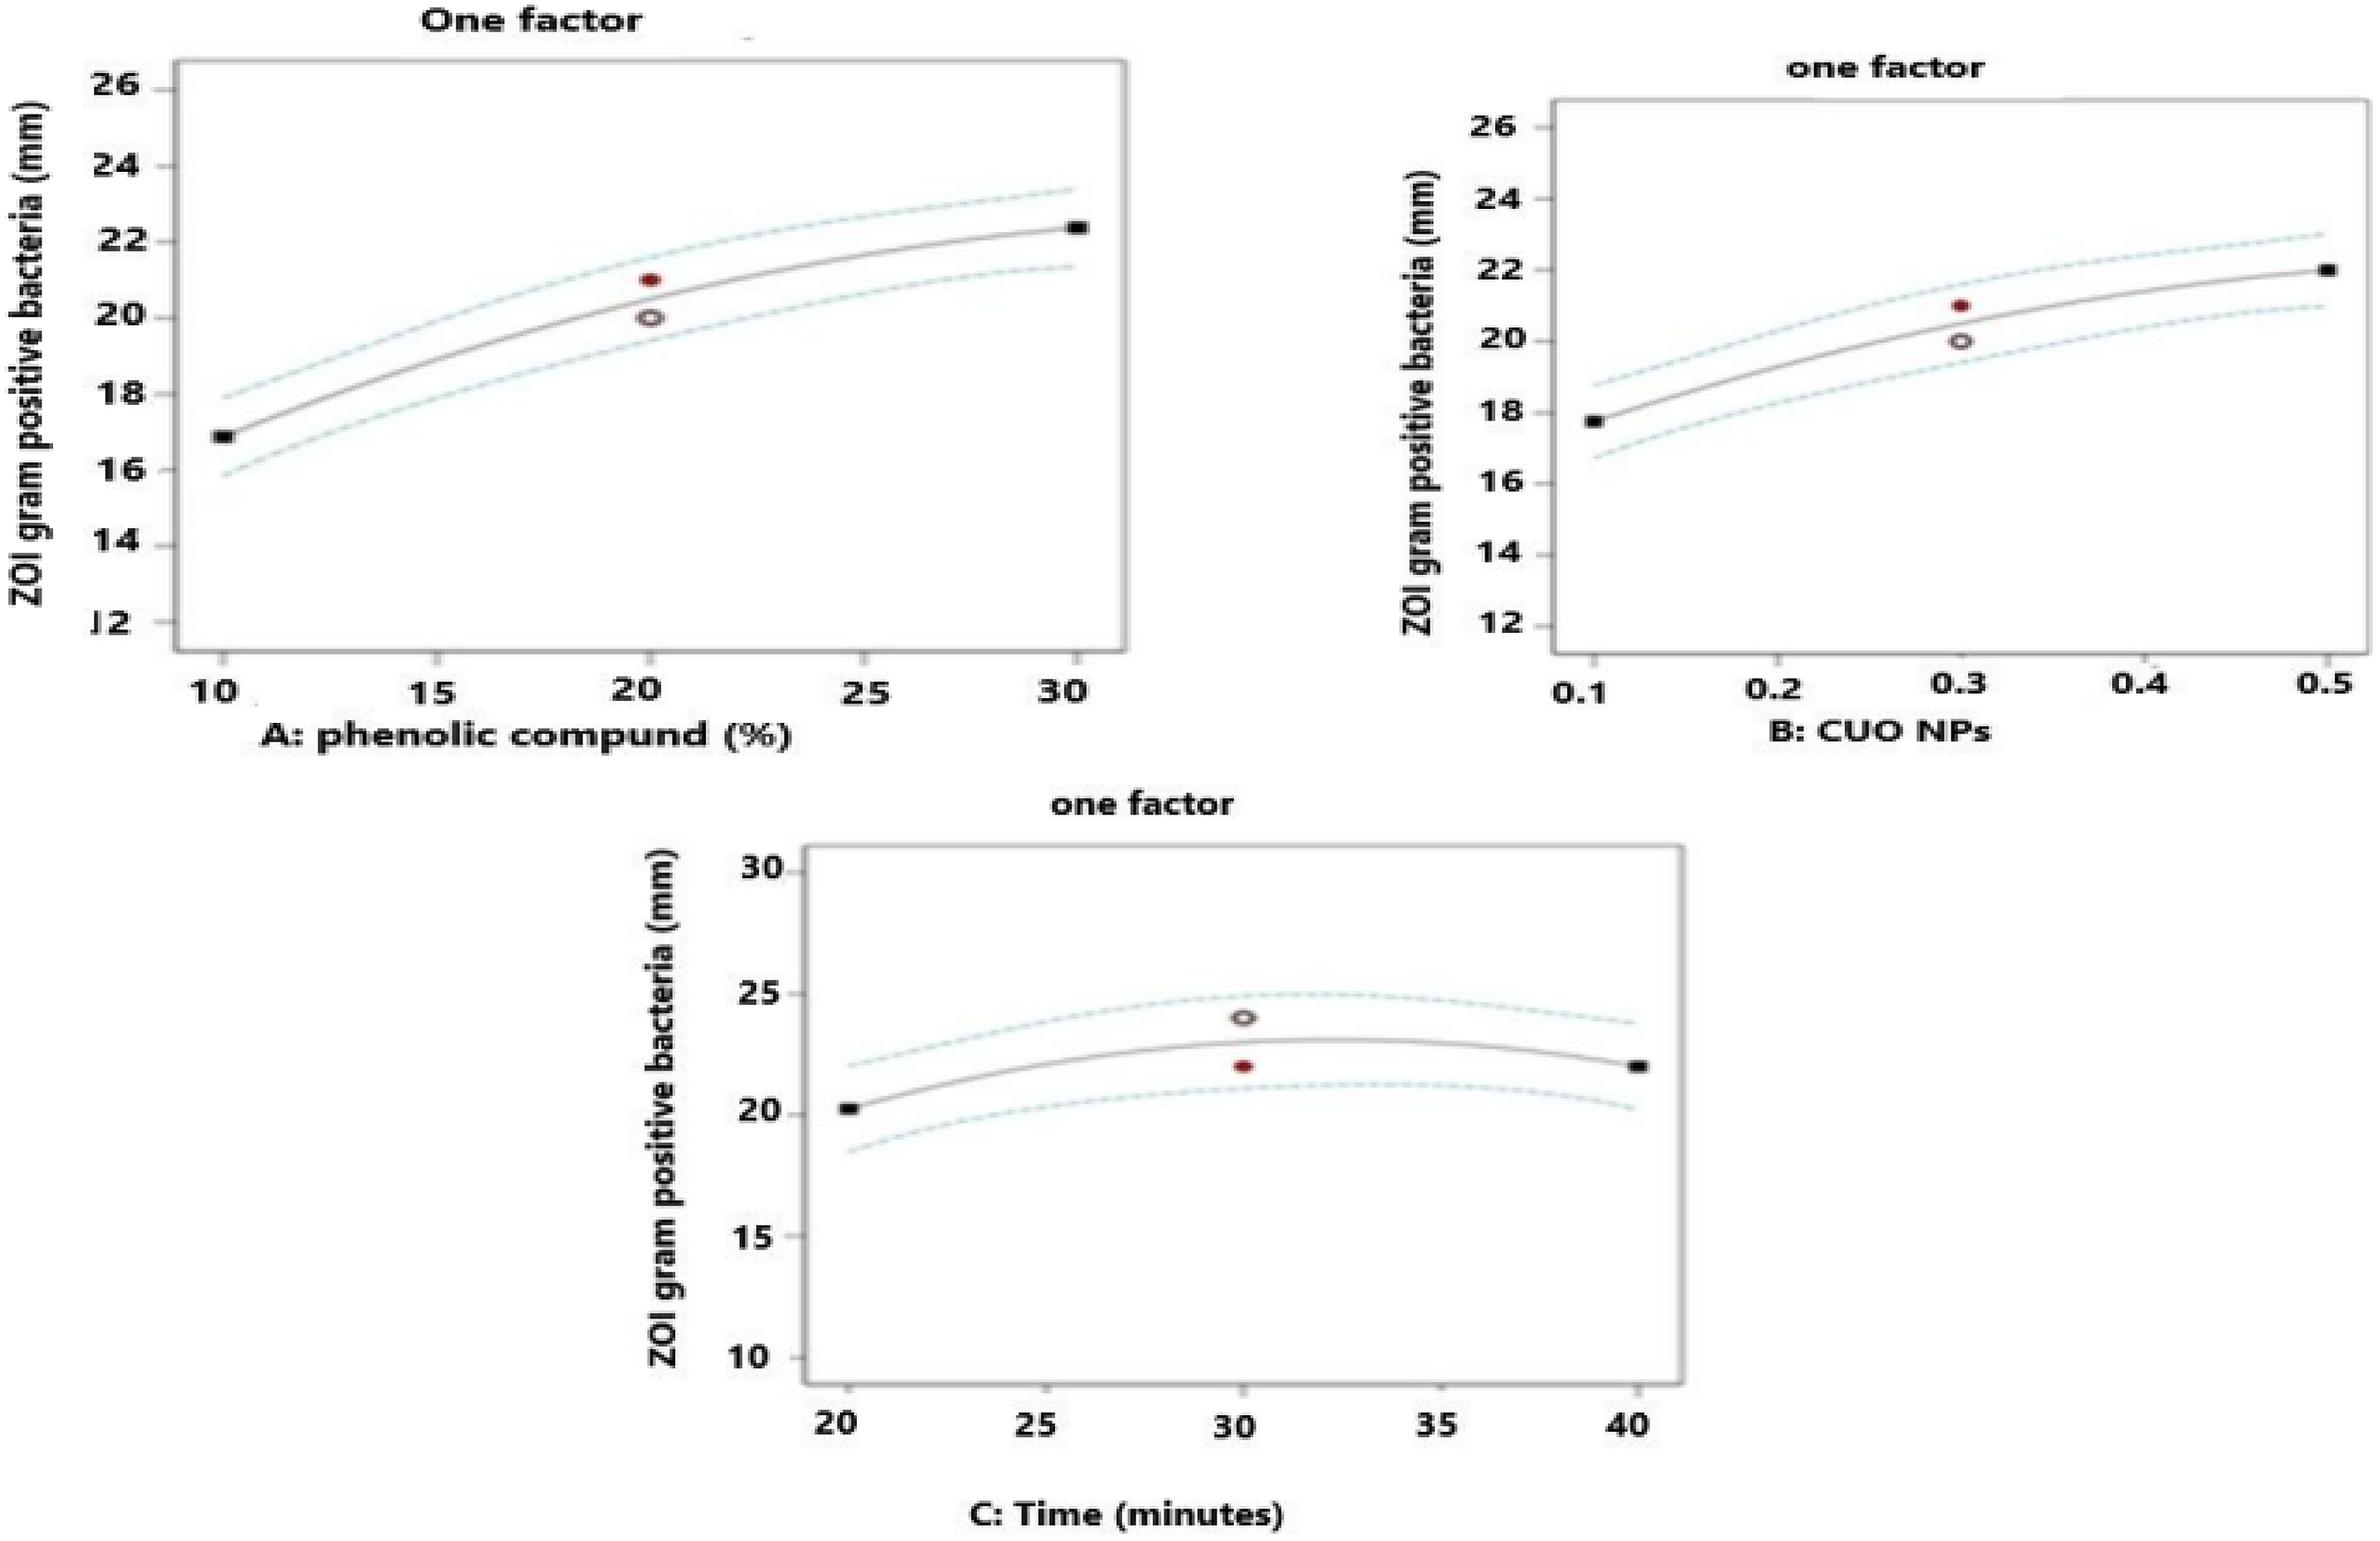
As the value of factor A, or phenolic compounds, increases from left to right, the percent blocking of ultraviolet radiation increases. This is due to the increment of hydroxyl free radicals in Azolla nilotica algae, which come from flavonoids, alkaloids, and tannin. The graph of the phenolic compound against percent-blocking ultraviolet radiation shows an increasing effect. Therefore, further increasing the concentration of phenolic compounds in Azola nilotica algae extracts leads to an increase in the percent blocking of ultraviolet radiation.
46
As Figure 12 illustrates, the copper oxide nanoparticles, or factor B, have a sharp increasing effect on the response factor, or UVR. As the concentration increased from 0.1 to 0.5 molarity, there was an increase in the percent blocking of ultraviolet protection, which means the positive holes that absorb ultraviolet radiation in copper oxide nanoparticles increased as the concentration increased. In addition, the electrons and holes react with oxygen and water molecules to generate O2, H2O2, and hydroxyl radicals based on the previous literature. Furthermore, the effect of factor A (phenolic compound) on the percent blocking ultraviolet radiation shows an increasing effect from left to right. This indicates that as the concentration increases from 10 to 30%, the percent blocking of factor A (phenolic compound) increases due to the deposition of more phenolic compounds on the surface.
62
Effect of main factors on percent blacking of ultraviolet radiation.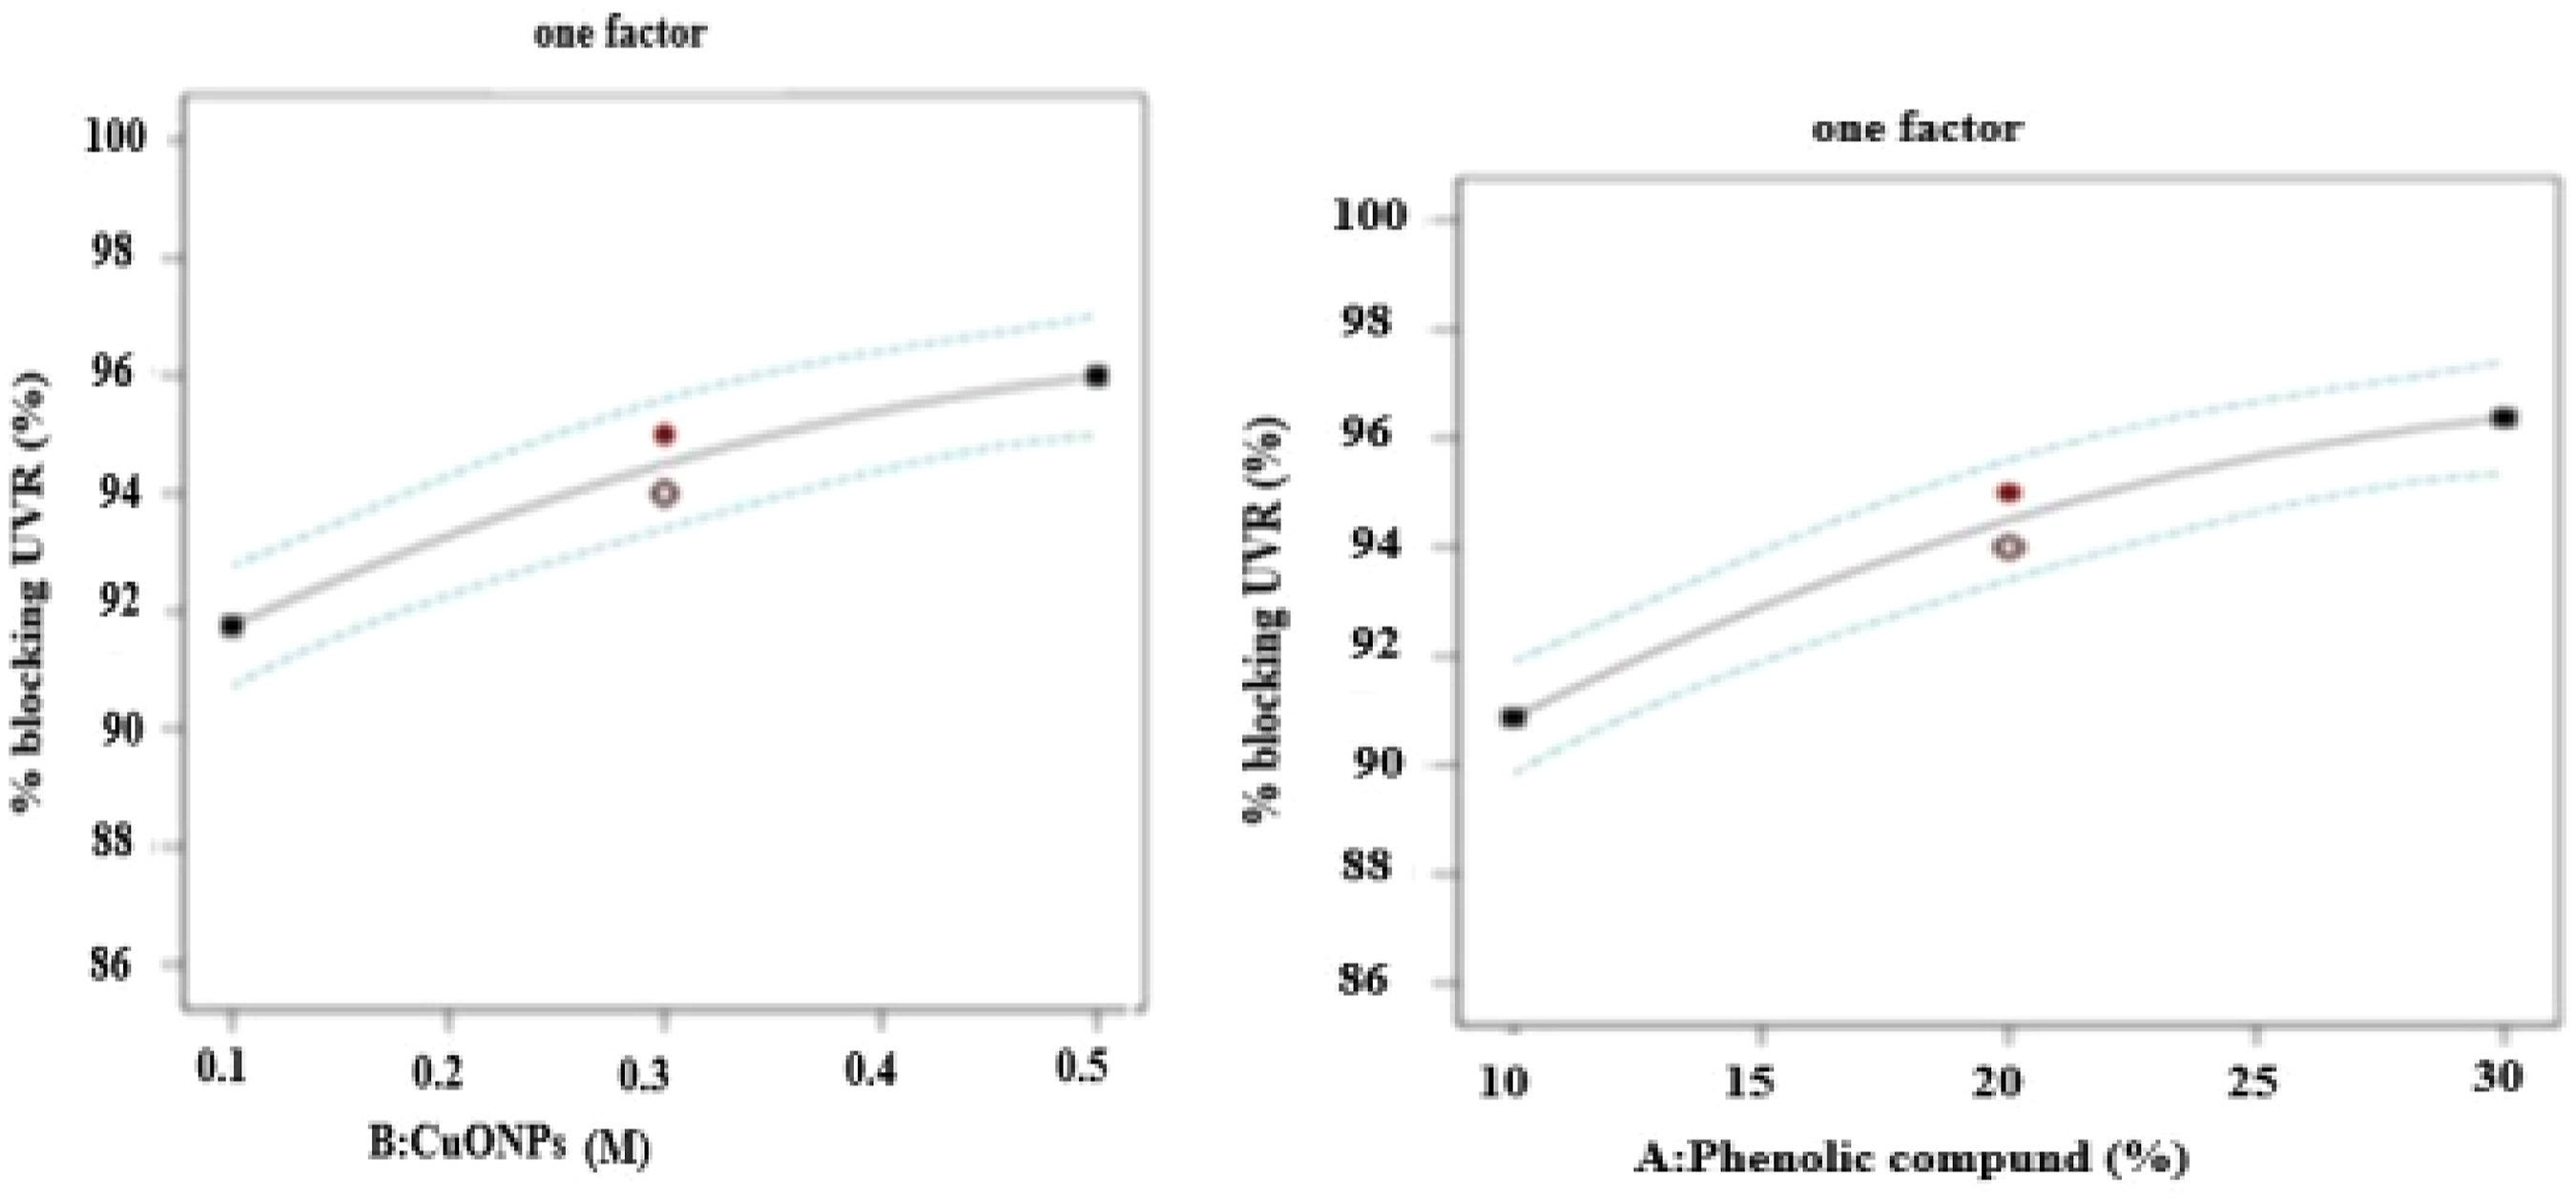
3D surface
The 3D surface shows the effect of significant of independent variables, which are phenolic compounds, copper oxide nanoparticles, and time on to the response zone of inhibition of gram-negative bacteria, gram-positive bacteria, and percent blocking ultraviolet radiation with the three-dimensional graph. The interaction effects of factors on the 3D graph were shown for each response as follows.
The 3D surface (A) shows that the interaction effects of phenolic compounds and CuO NPs on the response zone of inhibition of gram-negative bacteria are shown in Figure 13 above. The response with a maximum zone of inhibition of gram-negative bacteria of 23 mm was obtained with the factors CuO NPs (0.29 molarity) and phenolic compounds (20%), respectively. In addition, the 3D surface (B) shows the interaction effect of phenolic compounds and time on the response zone of inhibition of gram-negative bacteria. As a result, the maximum inhibition zone for the response of gram-negative bacteria at 23 mm was obtained with factor phenolic compound 20% and a time of 30 min, respectively. Furthermore, the 3D surface (C) of the interaction effect of phenolic compounds and time on the response zone of inhibition of gram-negative bacteria. The maximum inhibition zone for the response of gram-negative bacteria at 23 mm was obtained with a factor CuO NPs value of 0.3 molarity and a time of 30 min, respectively. Overall, the value of the response is determined by the change in the level of one factor depending on the level of the other. Interaction effects of independent factors on the zone of inhibition of gram-negative bacteria.
The 3D surface, as shown in Figure 14, shows that the factor with phenolic compounds and copper oxide nanoparticles is in the response zone of inhibition of gram-positive bacteria. From the 3D graph (D), the response with a maximum zone of inhibition of gram-positive bacteria of 21 mm was obtained with CuO NPs of 0.3 molarity and phenolic compounds of 20%, respectively. In addition, the 3D surface (E) shows the phenolic compounds and time on to the response zone of inhibition of gram-positive bacteria. The response with a maximum zone of inhibition of gram-positive bacteria of 21 mm was obtained with a factor time of 30 min and a phenolic compound of 20%, respectively. Furthermore, the interaction effects of CuO NPs and time (F) factors on the response zone of inhibition of gram-positive bacteria. The response with a maximal zone of inhibition of 21 mm for gram-positive bacteria was reached with a factor of 0.3 M and 30 min, respectively. The 3D surface of an interaction effect of factors on the zone of inhibition of gram-positive bacteria.
The three-dimensional surface, in Figure 15 (G) shows the interaction effect of phenolic compound concentration and copper oxide nanoparticles on the response of percent-blocking ultraviolet protection (UVR). Here, the maximum percent blocking ultraviolet protection was 95% obtained at 0.3 molarity of CuO NPs and 20% of phenolic compounds, respectively. In addition, the 3D surface (H) shows the combined effect of copper oxide nanoparticles and time on the response percent blocking ultraviolet protection. As a result, the maximum percent blocking ultraviolet protection was 95.8% obtained at 0.3 molarity of CuO NPs and a time of 30 min, respectively. Phenolic compounds and CuO NPs 3D surface of percent blocking ultraviolet protection.
Optimization processes
The optimized value of independent factors based on response variables.

Cotton fabric treated with copper oxide nanoparticles and phenolic compounds was found to have better antibacterial and ultraviolet protection. This is due to the impact of copper ions released from copper oxide nanoparticles with different oxidation states (Cu+ and Cu2+) that react with the negatively charged bacteria cells. Therefore, the released ions attached to the cellular metabolism inhibit bacterial cell growth and suppress respiration. 63 In addition, the phenolic compounds from Azola nilotica alga extract have an impact on bacteria as copper oxide nanoparticles. This is due to the presence of OH ions that react with bacterial cells and exhibit better antimicrobial effects. 64 In conclusion, These free radicals from copper oxide nanoparticles and phenolic compounds can trap ultraviolet radiation, based on the previous literature. 65 When combining the two factors, the values in this indicate that the synergistic effect of the two active agents increases the antimicrobial and ultraviolet radiation protection abilities of plain cotton fabric.
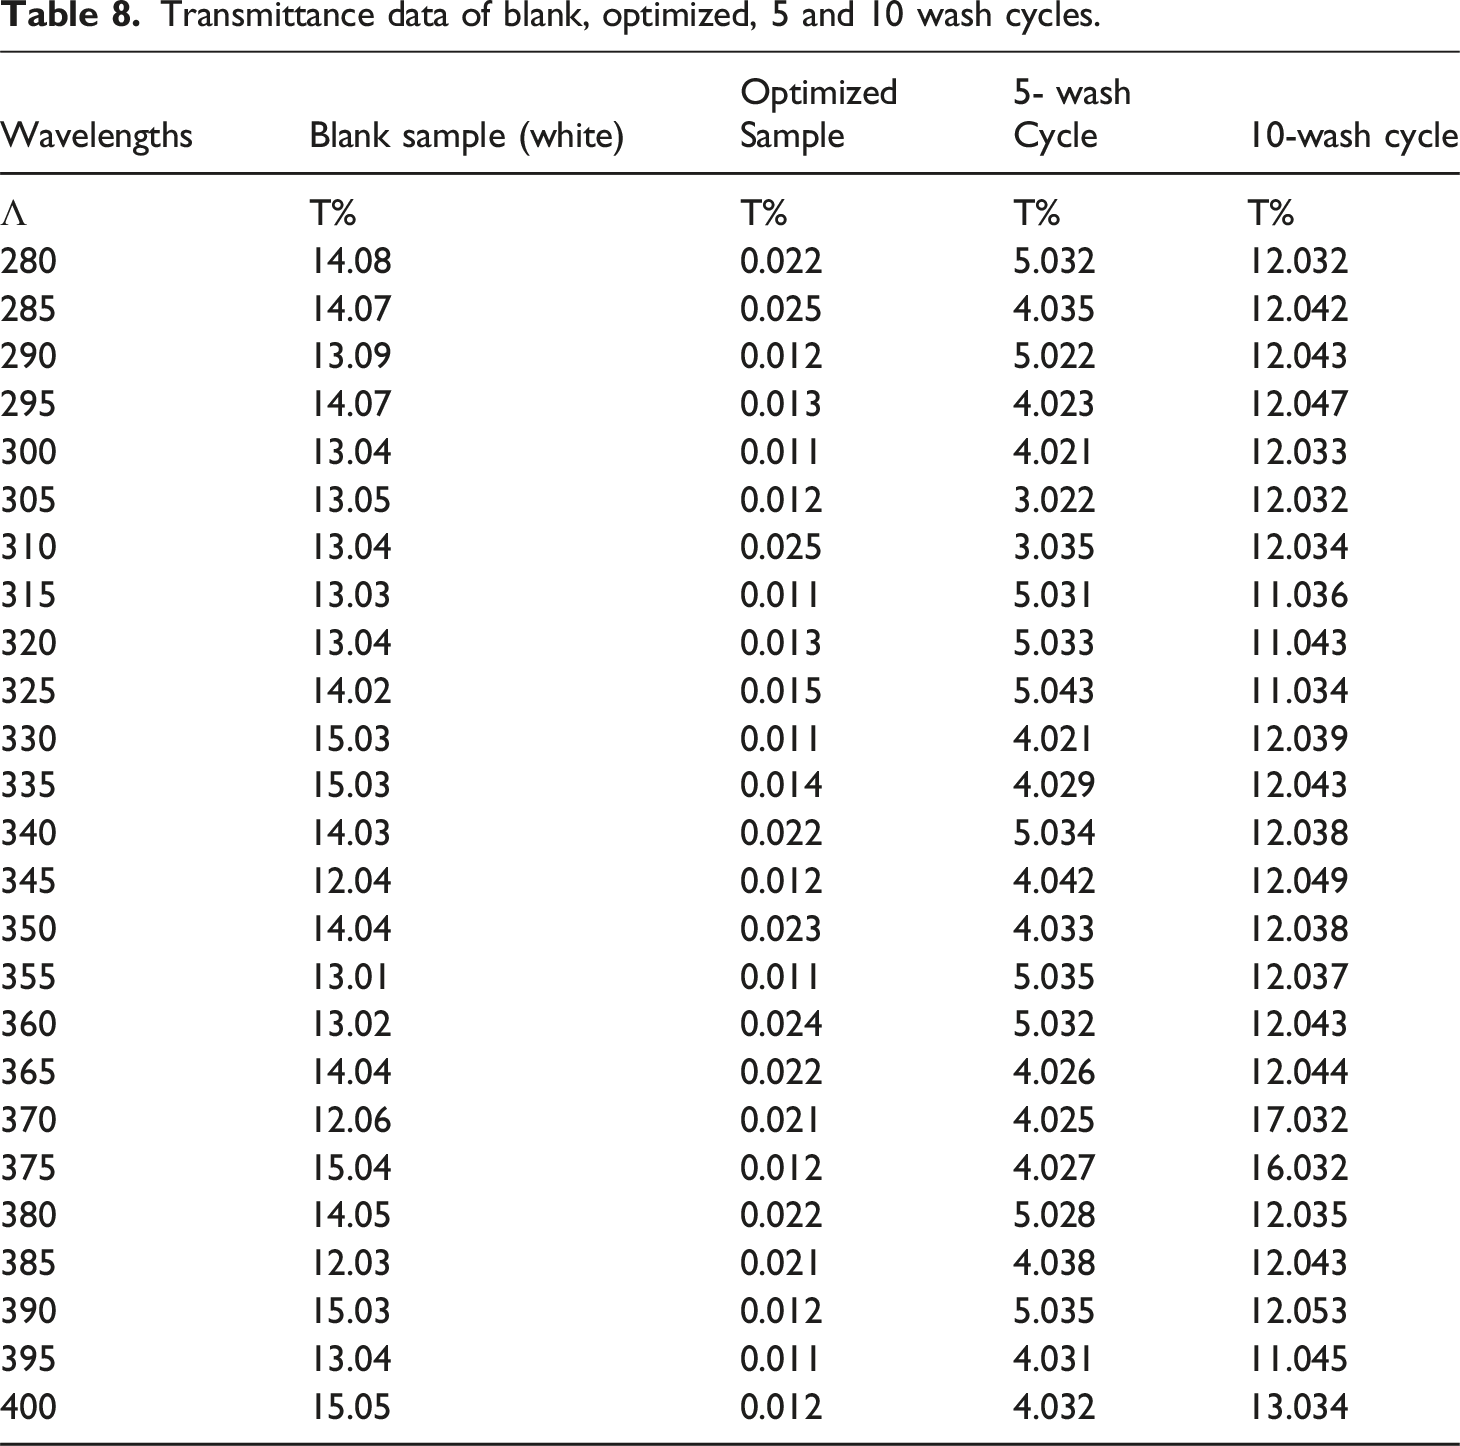
Result for transmittance of blank, optimized, and washed sample
Transmittance data of blank, optimized, 5 and 10 wash cycles.
Testing and evaluation of the treated samples
Wash durability
Wash fastness for antimicrobials and %blocking of UV test.

UVR after 10 washes is poor in the rating category, as shown in Table 12, because the treated active agents were removed due to repeated washing. As per the study of, 68 the optimized UVR for phenolic compounds obtained from plant extract was 98.3%, which is categorized in the excellent rating category. Also, CuO NPs have the highest ultraviolet radiation protection compared with the other metal nanoparticles. 69 This implies the UVR and antimicrobial activity of the treated cotton fabric show high before washing but decreases in activity after 5 and 10 wash cycles.
Tensile strength
Tensile strength test.
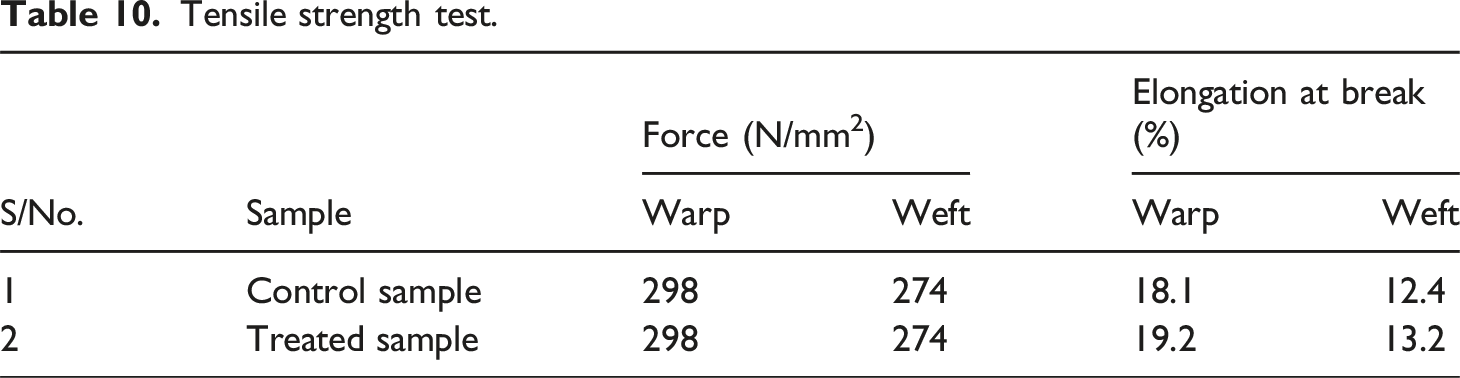
Elongation at the break of the treated sample was increased due to the deposition of phenolic compounds and copper oxide nanoparticles on cotton fabric, as shown in Table 10. In addition, both phenolic compounds and copper oxide nanoparticles act as reinforcement agents and enhance interactions between fibers with hydrogen bonds.
Fabric stiffness testing
Stiffness test.

Therefore, from Table 11, the result shows that the bending length of the treated sample was greater than that of the control sample. It suggests that the finishing agents are responsible for increasing stiffness.
Air permeability
Air permeability test.

Conclusion and future work
Conclusion
In conclusion, cotton fabric was functionalized based on the two active agents (phenolic compounds and CuO NPs). Crude Azolla nilotica algae extract has been used to get the intended phenolic compounds using a hexane liquid-liquid separation technique. From 10 g of Azolla nilotica Algae powder, 3.1 g of polar compounds were obtained after the separation of polar from nonpolar compounds, and the percentage yield was 31%. Then, green synthesis of copper oxide nanoparticles was done following the preparation of the extract, as a result, the percentage yield of copper oxide nanoparticles was 71.1% among 7.98 g of copper sulfate with an actual yield of 5.67 g CuO NPs. Finally, optimization was done by treating cotton fabric with these two active agents. The optimum results obtained were gram-negative bacteria with a zone of inhibition of 27.625 mm, gram-positive bacteria with a zone of inhibition of 23.88 mm, and percent blocking of ultraviolet radiation 99.99%.
Future work
In the global textile and apparel sector, cotton is the most extensively used natural fiber. It has a distinct advantage over other materials in a variety of textile and apparel applications. Although it has distinct advantages, it also has some limitations. To make cotton fabric ideal for the wearer, this research used a combination of the two active agents to develop multifunctional finished cotton fabric. Therefore, the following points are promising actions that were not addressed in this research work. • Active agents used for multifunctional finishing processes also impart functional properties such as, self-cleaning, electrical conductivity for copper oxide nanoparticles and antiviral activity and fire retardancy properties. • Exploring the combination of phenolic compounds with other nanoparticles like TiO2 or ZnO could also lead to synergistic effects and further enhance the functional properties of the treated cotton fabric. • Knowing and determining the number of phytochemical components quantitatively in Azolla notice algae extract is needed for further investigation. • During the synergetic combination of copper oxide nanoparticles and phenolic compound of Azolla nylotica algae extract there is no use of any cross-linking agent in this research work, this needs further improvement. • In this research, we use hexane for the removal of non-polar compounds from crude extract to get the polar compounds. On the other hand, it is possible to separate polar compounds from crude extracts using ethanol’s with the principles of like dissolves like.
Footnotes
Author contribution
All authors listed have significantly contributed to the development and the writing of this article review.
Declaration of conflicting interests
The author(s) declared no potential conflicts of interest with respect to the research, authorship, and/or publication of this article.
Funding
The author(s) received no financial support for the research, authorship, and/or publication of this article.