
Abstract
Centrifugal spinning is an increasingly popular and viable method to produce fibers of different compositions. However, there are still aspects to investigate and improve in the centrifugal spinning process, such as optimizing the fiber yield and obtaining defect-free fiber morphology. To address this gap, the effects of the collectors on the fiber yield and their morphology were investigated in this work. An aqueous solution with 18 wt% of PVP and two needles (18G and 21G) with different diameters and three different spinning speeds (5000, 7000, and 9000 RPM) were used to explore a set of fiber collectors with various collector spacing (1, 3, 6, 12, and 18 cm distance between the collectors’ bars). The results of the experiments showed that fiber collectors affect the yield of the process and the fiber morphology to some (non-negligible) extent. Denser collectors enabled higher yield, thus reducing the waste, and positively affecting the beading of fibers. The knowledge obtained in this work about the influence of collectors on the centrifugal processing of basic polymers can be with an advantage applied to the processing of different polymers and needles used within the centrifugal spinning process.
Introduction
Fibers are among the materials that have been gaining increasing interest and industrial utilization in recent years. A fiber can be defined as a structure with a significantly small diameter, from dozens of nanometers to a few micrometers, compared to its length. Although fiber properties depend on the particular production method, material, and process parameters; nanofibers (NFs) have a high surface area to volume ratio, open porous structure, and relatively good mechanical properties.1,2 They are a feasible or good alternative to currently used materials in many areas such as tissue engineering,3–5 filtration,6–8 wound dressing,9–11 drug delivery,12–14 energy storage and fuel cells,15–19 catalyst20,21 just to name a few. Moreover, there are more areas where NFs might be applicable after further research. These areas can include protective clothing, various applications in biotechnology, the packaging industry, aerospace, etc.
Fibrous materials can be produced from many different materials. For instance, synthetic and natural polymers are widely used materials to produce fibers. These polymers include poly (vinyl alcohol), poly (ethylene oxide), 22 poly (3-hydroxybutyrate), 23 poly (methyl methacrylate), poly (L-lactic acid), poly (acrylonitrile), poly (carbonates), polystyrene, poly (ethylene terephthalate), poly (vinyl pyrrolidone ) 24 etc. However, the production of fibers is not limited just to polymeric materials. Composites, 25 metal, 26 and ceramic fibers20,27 can also be produced fibers, either directly by centrifugal spinning followed by calcination or advanced post-processing techniques, such as Atomic Layer Deposition 28 or thermal evaporation. 29
The first mention of fibers and their production methods appeared in the scientific literature more than a hundred years ago. 30 However, it was only over the past two decades, that the research conducted on these materials increased drastically.24,31 As a result, different techniques to produce NFs have been investigated and studied in detail. For example, electrospinning, 24 self-assembly, 32 and template-based synthesis 33 are well-known methods and are currently used in nanofiber development. On the other hand, some methods are relatively new and still under development. These methods include centrifugal spinning, solution blow spinning, plasma-induced synthesis, etc. 1 Among all those NF production methods, electrospinning is the most popular one and most of the research papers are based on it. However, electrospinning has inherent drawbacks, such as the need for a conductive solution and high electrical voltage applied, low production rate in general, etc. 34 Therefore, to overcome the disadvantages of electrospinning, a robust nanofiber production technique alternative to electrospinning must be adopted.
As an alternative to electrospinning, centrifugal spinning (CS) has gained interest in the recent decade.35–40 Owing to its principle, it has an intrinsically rather high production rate, it does not require any voltage applied and offers to produce a wide range of materials. During the CS process, the desired material (e.g., polymer solution) is put or fed into the reservoir, which is an inherent part of the spinneret, where the material to be spun is placed before and during the spinning process. This reservoir has orifices or is connected to needles through canals of small diameter. An electrically driven rotor rotates the whole spinneret at a very high speed (typically thousands of revolutions per minute). As a result, the stored solution or melt in the reservoir strongly flows under the effect of centrifugal force and gets ejected from the orifice or needle, while forming fibers. These travel towards the collectors while losing quickly the solvent used, and they get collected there. The centrifugal force, which drives the CS process and the formation of nanofibers, also might cause spun fibers to flow around collectors and become a waste inside of the CS chamber, rather than the desired product. This has a negative influence on the overall yield and costs of the process.36–40
In general, the CS has an intrinsically higher production rate with reported values of 30-50 g/h4,34,41,42 compared to electrospinning (0.01-1 g/h).41–43 However, one has to consider these values carefully, as they largely depend on the design of spinning heads, number of nozzles, design of electrodes (electrospinning), collectors (both techniques), etc. However, there is further room to upscale both technologies, which would allow fiber mass production and subsequent commercialization. 44 CS has already been used also industrially to produce fibers from various materials and for various applications 34 In addition, its theoretical and physical working principles have been investigated44–46 and described in detail.
The effect of spinning parameters such as viscosity, humidity, chamber temperature, spinning speed, collector distance, and needle gauge (nozzle diameter) on collected fiber diameter and morphology in the centrifugal spinning method have been investigated.34,36–40,47–50 Even though these are very essential and informative studies, to the best of the authors’ knowledge, efforts towards an optimization of the processes in terms of efficient fiber collections (i.e., with a minimal loss in the chamber caused by fibers placed not on collectors) have not been undertaken yet. Nevertheless, an efficient collection of spun fibrous materials by collectors is a very important feature for the ergonomic and economic process in the first place. To address this gap, we exploit in this paper the effect of different types of collectors on the fiber yield (collection efficiency) and morphology. To provide a complex set of valuable results, two different needles (18G and 21G) with different diameters and different spinning speeds (5000, 7000, and 9000 RPM) were used to explore a set of fiber collectors with different collector spacing (1,3,6, 12, and 18 cm) for the centrifugal spinning of aqueous PVP solutions. It is believed that the here presented findings and results are illustrative and representative also for other polymers and materials to be processed into fibers by CS.
Experimental
Materials
Polyvinylpyrrolidone (PVP) K90 with a molecular weight of ≈360,000 g.mol−1 was purchased from Sigma Aldrich. Distilled water was used as a solvent and 18 wt% PVP solution was prepared for all experiments. For the centrifugal spinning experiments, needles with lengths of 55 mm and different gauges were used; 18G and 21G with inner diameters of 0.8 mm, and 0.5 mm respectively. They were purchased from B. Braun Melsungen AG. The diameters of the used needles were checked with an optical microscope (Zeiss Stemi 508) and are shown in Figure 1. Photographs, optical (cross-sectional) images and SEM images of needles used for the centrifugal spinning process; 18G (a, c, e), 21G (b, d, f).
Design and preparation of collectors
Computer-aided design (CAD) was used to create 3D models of the collector used in this work. Collectors were designed via SolidWorks (Dassault Systèmes SolidWorks Corporation) software and firstly CAD models were generated. Subsequently, these models were converted to stereolithography (STL) files by using the same software. STL files were converted to G-code via PrusaSlicer. Then G-codes were used to create ready-to-use collectors via a fused deposition modeling technique on the 3D printer (TRILAB DeltiQ). Five different sets of collectors were prepared with different distances between their collector bars. For the sake of clarity, we introduce the different term collector spacing, which will be further used in this paper. These values do represent the real distance from one round edge of the bar to another, not the distance between the geometrical centers of the bars, as shown in Figure 2. The spacing used here was 1, 3, 6, 12, and 18 cm for each collector set. All collectors are detachable and lightweight, which enables their easy handling. Schematic representation of the centrifugal spinning chamber and collector used in this work.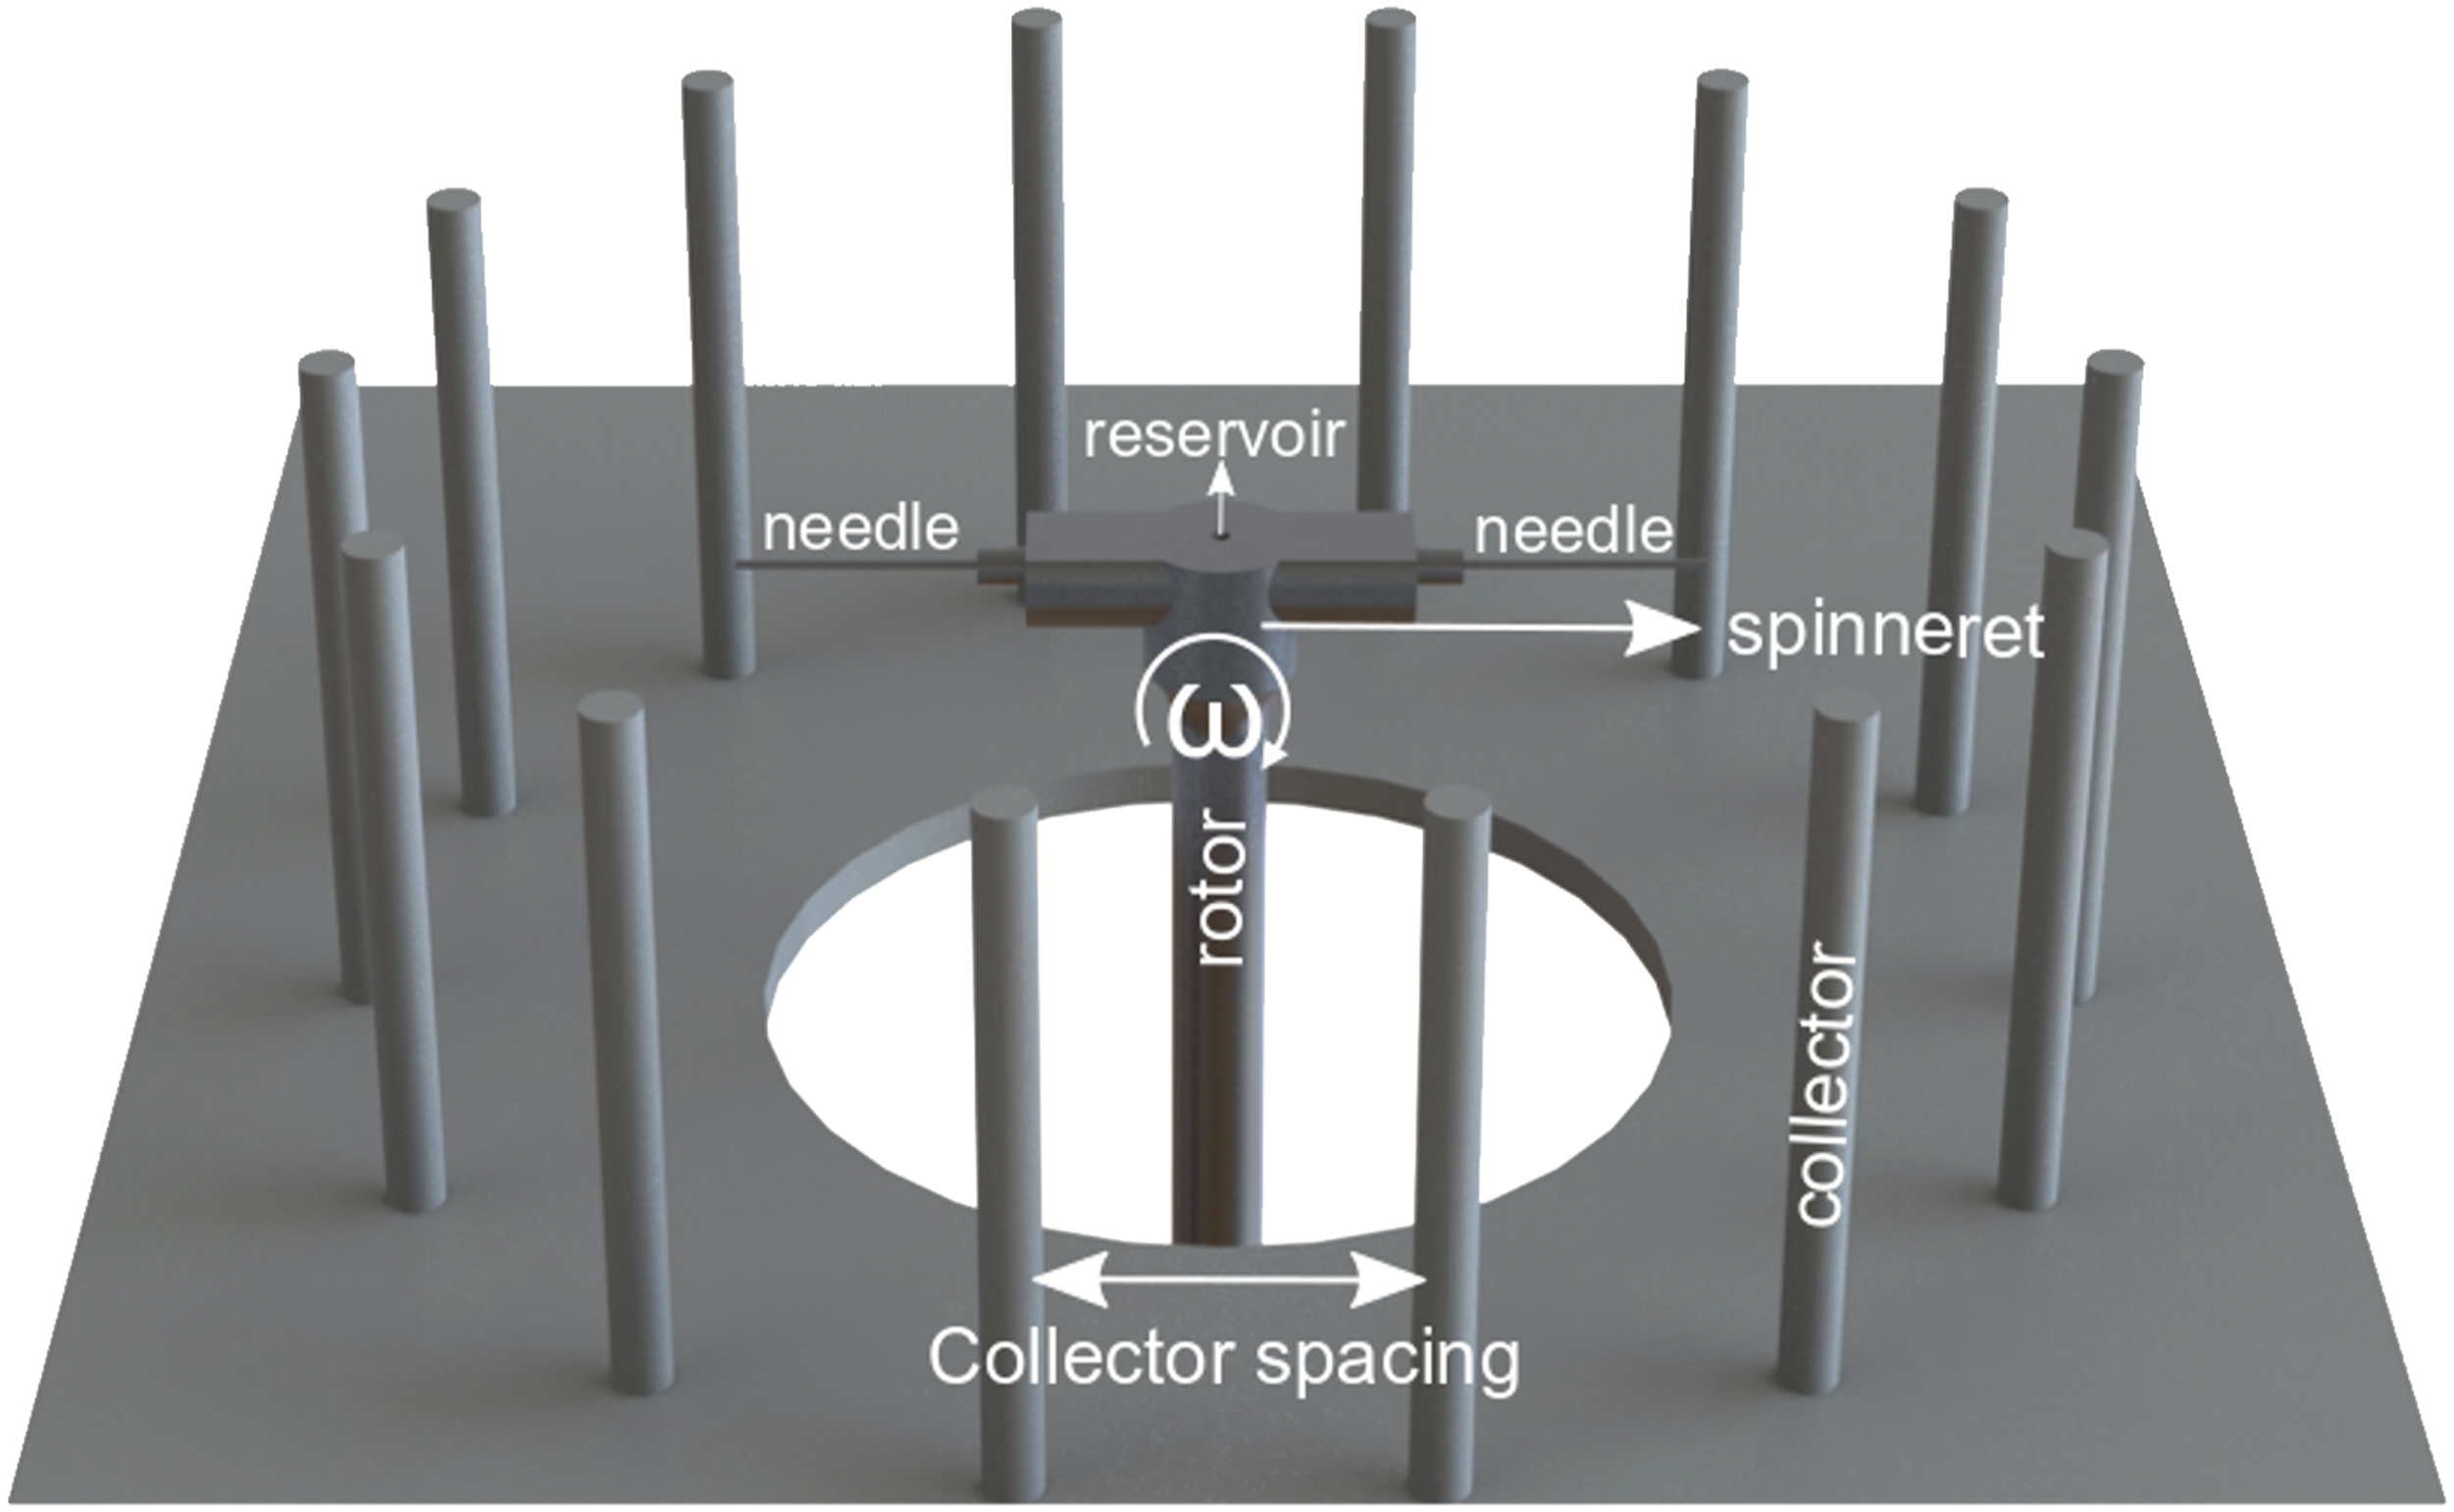
Production of fibers
Each collector was placed in a CS chamber around the spinneret and centered to the spinneret. PVP solution was fed into a spinneret reservoir (shown in Figure 2) with a syringe. The main process part can be described as follows: while the spinning solution is ejected from the needle under the influence of centrifugal force and forms a jet, the jet elongates and travels to the collectors while the solvent evaporates. As a result, fibers are generated.
The distance from the needle tip to the collector was set to approximately 10 cm for all experiments. Experiments were performed under a narrow range of the temperature and the relative humidity (RH): between 36.5 and 40°C and 15 to 20% RH, respectively to minimize the effect of varying temperature and RH. In the experiments, different operating speeds (also used as rotational speed in the literature) were used: 5000, 7000, and 9000 revolutions per minute (rpm). When the rotor is switched on, the process starts from a stationary position and the spinneret reaches the desired rpm within a few seconds. For the main spinning experiments, Cyclone Pilot G2 (Pardam, Czech Republic) fiber production tool was used. As previously mentioned, hypodermic needles were used to spin fibers instead of high-volume multiple-orifice spinneret for the sake of simplicity in experiments and measurements. In this tool, the spinning process is accomplished in a closed chamber where RH and temperature are monitored. Since the chamber is connected to the air conditioning device, RH and temperature can be also controlled very precisely. Therefore, the CS process can be conducted under the desired conditions, regardless of the ambient conditions and season of the year.
Measurement of fiber yield
To determine the fiber yield for each particular experiment, two conditions were fulfilled. The first one was that we used for each particular test PVP solution with the same volume of 1 mL (which corresponds to ∼1.02 g) and spun it until the entire volume of the solution was ejected. Second, to assess, how much of the fiber mass was collected by collectors after spinning the entire volume of the solution, the weight of the collector sets (for all tested collector spacings) was precisely measured with a laboratory balance before and after the spinning process to determine their mass. Since the 3D-printed collector bars were detachable from their base and lightweight, the measurements could give the mass of the fiber that spun on collectors. Firstly, preferred collector sets were measured inside a clean beaker with balance. After the spinning process, collector bars were collected with the fibers spun on and around them and put into the same beaker to be measured again. The differences between the first and second measurements give the average mass of fibers collected. After the initial mass measurements of all the experiments, experiments were iterated twice for statistics, and the measurements were done in the same way. All handling of collectors and beakers was done carefully to prevent any contamination (gloves were used) and losses. After each particular mass measurement was done, the corresponding collector and beakers were cleaned thoroughly. For each measurement, a new set of collectors and beakers was used. Fiber samples were collected with a metal tweezer and stored in zip bags to prevent any contamination before their characterization.
Airflow measurement in the chamber
Airflow analysis was performed with a Flowmeter (Greisinger electronic, GMH3330, 0.55-20.00 m/s) at nine different positions in total, as depicted in Figure 3. Three different flowmeter positions were used on the horizontal (x) scale: I. Outside collectors (at a distance of 5 cm from the collectors), II. Center (at the same position as the collectors, i.e. between individual collector bars), and III. Inside (in the center of the distance between the collectors and the needle tips, approximately 5 cm from the collector bar). Vertically (y-axis), there were also three different flowmeter positions including 1. Top (5 cm above needles level), 2. Middle (at the level of needles), and 3. Bottom (5 cm below needles). At the same time, three different directions of air flow were analyzed, as marked in Figure 3: UP (airflow direction from bottom to top of the chamber), OUT (direction from the axis of rotation outward to the walls of the apparatus) and CIRC (in the direction of spinneret rotation) at three different spinning speeds (5000, 7000, and 9000 RPM), with five different collectors spacing (1, 3, 6, 12, and 18 cm). The schematic illustration of the airflow measurements is shown in Figure 3. Schematic illustration of the exploited flowmeter positions and airflow regimes.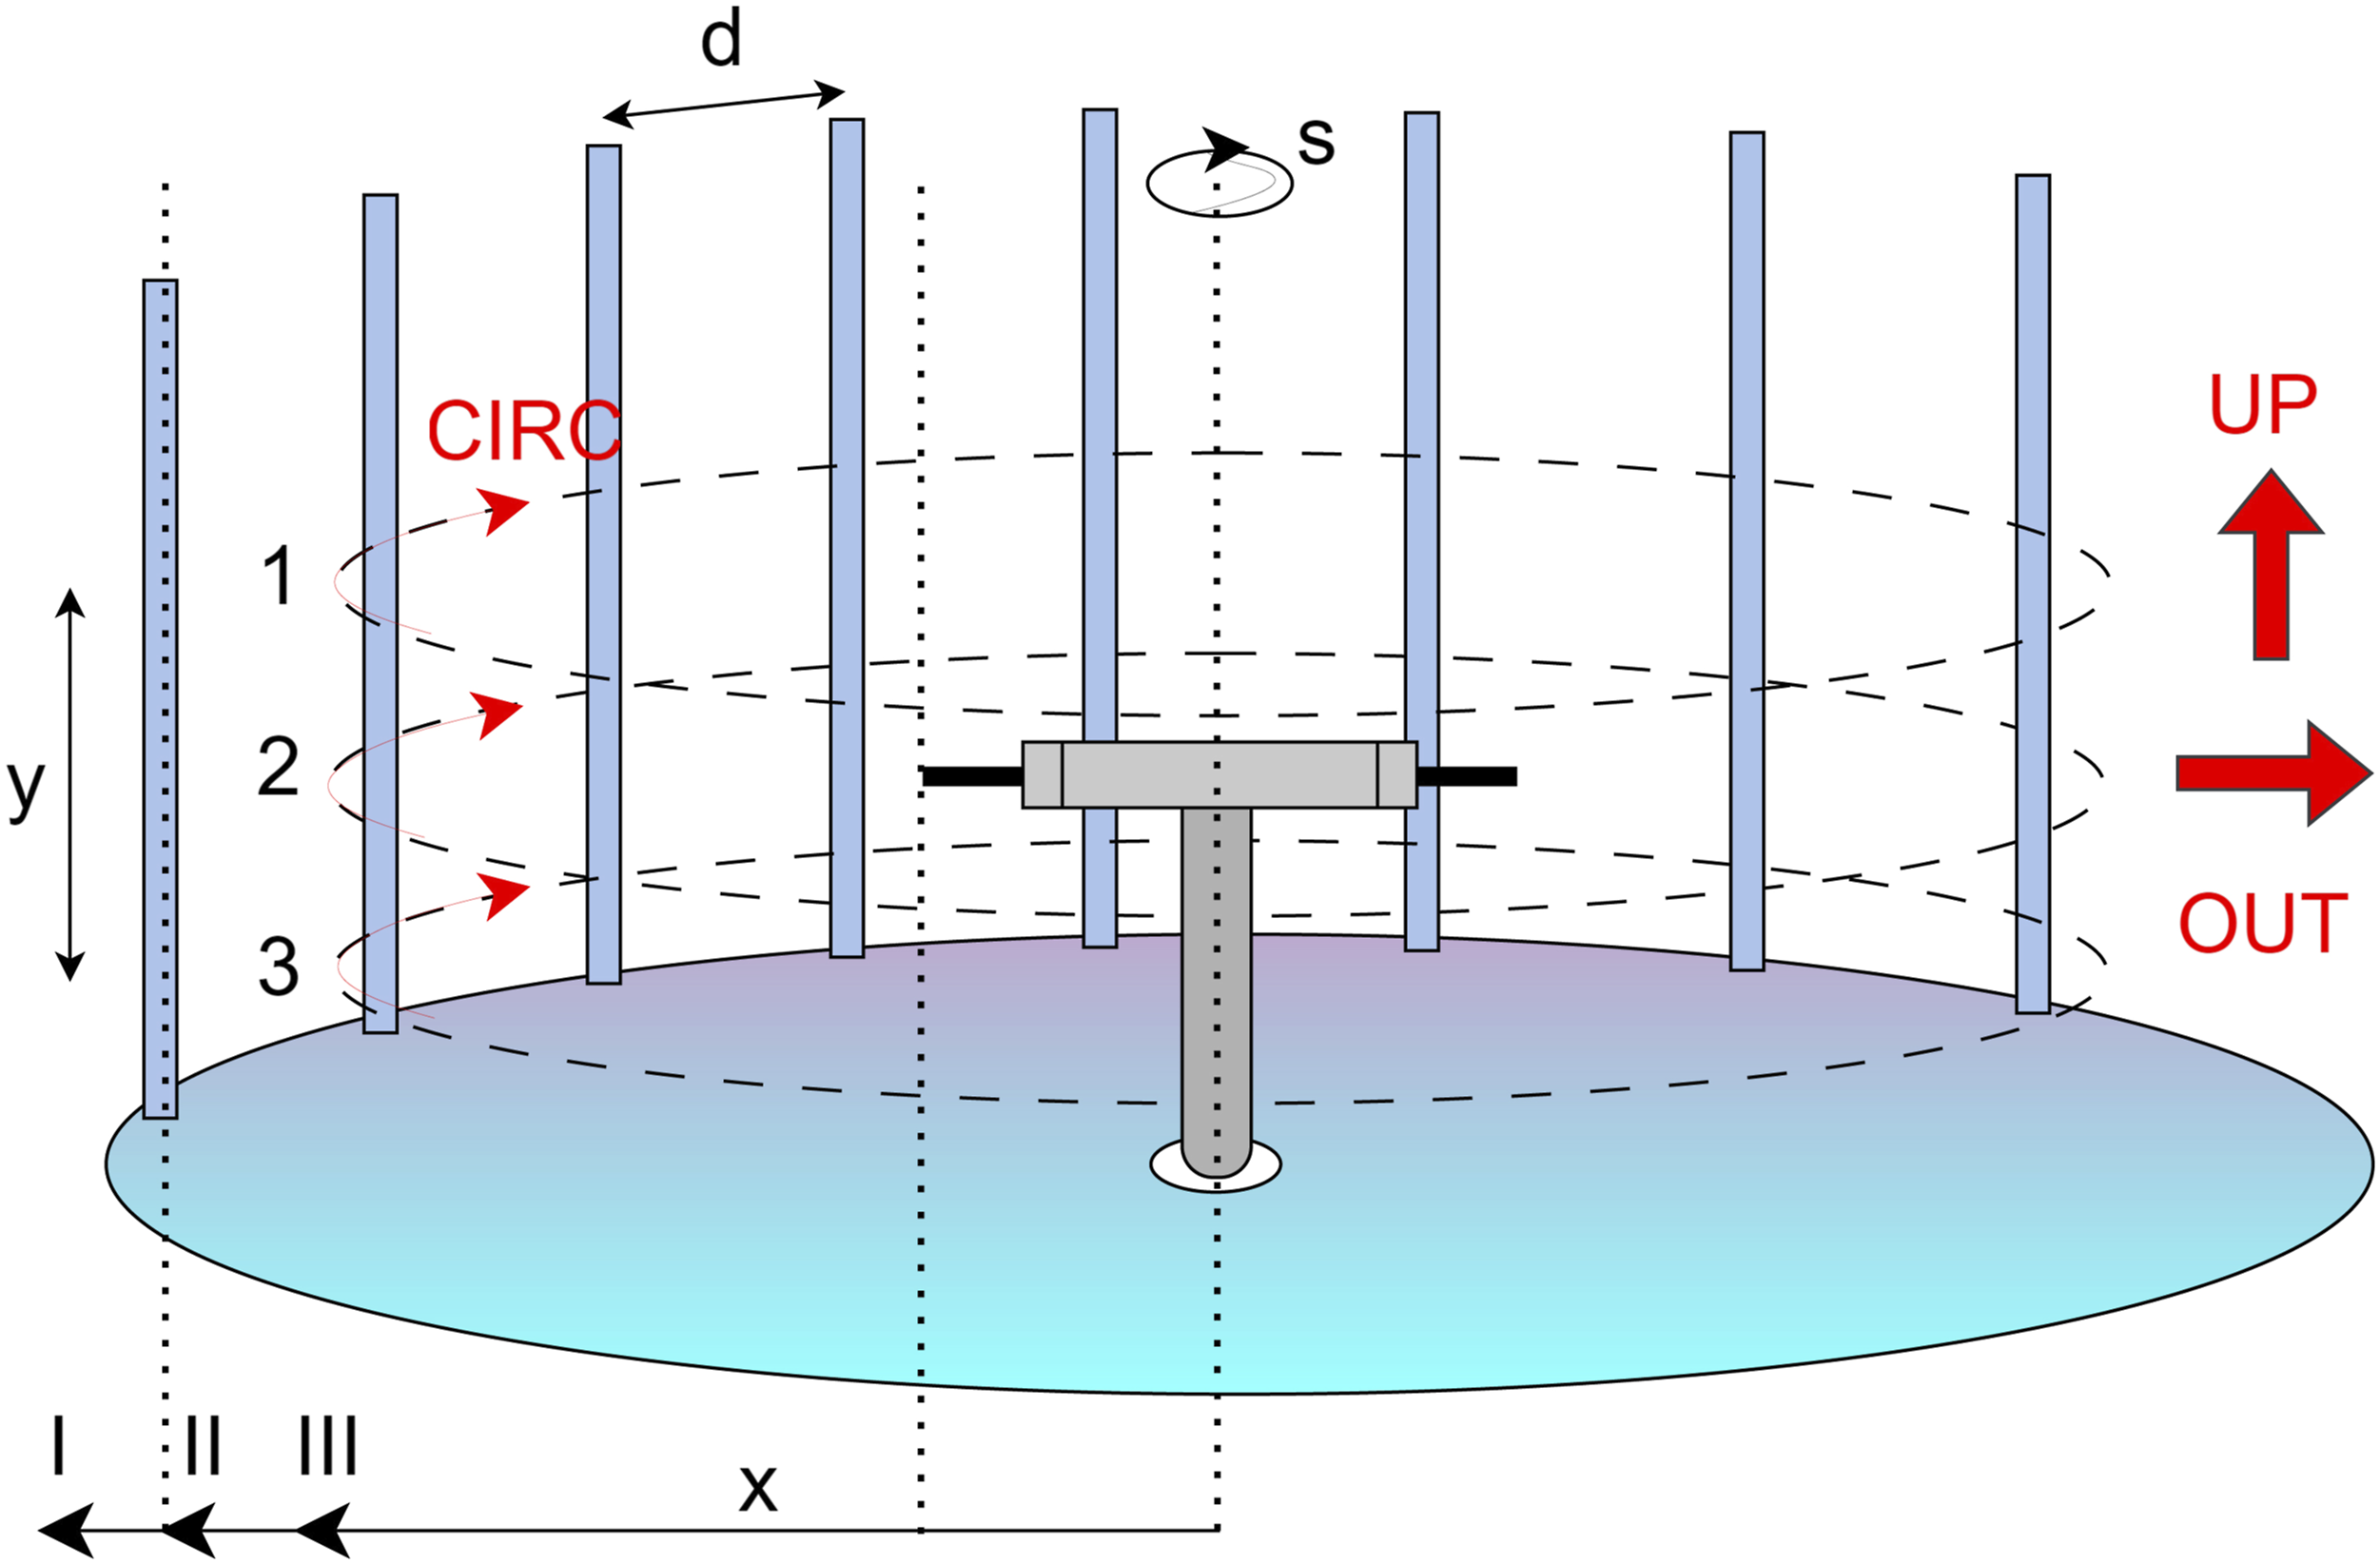
Characterization of fibers
A scanning electron microscope (SEM, MIRA3-XMU, Tescan) was used to investigate the morphology and diameter of fibers. Before SEM operation, samples were sputter coated with thin layers of carbon to facilitate good observation (Leica EM ACE600). The fiber diameters were analyzed with NanoMeasure42 software. To obtain an average (mean) fiber diameter, at least 30 measurements were made for each sample.
Results and discussion
Effect of the collector density on the fiber yield
Figure 4 shows the fiber yield of the PVP fibers that were spun with two needles and subsequently collected by different sets of collectors under different rotational speeds. As one can see, the standard deviation (SD) of the means was plotted along with the mean values. SD of the mean varied between 5 % and 20 % for all measurements. The two densest collectors (i.e. 1 and 3 cm) were in general able to collect most fibers compared to other sets, and the champion set varied between rotational speeds and needle sizes. Fiber yield of 18 wt% PVP solution; (a) 18G needle, and (b) 21G needle. Error bars represent the standard deviation of the mean.
Another outcome that can be seen from Figure 4 is that there are differences between the fiber yield for both needle sizes, even though rotations and distances were kept the same. Those differences were mainly caused by the bead generation. Instead of the elongation and solvent evaporation, beads might be formed and stick to the formed fibers or collectors. More attention to beads is given in Fiber morphology section.
Last, but not least, for some datasets shown in Figure 4 for low spinning speeds, the fiber yield exceeds 0.18 g, which is the maximum amount of polymer in the solution (18 wt% PVP). The explanation for this phenomenon is that with decreasing the spinning speed, airflow decreases (Figure 5) and the resulting fibers are not fully dry due to the low airflow (i.e. they still contain some residues of the solvent (water) that did not have time to dry before weighing). Conversely, at higher spinning speeds, the increased airflow dries the synthesized fibers more effectively, leading to a fiber yield of less than 0.18 g. All in all, these data and fiber yield measurements show that denser collectors provide higher fiber yield, which has also positive consequences on the lower amount of starting material wasted in the spinning chamber, that is not collected on collectors. This means that part of the polymeric material (either in the form of droplets or fibers) passes through the collectors within the first moments of the process and adheres to the walls of the spinning chamber. They can be only removed via a rather tedious cleaning procedure. However, even though this is mostly happening in the higher collector spacing, it is just a question of the very first moments (a few seconds of the process), because the fibers placed at collectors create a fiber net, that does not let other incoming fibers flow through. 3D illustration of experimental flowmeter results for different collectors spacing: (a) 1 cm, (b) 3 cm, (c) 6 cm, (d) 12 cm, and (e) 18 cm.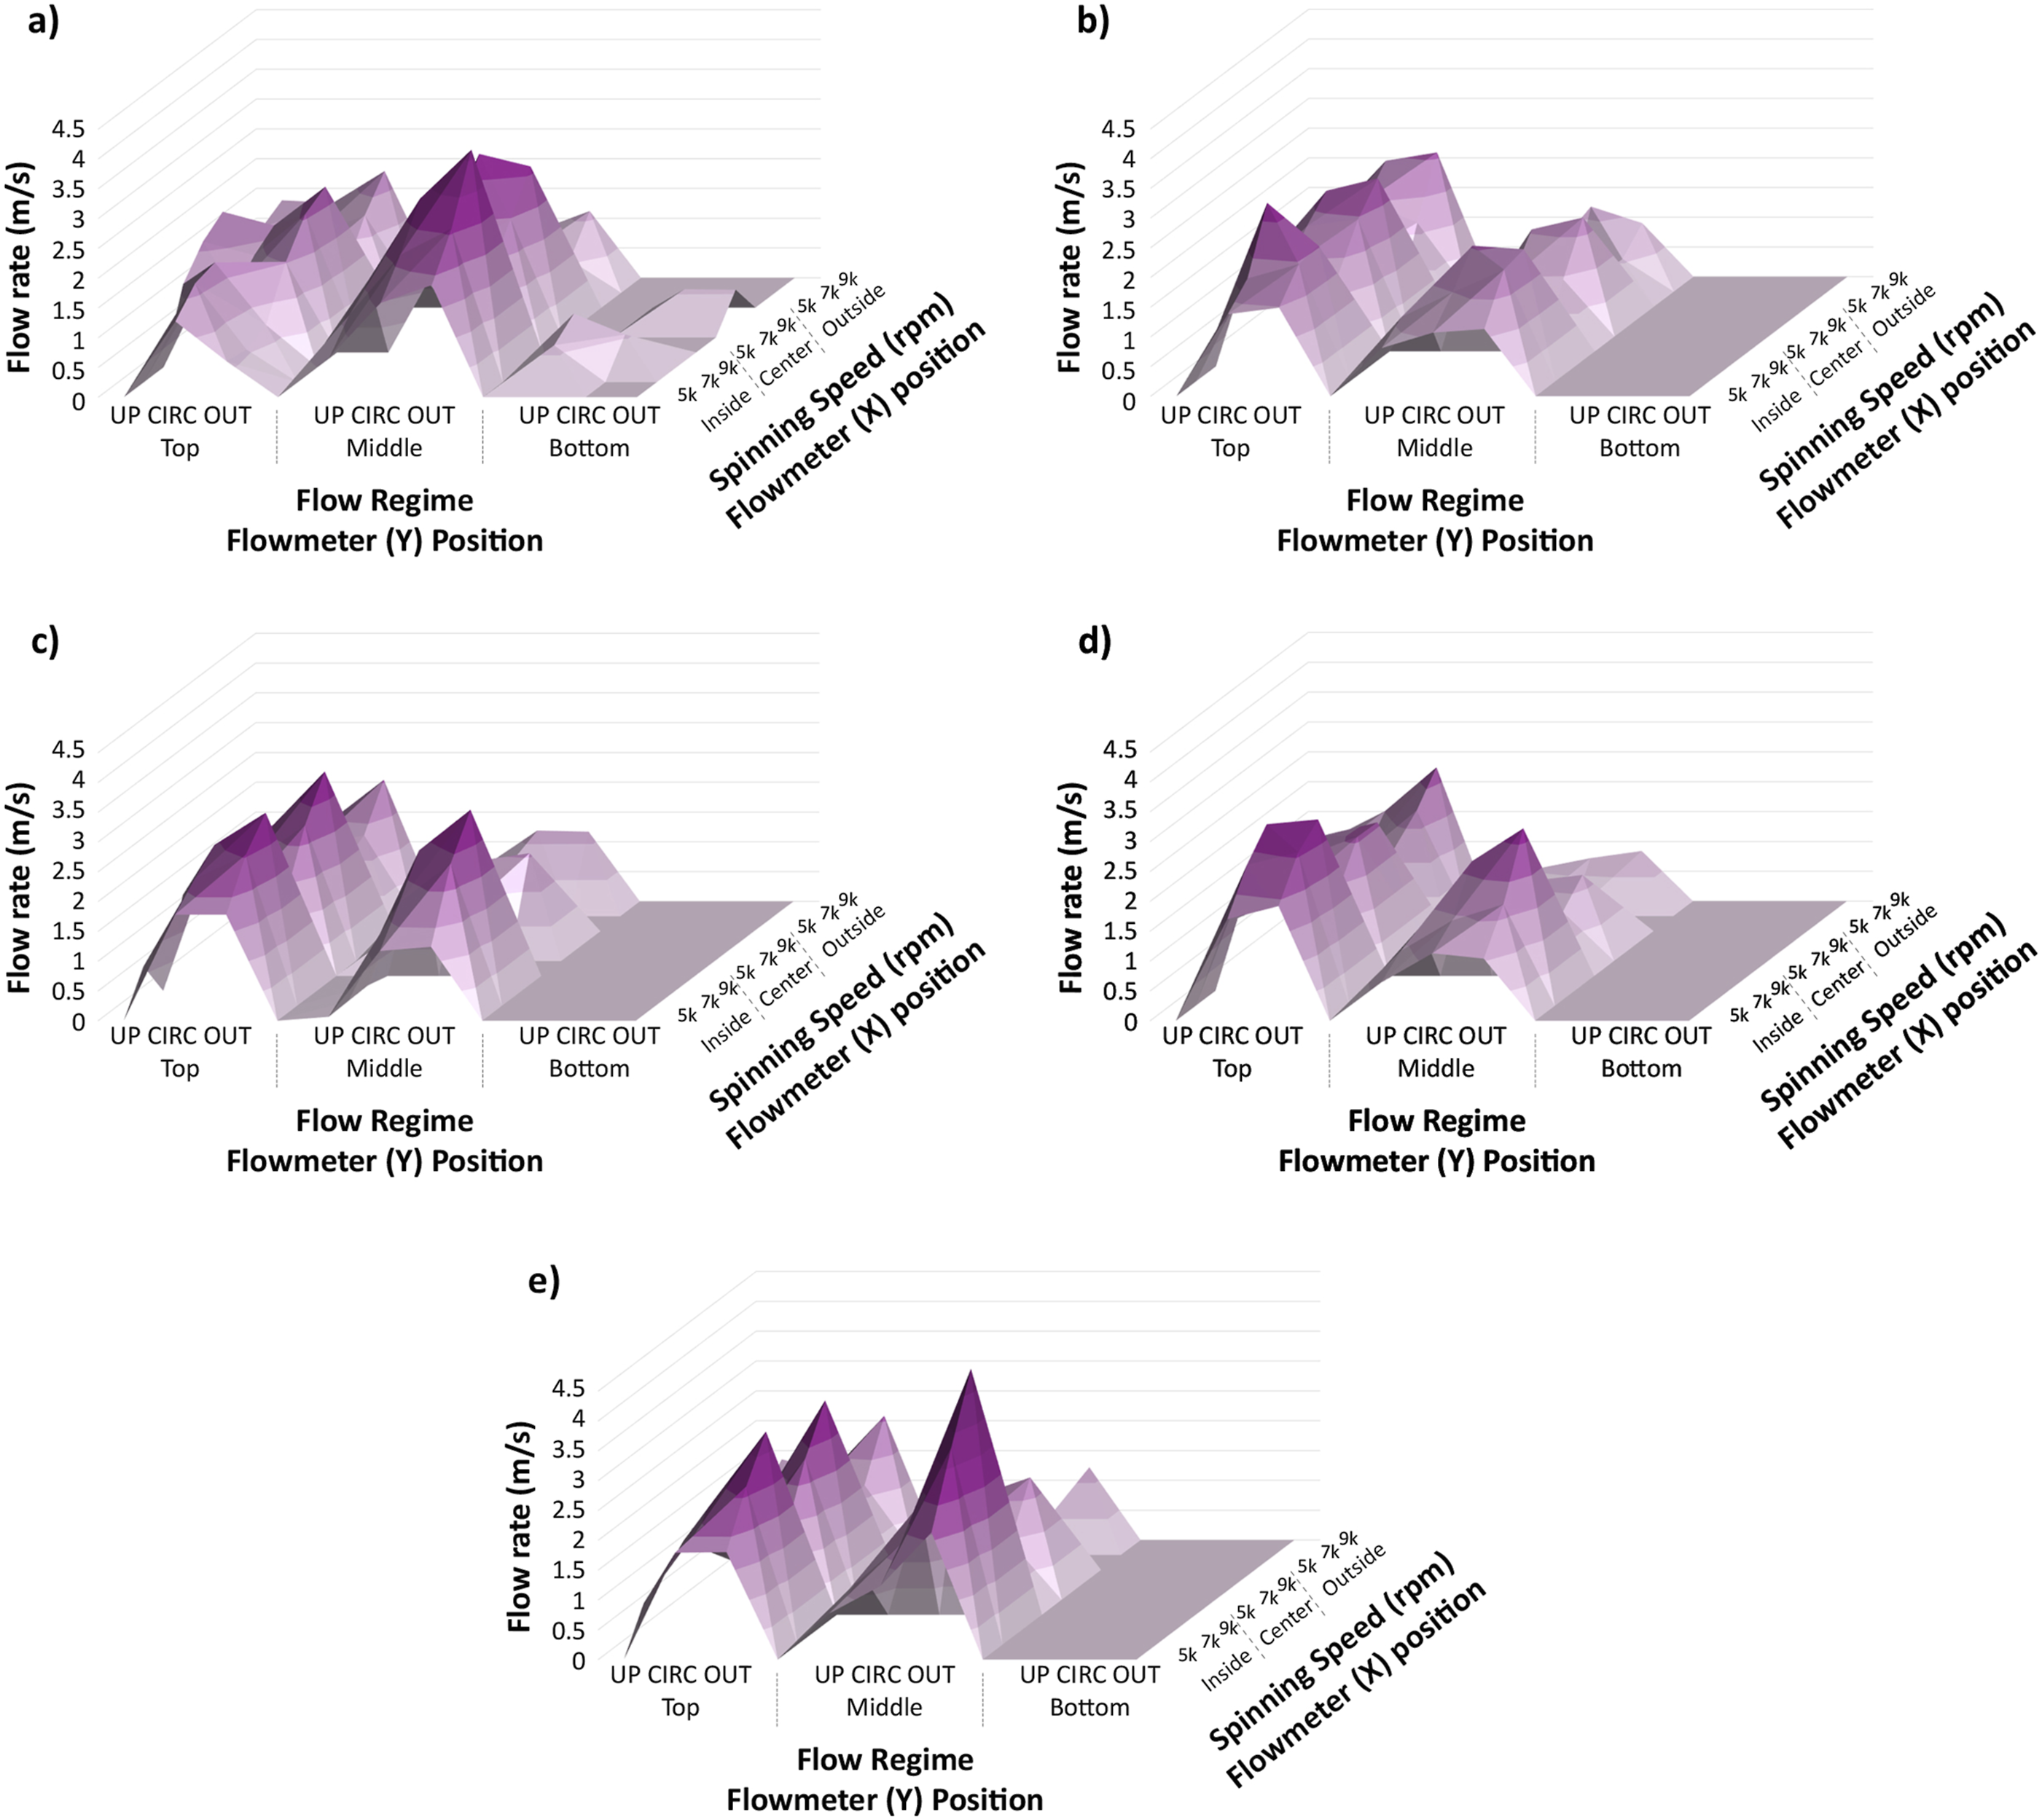
Effect of the airflow in the chamber on the fiber collection
An extensive set of airflow measurements was carried out at different locations of the spinning chamber, as described in the Experimental part and depicted in Figure 3. Same conditions were employed in this set as for the fiber collection experiment, but due to the prevention of damage of the expensive flowmeter, all airflow measurements were conducted with the spinneret rotation, but without the polymeric solution (i.e. no fibers were born). The obtained results are summarized in Figure 5. As can be seen, flow rates in the chamber strongly vary, depending on the position, spinning speed, and different collector spacing. The results of experiments show that the airflow at the bottom of the chamber is much lower (in fact negligible) than at other, more elevated sections. In addition, the airflow increases with increasing the spinning speed at all positions and for all collector spacings. In the densest collector spacing (i.e. 1 cm) and the least dense collector spacing (i.e. 18 cm), the airflow in the middle of the collectors is stronger than the top position, but for other collector spacing (i.e. from 3 cm to 12 cm), it is vice versa. In any case, the differences in the airflow indicate strongly turbulent and location-dependent airflow. It is also apparent from Figure 5 that with increasing the spinning speed, the flow rate increases on top of the collectors, which leads to the pronounced fly-off effect of fibers from the top of the collectors away, thus decreasing the overall fiber yield (= amount of fiber deposited on the collectors). The collection of fibers on the collectors can be explained by considering the flow regime effect, in which the flow rate of the inside-out regime is slightly higher than the circulation regime. In addition, the bottom-up regime always had the lowest flow rate, and the flow rate outside of the collectors increases with increasing the collector spacing in the same flow regime and spinning speeds. It is noteworthy, that there is an airflow on the bottom of the chamber in the case of densest collectors (1 cm, Figure 5(a)) for low rotational speeds that is not seen in other collectors’ spacings and conditions. By visual inspection of the chamber´s bottom after this collector was used in the real spinning experiments with 5000 RPM (all cases), and 7000 RPM (some cases), it was found that some fibers are captured on the bottom of the chamber. This is why we got for this densest collector spacing slightly smaller fiber yield, compared to e.g. 3 cm distances, as shown in Figure 4. When comparing the outcomes of Figures 4 and 5, we conclude that denser collectors catch more fibers due to the preventing of air from going outside of the collectors.
Effect of the collector spacing on the fiber diameter
Fiber diameters were analyzed for fibers obtained from all the above-described experiments to investigate the differences concerning process parameters, mainly in the collector spacing. In general, the fiber diameter depends on the intrinsic properties of the spinning solution (such as molecular weight, molar concentration, and viscosity) as well as process parameters (such as temperature, relative humidity, rotational speed, collector spacing, distance between collector and needle tip and needle/orifice gauge, etc.).35,51 However, not all parameters have the same degree of influence.
The viscosity of the polymeric solution plays a large role in the fiber diameter, as we demonstrated previously. 51 However, in this work, we used intentionally one type of polymer with one concentration (which was previously found optimal = 18 wt % PVP 51 ), so we do not focus on this parameter. Instead, we wanted to focus on other major parameters, that likely play the largest role in the given design of the spinneret and the outlined set of experiments with different collectors. They include: (i) collector spacing, (ii) needle diameter, and (iii) rotational speed. These parameters are also frequently discussed in the literature,34,36,47–49,52,53 though not in such a complex manner and width, as presented herein. To see the trends among them, a complex set of CS processes was conducted with one parameter always fixed, while the other parameters were extensively varied.
In the following text, attention is given to a detailed presentation and discussion of the influence of major parameters on the fiber diameters. Figure 6 shows a complex dependence of the PVP fibers’ diameters on the rotational speed and the collector spacing. For fibers produced at 5000 RPM via both needles, larger collector spacing resulted in a slightly smaller diameter. However, at 7000 RPM and 9000 RPM, this trend was not observed. If collector spacing was not taken into consideration and the overall fiber diameter was investigated for rotational speed; the mean fiber diameter slightly decreased when the rotational speed increased, except for fibers produced at 9000 RPM using the 21G needle. Overall, the fiber diameters were nearly the same for both the 18G and 21G needles. Statistical evaluation of fiber diameters for PVP via (a) 18G needle, and (b) 21G needle.
We cross-checked all data sets against each other and calculated the correlation coefficient on the significance level of 95% for each compared set. We found that there are different levels of correlations between different parameters (data sets). Table S2 gives an overview of all correlations. Based on these analyses, meaningful correlations are: (i) collector spacing versus fiber field, which has the highest correlation coefficient and means that there is a strongly negative correlation between the collector spacing and the fiber yield. The smaller the spacing, the higher the yield; (ii) fiber yield versus fiber diameter are related together with a moderate positive correlation which means fiber diameter increases with increasing fiber yield; (iii) collector spacing versus fiber diameter are related together with a medium negative correlation, which means that fibers with smaller diameters are achieved in larger collector spacing. Other correlations are either weak or insignificant.
There are some related reports in the literature, that discuss the relationships between the fiber diameter and the rotational speed, but there is no general trend that would be observed throughout the majority of papers. For example, Noroozi et al., 52 Ye et al., 53 and Padron et al., 54 reported that increasing rotational speed causes a decrease in fiber diameter until a certain threshold. Upson et al. 55 showed that rotational speed doesn’t have a significant effect on fiber diameter. Li et al. 56 produced poly (ethylene oxide) nanofibers with different parameters. In their research, higher rotational speed resulted in a smaller fiber diameter. Also, Ren et al. 4 obtained a similar relationship between rotational speed and diameter. However, Fang et al. 47 produced photo-curable fibers via CS and they stated that spinning speed doesn’t affect the fiber diameter. In Padron et al, 41 a decrease in orifice diameter led to a reduction in the overall fiber diameter. Similarly, Fang et al, 47 Noroozi et al, 52 and Ye et al. 53 showed that the average fiber diameter increases with increasing orifice diameter. Moreover, they stated that fiber diameter was affected by the viscosity of the solution too. To manipulate fiber diameter; the viscosity and orifice diameter can be changed independently, or tailored together. They showed that the mean fiber diameter decreases with increasing rotational speed as well as decreasing spinneret diameter. Zander et al. 57 obtained poly(ε-caprolactone) fibers via melt and solution spinning with needles under different parameters. It was found that collector distance doesn’t create a statistical change in fiber diameter but affects beading and fiber quality. On the other hand, Krifa et al. 58 reported that collector distance affects fiber diameter to some extent as well as fiber morphology. It should be noted that the collector distance in literature means the distance between the orifice/needle tip to the collector, that is, the distance that spun fiber travels between the needle tip and collectors.
Therefore, the term “collector spacing” was used in the present study. Parameters involved in the CS process have been researched by many groups, as discussed above. However, the effect of the collector spacing on the yield of collected fibers and fiber morphology and diameters has not been studied yet, to the best of the author´s knowledge. After reviewing all above mentioned and cited papers on CS, it becomes clear that the rotational speed and collector distance do not have the same effect in all cases. In some reports, higher rotational speeds decrease the fiber diameter, while other reports do not agree with this effect. Even though this seems to be a rather controversial issue, the explanation for this controversy is quite simple in the authors’ view. There is a high number of variables and parameters of centrifugal spinning in these reports, which renders it difficult (or even impossible) to reliably quantify the effect of changing rotational speed on the fiber diameter.
A significant contribution of other parameters to the fiber diameters presented in this study can be excluded. This applies also to the temperature and relative humidity, even while changing the collector spacing. The reason is that the used CS tool has a closed air conditioning loop, which allows the processes to be operated within the chamber at very similar temperatures and RH.
Fiber morphology
Morphologies of produced fibers were investigated from their respective SEM images. Morphologies were judged concerning homogeneity and defects, such as beading or beading along the individual fibers. Lower and higher magnifications were used during the SEM viewing. At higher magnifications, one can find homogenous and bead-free areas in any sample. Therefore, by using lower and higher magnification images, more robust and unbiased results can be obtained about the beads. However, it should be noted that the present paper does not cover any quantitative analysis of beads on centrifugal spun fibers, because such statistics cannot be done at present in a sufficiently accurate way. Therefore, there are no statistics involved here in the bead analysis. As can be also seen from Figure 4, the fiber yields for 18G needles (Figure 4(a)) are in majority slightly higher than 21G needles (Figure 4(b)) in most of the experiments. The reason for this difference can be attributed to the larger diameter of the needle, which has consequences on the mechanism of bead generation. A needle with a larger diameter tends to generate more beads instead of fibers and thus contributes to an increased mass difference. Instead of solvent evaporation and fiber formation, solution droplets were formed and stuck to the collectors or on the formed fibers.
PVP fibers produced with 18G needles do not show any significant differences in terms of homogeneity and defects to the observed parameters (Figure 7). Neither the different spacing of the collectors nor the rotational speeds have an effect on the morphology, and the number and the size of beads are almost the same for all conditions. However, the number of beads increases at the highest spinning speed and collector spacing (i.e. 9000 RPM and 18 cm, respectively). SEM images of 18 wt% PVP fibers produced via 18G needle at different rotational speeds and for different collector distances (scale bars denote 50 μm).
In PVP fibers spun via a 21G needle (Figure 8), the number and size of the beads slightly increase with the increasing collector spacing and spinning speed in some experiments, but the amount and the size of beads are smaller, compared to PVP fibers spun via an 18G needle (Figure 7). However, this might be the result of the random spreading of the beads from needles during the spinning process. Overall, it can be stated that fibers spun via smaller needle diameters and collected with denser collectors are more homogenous and possess fewer defects within the fiber structure. SEM images of PVP fibers produced via 21G needle at different rotational speeds and for different collector distances (scale bars denote 50 μm).
In the literature, studies about the mechanism and formation of beads can be found for nanofiber production using different methods.59–61 In the CS process, the formation of beads is mainly related to the needle gauge/diameter and solution viscosity 58 that higher viscosity solutions tend to generate fewer beads than lower viscosity solutions. Regarding needle gauge/orifice diameter, fiber production with smaller diameters resulted in fewer and smaller beads, which is clearly can be seen by comparing Figures 7 and 8.
Conclusion
In this study, the effect of the collector spacing on the fiber yield, diameter, and morphology was investigated for generic CS systems with bar-type collectors. Experiments were conducted with five different collectors spacing using an aqueous solution of 18 wt% PVP, two different 18G and 21G hypodermic needles at three different spinning speeds (5000, 7000 and 9000 RPM). Experiments proved that collectors with lower spacing can capture more fibers and thus increase the efficiency of the process and avoid losses. Therefore, this knowledge can be applied to other experiments with different polymers and parameters. On the other hand, with increasing the rotational speed, fiber yields decrease due to the fly-off of spun fibers from the top of the collectors. For higher fiber yield at higher speeds, using taller collectors or dome-shaped collectors is suggested.
Experiments and analysis showed that collector spacing affects the fiber diameter, as shown in provided figures and tables. However, there were no principal trends on how the collector spacing affects the diameter. It turned out that the fiber diameter in CS is a complex issue and depends on several parameters, therefore it is challenging to judge it with collector spacing only. Furthermore, analyses of fiber morphologies revealed that collector spacing does not have an obvious influence on morphology.
To sum up, employing a denser collector is beneficial for fiber collection and might provide slightly more defect-free morphology in CS systems, where fibers are collected with bars. With the aid of Fused Deposition Modelling (or similar modeling software), any collector type that is suitable for CS can be designed and used in the production of fibers.
Supplemental Material
Supplemental Material - Design of collectors in centrifugal spinning: Effect on the fiber yield and morphology
Supplemental Material for Design of collectors in centrifugal spinning: Effect on the fiber yield and morphology by Nasrollah Naseri Joda, Ahmet Erdem Ince, Martina Rihova, David Pavlinak and Jan M Macak in Journal of Industrial Textiles
Footnotes
Acknowledgments
The work was supported by the Brno University of Technology, Specific Research Project CEITEC VUT-J-19-5991. CzechNanoLab project LM2023051 funded by the Ministry of Education, Youth, and Sports of the Czech Republic is gratefully acknowledged for the financial support of the SEM measurements at CEITEC Nano Research Infrastructure.
Declaration of conflicting interests
The author(s) declared no potential conflicts of interest with respect to the research, authorship, and/or publication of this article.
Funding
The author(s) disclosed receipt of the following financial support for the research, authorship, and/or publication of this article: The work was supported by the Brno University of Technology, Specific Research Project CEITEC VUT-J-19-5991. CzechNanoLab project LM2023051 funded by the Ministry of Education, Youth, and Sports of the Czech Republic is gratefully acknowledged for the financial support of the SEM measurements at CEITEC Nano Research Infrastructure.
Data availability statement
Date used to create this manuscript can be provided upon reasonable request.
Supplemental Material
Supplemental material for this article is available online.
References
Supplementary Material
Please find the following supplemental material available below.
For Open Access articles published under a Creative Commons License, all supplemental material carries the same license as the article it is associated with.
For non-Open Access articles published, all supplemental material carries a non-exclusive license, and permission requests for re-use of supplemental material or any part of supplemental material shall be sent directly to the copyright owner as specified in the copyright notice associated with the article.