
Abstract
Recycled fibers obtained from pre-textile waste present advantages and challenges in acoustic absorber design. This study examines the potential of incorporating textile waste into acoustic absorption systems, with a focus on pre-used waste, to increase the percentage of recycled fibers in the textile industry using the quantitative method Used to evaluate the efficiency of panels manufactured in different sound frequencies, from up to 2000 Hz, and, in some cases, up to 3000 Hz Observations indicate that surface cleaning products, pneumafil waste a twist, comb bat residue and waste grinders exhibit the highest sound absorption coefficients in and using waste samples In addition, a procedure has been developed to evaluate the sound absorption reduction coefficient, which exposes high correlations with values obtained by other methods Sound contour mapping further confirms the homogeneity of the sample and reveals the effectiveness of specific sound absorption systems, such as air condition station filters, spinning pneumafil waste, and weaving waste (samples 18, 20, 21, and 23). Nevertheless, the study of integration emphasizes the ability to reuse waste fibers for sound insulation that can absorb adequate sound, reduce reflected sound, and offer a promising solution for dealing with noise pollution. A thorough examination of sound contour maps across absorber surfaces is undertaken to account for the material structure of the absorber, ensuring an accurate representation of how sound is absorbed and distributed within the designated area.
Introduction
Using natural fiber-based materials and composites in acoustic applications has gained traction due to their eco-friendly attributes, cost-effectiveness, and sound absorption capabilities. 1 However, textile waste remains a significant global environmental concern, with only a small fraction recycled, particularly in the United States.1,2 The European Union is actively working to reduce textile waste and promote recycling, emphasizing the need for innovative waste management.
The European Union is actively working to reduce textile waste and promote recycling, emphasizing the need for innovative waste processing and recycling methods.
2
Integrating textile waste fibers into acoustic absorbers presents a promising approach to sustainable acoustic engineering.
3
The textile industry is responsible for producing 2.1 billion tons of waste, with most of it being discarded into the water ecosystem during dyeing processes.
4
Textile waste occupies almost 5% of total landfill space, with clothing waste alone accounting for 84% of all waste.
5
Additionally, significant waste is generated during various industrial processes. Figure 1 illustrates the material flow map of the textile industry, showing the approximate percentage of pre-consumer waste in each production stage. The highest proportion of pre-consumer waste is found in the spinning and garment industries, with garments contributing the highest percentage of post-consumer waste. The flow of waste in the textile industry.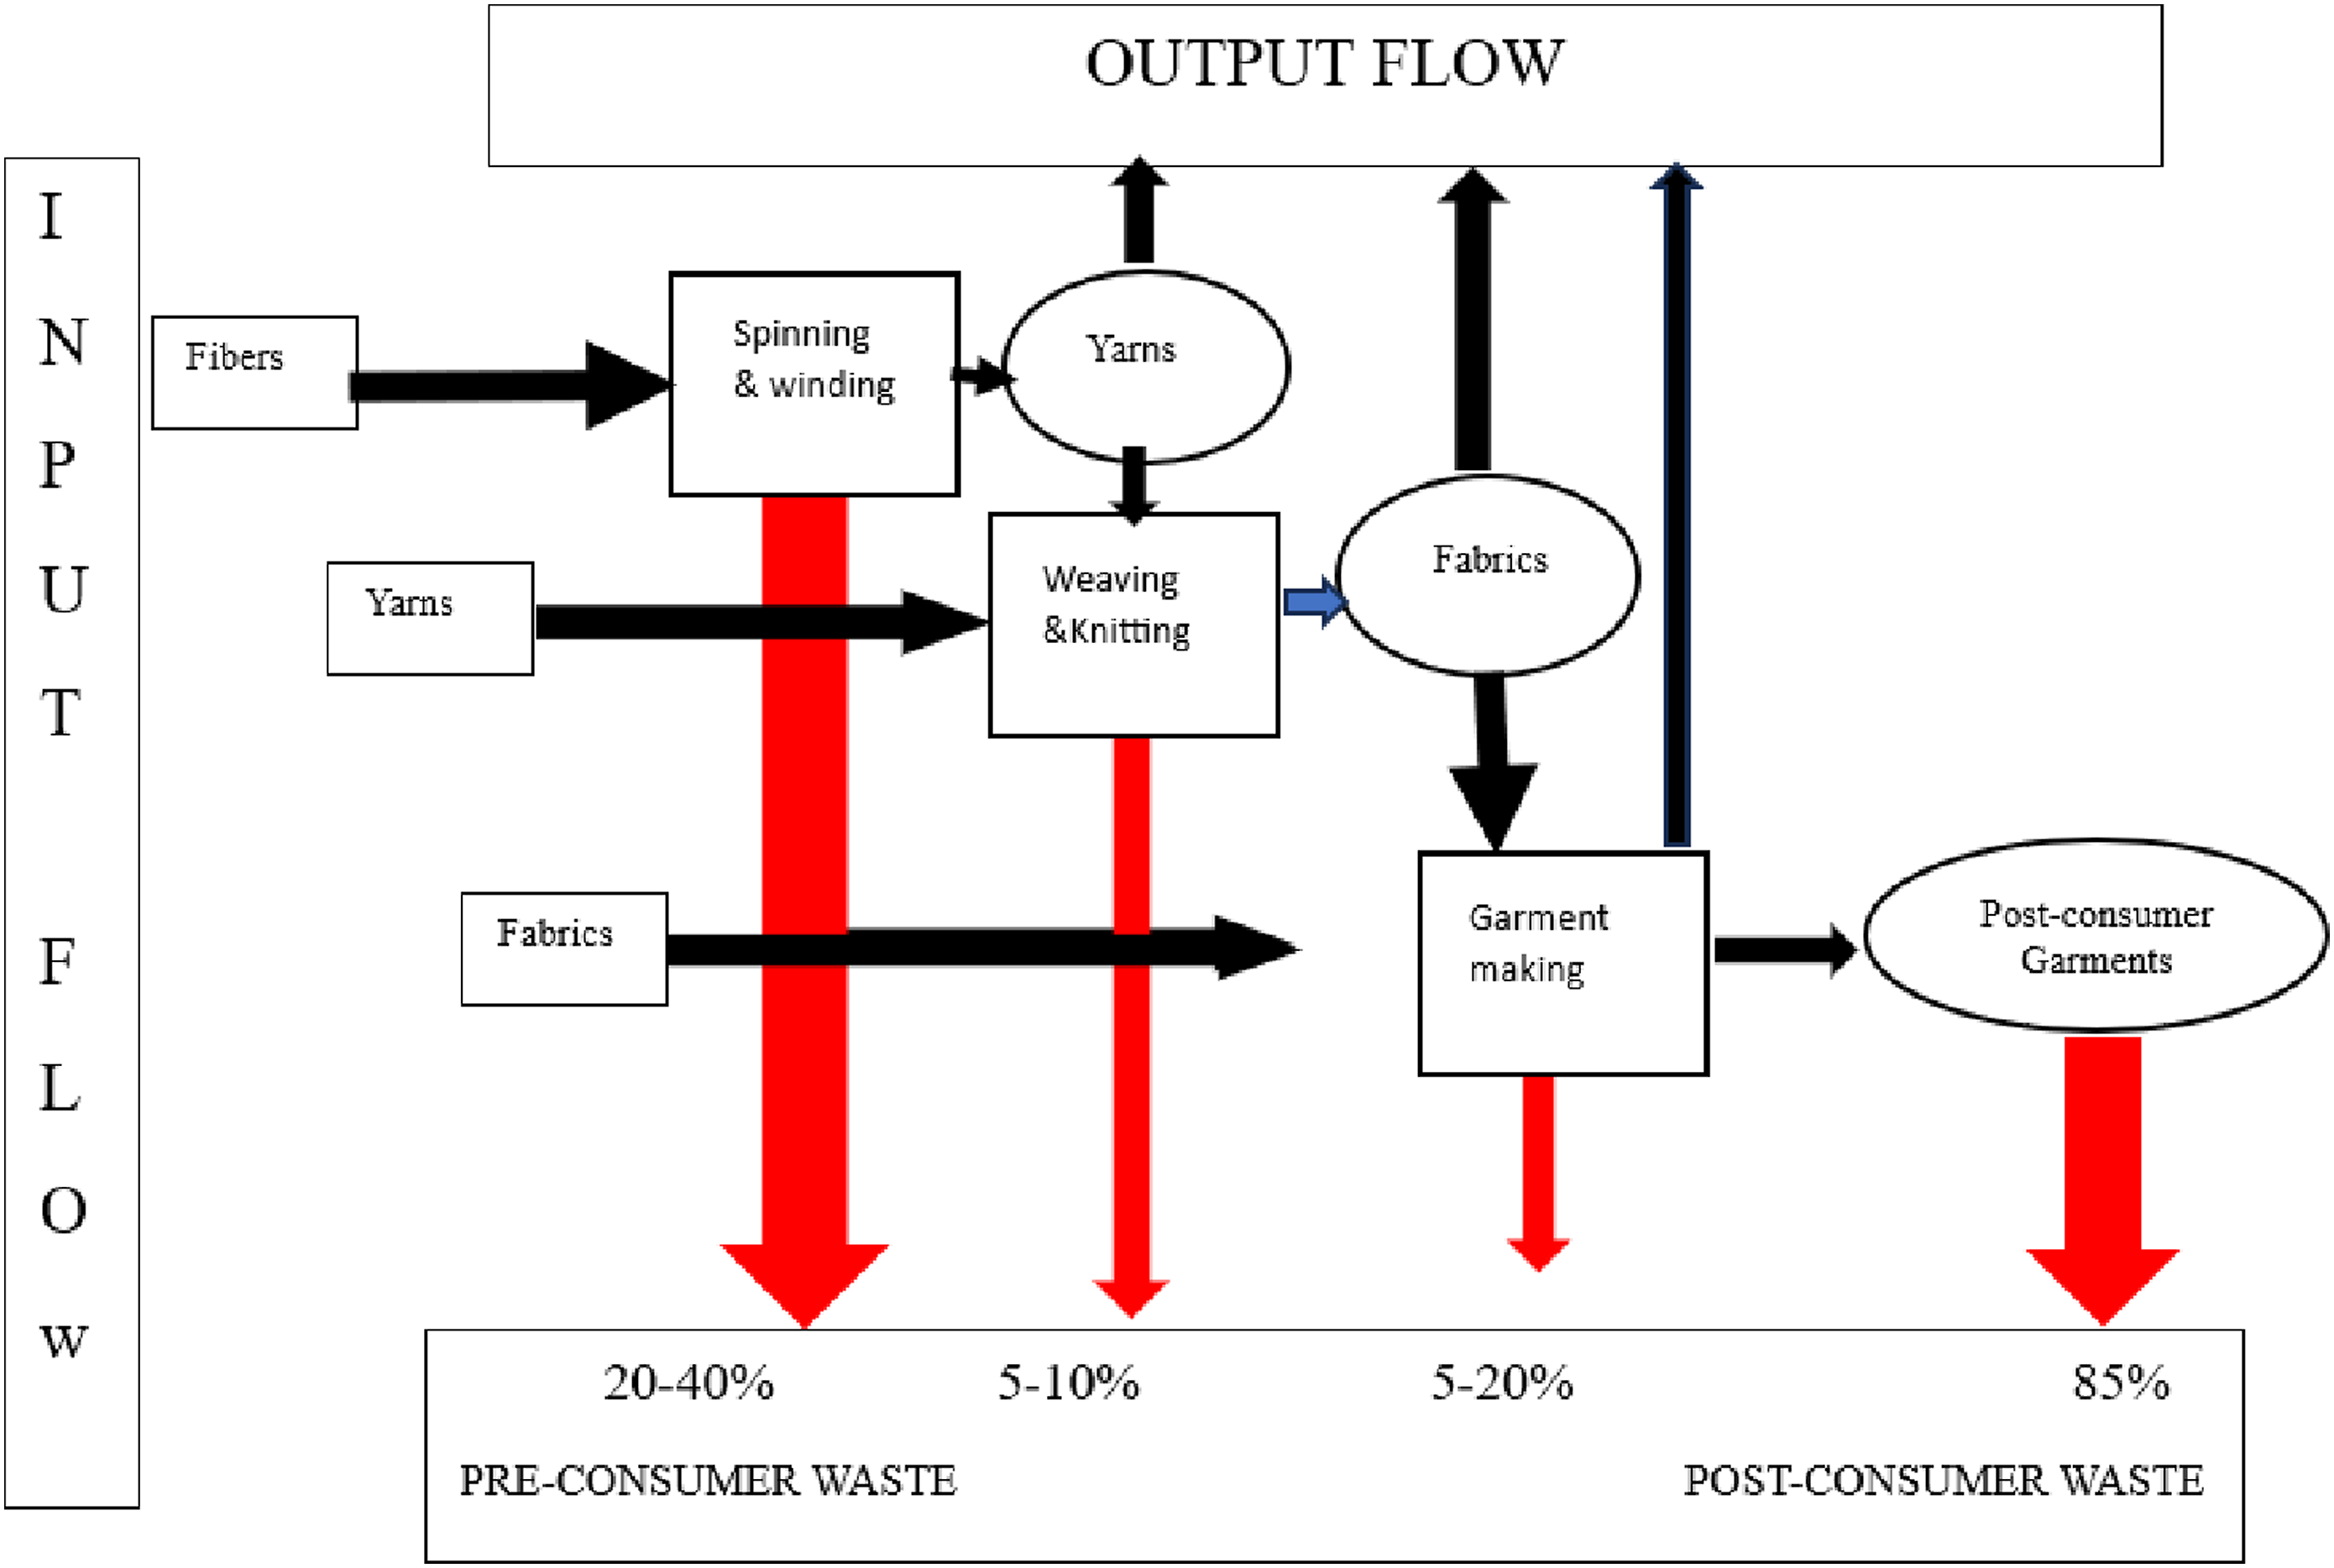
In the survey of waste percentages within a spinning mill, waste arises from diverse sources throughout the production process. Common origins of waste in a spinning mill include: Raw Material Waste: Stemming from the utilization of subpar or contaminated raw materials, resulting in escalated waste during processing, Process Waste: Waste generated at various stages of spinning, such as carding, drawing, roving, and spinning, with the following average percentages: Blow room waste (7%–15%), Card waste (4 to 5%), Card web (0.7%), Drawing sliver (1%), Sliver in combers and lap former (1.0%), Comber waste (10 to 20%), Hard waste in ring spinning and winding (0.5%), Sweeping and clearer waste (1.5%), Ring frame and Pneumafil (1%–2.5%), Filter waste (0.5%), Hard waste in ring spinning, reeling, and winding (0.5%), Speed frame sliver and roving ends (0.5%). Hard yarn waste can occur during winding, warping, or the weaving and knitting processes, amounting to approximately 2%–4%. Typically, a certain amount of hard waste is expected in textile manufacturing due to factors like yarn breakage, machine stoppages, and imperfections in raw materials. The percentage of waste in textile mills fluctuates based on variables such as the type of raw material, yarn, and fabric specifications, and the implemented recycling practices during the production cycle. Studies have highlighted the effectiveness of natural fibers such as jute, coir, and hemp in creating eco-friendly acoustic panels, while recycled materials like reclaimed cotton and polyester fibers exhibit excellent sound absorption behavior.6,7 These absorbers aim to achieve effective sound absorption through porous structures8–13 that facilitate sound propagation and energy dissipation.14,15 Several studies have explored the use of textile waste fibers in various applications, including sound and heat-insulating webs, filter products, and nonwoven coating substrates.16–20 Additionally, research has investigated the acoustic behavior of blended nonwoven fibrous materials extracted from coffee husks and waste from the cotton spinning industry.20,21 Recycled materials, particularly reclaimed cotton and polyester fibers have shown excellent sound absorption behavior, especially when combined with innovative bonding techniques such as thermochemical hybrid bonding. 22 Moreover, composite panels incorporating wool waste fibers display promising acoustic absorption coefficients comparable to conventional building materials. Design principles for sustainable acoustic absorbers prioritize porous structures that facilitate sound propagation through interconnected pore networks, leading to effective energy dissipation.23–26 Both woven fabrics with diverse weave structures and nonwoven textiles, including recycled materials, serve as efficient sound absorbers across different frequency ranges. 15 Textile materials present a versatile and effective solution for developing sound absorbers, with potential applications in low, medium, and high-frequency regions.27–29
Nevertheless, enhancing the mechanical and acoustic properties of natural fiber sound absorption panels remains challenging, as it necessitates achieving a balance between porosity and density while ensuring good adhesion between natural fibers and binders. 30 The properties of fibers used in sound absorption panels can significantly influence their acoustic performance: Fiber Density: Higher fiber density generally leads to improved sound absorption due to increased mass and impedance matching with air, enhancing the panel’s ability to attenuate sound waves.31,32 Fiber Length: Longer fibers can enhance sound absorption by providing greater surface area for absorbing sound energy, resulting in increased absorption coefficients across a wider frequency range. 33 Fiber Diameter: Thinner fibers can promote better sound absorption by creating more irregular surfaces, which scatter and dissipate sound waves more effectively. 34 Fiber Rigidity: Fibers with higher rigidity may enhance sound absorption by providing structural support and facilitating the trapping and absorption of sound waves within the panel structure. 35
The twist amount of yarn can affect the density, porosity, and surface irregularity of the textile material. Higher twist amounts may result in denser and more compact structures, potentially reducing porosity and affecting sound absorption. Conversely, lower twist amounts may lead to looser structures with higher porosity, which could enhance sound absorption by allowing for better air permeability and sound wave penetration. Different spinning technologies, such as ring spinning, compact spinning, rotor spinning, and air-jet spinning, can produce yarns with varying properties in terms of twist level, yarn structure, and surface characteristics. These differences may indirectly affect the sound absorption of panels made from these yarns.36,37
This work focuses on acoustic panels made from waste generated in the spinning and weaving cotton industry, highlighting the potential of eco-friendly materials and innovative design approaches for improved acoustic performance while addressing textile waste management concerns. It holds great promise for advancing the field of acoustic engineering and addressing textile pre-consumer waste management concerns.
The study presented conducts a thorough investigation into the utilization of recycled fibers sourced from pre-existing textile waste for the creation of acoustic absorbers. It assesses efficiency, identifies optimal waste sources, and devises evaluation procedures. This research provides valuable insights into addressing environmental concerns and advancing sustainability within the textile industry, while also suggesting effective strategies for reducing noise pollution.
Utilizing a sound map to evaluate the internal structure of panels crafted from nonuniform textile waste presents an innovative method. By visualizing and analyzing sound propagation characteristics, this approach introduces a new dimension to structural assessment. The development of a specialized apparatus highlights the researcher’s proactive stance in addressing the unique challenges associated with nonuniform textile waste panels and underscores their dedication to discovering inventive solutions for structural evaluation.
Materials and methods
Material
Various types of pre-consumer waste from spinning and weaving mills were prepared for the fabrication of sound absorber plates. The specifications of the processed cotton were as follows: upper half mean length of 33.67 mm, uniformity index of 87.1%, short fiber percentage of 5.8%, fiber strength of 45.7 gm/tex, micronaire reading of 4.27, reflective index Rd of 74.2, yellowness + b of 8.9, SCI (??) of 208, fiber maturity of 81%, hair weight of 169 mtex, trash content of 3.5%, and neps count/gram of 68.
Types of waste used for preparing the sound absorber panels.


The overhead cleaner waste and Spinning pneumafil consist of a mix of long and short fibers that make the structure of the absorber more porous, reducing the time measured by the Prosometer. The porosity of the fibers in sound absorption panels is directly related to the value of the noise reduction coefficient. Higher porosity allows for better absorption of sound waves, leading to a higher noise reduction coefficient. The same effect occurs in the case of winding waste. Additionally, the distribution of the fiber’s bulk also affects the size of the pores between the fibers. Residual yarns left on the cones following the warping process are regarded as waste. The percentages of different types of waste in a weaving mill can vary based on several factors, including the efficiency of the processes, the quality of materials, and the skill of the operators. Here is a general breakdown of potential waste percentages in a weaving mill: Residual Yarn Waste: This can range from 1% to 3% of the total yarn used in the warping process. Sizing Waste: Sizing waste is typically around 2% to 5% of the sized yarn. Knotting Waste: Knotting waste may constitute approximately 1% to 2% of the total warp ends. Beam Residual Waste: This waste can be around 1% to 3% of the warp yarn on the weaver’s beam. Auxiliary Selvedge Waste:
The percentage of waste from auxiliary selvages might be in the range of 1% to 2%. Most of the waste in weaving mills is yarn, either sized or unsized.
Manufacturing of sound absorber panels
The construction of the sound absorber samples followed a process wherein fibers or yarns were arranged randomly in a circular mold with a diameter of 100 mm. To manufacture a highly effective sound porous absorber from fibrous material, the following procedure was followed to produce a high porosity sample: 1. Select fibrous materials from different types of textile waste. 2. Design absorbers with appropriate thickness and density. 3. Layer fibrous materials freely to maximize absorption efficiency. 4. Improve porosity by incorporating irregular textures. 5. Encapsulate the material to ensure durability and prevent shedding of fibers. 6. Test absorbers to evaluate their performance in absorbing sound waves. 7. Adjust the design based on test results to optimize effectiveness.
Sound absorbers sample specifications.


Procedure for sample preparation.
The samples were structured to possess an identical mass of 7.5 grams.
Measurements of waste absorber samples
Sample panel thickness
The thickness of the samples was measured using a portable digital thickness vernier caliper. The averages, standard deviations, and coefficients of variation were calculated.
Sample panel areal density
Samples were weighed using an electronic balance, and the area of the samples was measured. Afterward, the areal density (s) in kg/m2 was calculated by dividing the weight by the area. Bulk density (ρpanel) in kg/m3 was calculated from the areal density and thickness using the following formula:
where s is the areal density in kg/m2, and T is the thickness in m.
Sample panel porosity
Porosity is the ratio of the voids to the total volume of materials. The porosity (Φ) of panels was calculated using the following relation
12
:
Where ρfiber is the density of the fiber, and ρpanel is the density of composite panels. The average density of cotton is 1.52 g/cm3.
Sample panel porosity measurement using air porosimeter
The sample porosity was measured using an air porosimeter, which measures the porosity of materials by quantifying the flow of air through them, specifically the volume of air voids within a solid sample. To understand the physical properties of materials, porosity affects various aspects such as sound absorption. The porosity of the sample was assessed using an air porosimeter, a device designed to quantify the porosity of materials by measuring the flow of air through them, with a particular focus on the volume of air voids present within a solid sample. This measurement technique aids in comprehending the physical properties of materials, given that porosity plays a significant role in various aspects such as sound absorption. 35 The porosity meter (JDC Skywatch) was employed to measure the sample’s porosity. This equipment enables the passage of air volume through a fabric to determine its porosity. It calculates the duration required for 0.25 liters of air, under a pressure of 10 mbar, to traverse through 38.5 cm2 of the absorber. The air porosimeter determines the time for (Q) liter of air to pass through the sample of area A. The air permeability of the sample can be determined as (Q/t)/A) cm3/cm2 sec. Since Q/A is constant, the sample air permeability will be inversely proportional to the time recorded (t).
Setup for quick measuring of the sound transmission loss
The acoustical properties of the waste panel were assessed using the acoustical chamber method.36,38,37 To quickly evaluate various sound absorbers, a setup was devised to ascertain the reduction in the sound absorption coefficient, as illustrated in Figure 3. Setup for quick measuring the sound transmission loss.
As illustrated schematically in Figure 3, acoustic measurements were conducted using circular samples with a diameter of 10 cm. The sound signals were transmitted to the laptop via a digital voice recorder, while a digital sound pressure level meter was used to capture the sound levels. The specifications of the digital sound meter included a measurement range of 26 to 130 dB across six ranges, with a resolution of 0.1 dB and an accuracy of ±1.5 dB. The frequency range covered 31.5 Hz to 8 kHz. A signal generator provided the input to the loudspeaker, and the test specimen was securely held beneath the digital sound pressure level meter. The sound waves transmitted through the sample were measured by the digital sound pressure level meter and analyzed using Audacity software on the laptop. Measurements were conducted three times, both with and without samples, and the results were averaged to determine the Sound Transmission Loss (STL), calculated according to ASTM E2611. The apparatus also featured a movable holder, allowing for the simultaneous movement of both the sound source and the digital sound meter across the sample area. This movement facilitated the generation of sound contour maps for the absorber panel.
Furthermore, the developed sound measurement apparatus encompasses key specifications such as a wide frequency range (typically from 20 Hz to 20 kHz) and the use of a condenser microphone with a flat frequency response. Additionally, the apparatus included data logging capabilities for recording measurements over time, enabling thorough analysis and reporting.
A standard noise generator, producing sound frequencies ranging from 250 to 2000 Hz, is used to test the sound insulation properties of the material according to the following procedure: The specimen is securely fixed to the holder to ensure the position and flatness of both its front and back surfaces. The test specimen holder is positioned equidistant between the speaker and the microphone and is capable of accommodating a specimen. The sound transmitted through the sample is measured by a digital sound level meter. The chamber is insulated by closing the top cover. The sound transmission losses at frequencies of 250, 500, 1000, 1500, and 2000 Hz for different samples are calculated. The sound pressure (in dB) is measured both with and without a sample.
The transmission loss is calculated in both cases using the formula:
Where STL represents the transmission loss, AR stands for the recorded sound output pressure (dB), and AI denotes the recorded sound input pressure (dB).
Results and discussions
The principle of energy conservation in sound absorption pertains to the preservation of energy when sound waves interact with and are absorbed by a material. Upon fibrous material, sound waves transfer energy to it through mechanisms such as vibration, friction, and deformation. This transformation process decreases the amplitude of the sound wave, leading to a reduction in sound intensity and attenuation of the sound signal. Sound waves induce microscopic vibrations within the material, causing frictional losses and converting sound energy into heat. Porous materials, such as fibrous panels, contain air-filled pores that permit sound waves to enter and be dissipated through multiple reflections and interactions with the material’s structure. This results in the absorption of sound energy within the material. The properties of fibers utilized in sound absorption panels can significantly impact their acoustic performance. The fiber waste from different sections of the spinning, winding, and weaving processes possesses varying properties that affect sound absorption efficiencies. Additionally, the orientation of fibers within the panel can influence sound absorption properties, with random fiber orientation often leading to more effective sound wave scattering and improved absorption coefficients.29,38,39
Accordingly, the design of the samples from the spinning and weaving waste ensured a random layout of the fibers with high porosity.
Sound absorber properties
Two sets of samples were designed as sound absorbers: 14 samples were manufactured from different types of waste, and nine samples were from the blending of different waste types.
Sound absorber using spinning and weaving waste
Table 2 provides the specifications of the samples.
Sound absorber using a blend of spinning and weaving waste
Specification of designed sound absorber from a combination of spinning and weaving waste.


Analysis of sound absorption panels from spinning mill waste
Several sound absorber panels made from various spinning waste materials (see Table 1) were tested to determine the Sound Absorption Coefficient (SAC) for sound frequencies ranging from 250 to 2000 Hz. For samples with IDs 6, 8, 9, and 11, the range of sound frequencies was extended up to 3000 Hz. Figure 4 illustrates the sound absorption coefficient of different spinning cotton waste absorber panels. The sound absorption coefficient of different spinning cotton waste.
Figure 4 illustrates that the most significant sound insulation performance was observed in samples with IDs 6, 8, 9, and 11. These samples, consisting of overhead cleaners, spinning Pneumafil, combing batt remain, and Winding Waste, exhibited the highest Sound Absorption Coefficient (SAC) values across low, medium, and high sound frequencies up to 3000 Hz.
Conversely, samples with IDs 2, 4, 5, 6, and 7 displayed lower SAC values at low and medium sound frequencies but demonstrated an increase at higher sound frequencies up to 1500 Hz. This trend may be attributed to the short fiber length and the presence of impurities, resulting in a higher concentration of fibers in the panel. As the frequency rises, the shorter fibers provide greater freedom for the fiber ends to vibrate in response to sound waves, thereby absorbing less sound energy. The porous nature of panels containing short, fine fibers allows sound to propagate through an interconnected pore network, potentially resulting in less effective sound absorption. This phenomenon is particularly noticeable at high sound frequencies, as observed in samples with IDs 2, 4, 5, 6, and 7. Remarkably, the SAC value decreases at high sound wave frequencies, which warrants further investigation.
The Noise Reduction Coefficient (NRC) serves as a metric to measure a material’s sound absorption capabilities, quantifying the average level of sound energy absorption across four distinct frequencies (250 Hz, 500 Hz, 1000 Hz, and 2000 Hz), represented as a value ranging from 0 to 1. Figure 5 displays the values of the Noise Reduction Coefficient (NRC) for the different samples. Noise reduction coefficient of different sound absorbers from spinning cotton waste. *A/C station filter (air conditioning filter waste).
The noise reduction coefficient for various waste types obtained during the spinning of cotton yarns.

aAc station filter (air conditioning filter waste).
Measurements are presented in Table 4, depicting the noise reduction coefficient for various waste types obtained during the spinning of cotton yarns.
When sound penetrates porous materials, the sound pressure causes air molecules within the porous material to oscillate at the same frequency as the incoming sound wave. This oscillation results in frictional losses as sound waves change direction while passing through irregular pores, causing them to lose momentum. Absorber materials, characterized by a space structure of fibers of varying lengths and containing cavities, channels, or interstices, allow sound waves to enter through them. Open pores establish a continuous channel of communication with the external surface of the fiber structure, significantly affecting sound absorption, such as the needle holes in needle-punched nonwovens. In contrast, closed pores are considerably less effective at absorbing sound energy. Another type of pores, termed ‘blind,' is those that are open from only one end. The increase in the number of fiber layers within the absorber structure can lead to changes in the percentage of different pore types, thus explaining variations in the air permeability of thick samples. The sound absorption coefficient of the material is influenced by the presence of air molecules on the material’s surface and within the pores. Sound waves cause air molecules to vibrate, resulting in a loss of some of their original energy. In fibrous materials, much of the energy is also absorbed through scattering from the fibers and the vibrations induced by the individual fibers. Under the influence of sound waves, the fibers in the material rub against each other, affecting the shapes and sizes of pores in some structures of fiber layers and different types of fabric. 15
In the case of a fiber web, several factors influence absorbed energy, including the spaces between the pores, pore size, fiber flexibility, fiber orientation about the direction of the sound wave, and resonance frequency. The network of fibers creates pores of varying sizes, intersected by fibers at different levels along their lengths. These fibers are induced to vibrate by the sound wave, and therefore, the pore diameter depends on the fiber diameter and the distribution and orientation of the fibers in each layer. The presence of pores on the surface increases the sound absorption coefficient of the material, which is dependent on the pore diameter and distribution. The maximum sound absorption coefficient of the material is directly proportional to the pore area.29,38,39
The relationships among these parameters are interdependent. Changing the inherent properties of the fibers would inevitably impact other parameters that influence the sound absorption coefficient of the material. The acoustical properties of porous materials, including characteristic impedance and propagation constant, are influenced by the flow resistance of the material. Specific flow resistance per unit thickness of the material is a critical factor that affects the sound-absorbing characteristics of nonwoven materials. To be effective at sound absorption, porous materials should have sufficient pores on their surfaces for sound to pass through and be attenuated.
The prepared sound absorption panels made from weaving waste exhibited variations depending on the sound frequency, as depicted in Figure 6. The Sound Absorption Coefficient (SAC) of the samples is highest for low and medium frequencies. The sound absorption coefficient of different weaving mill waste.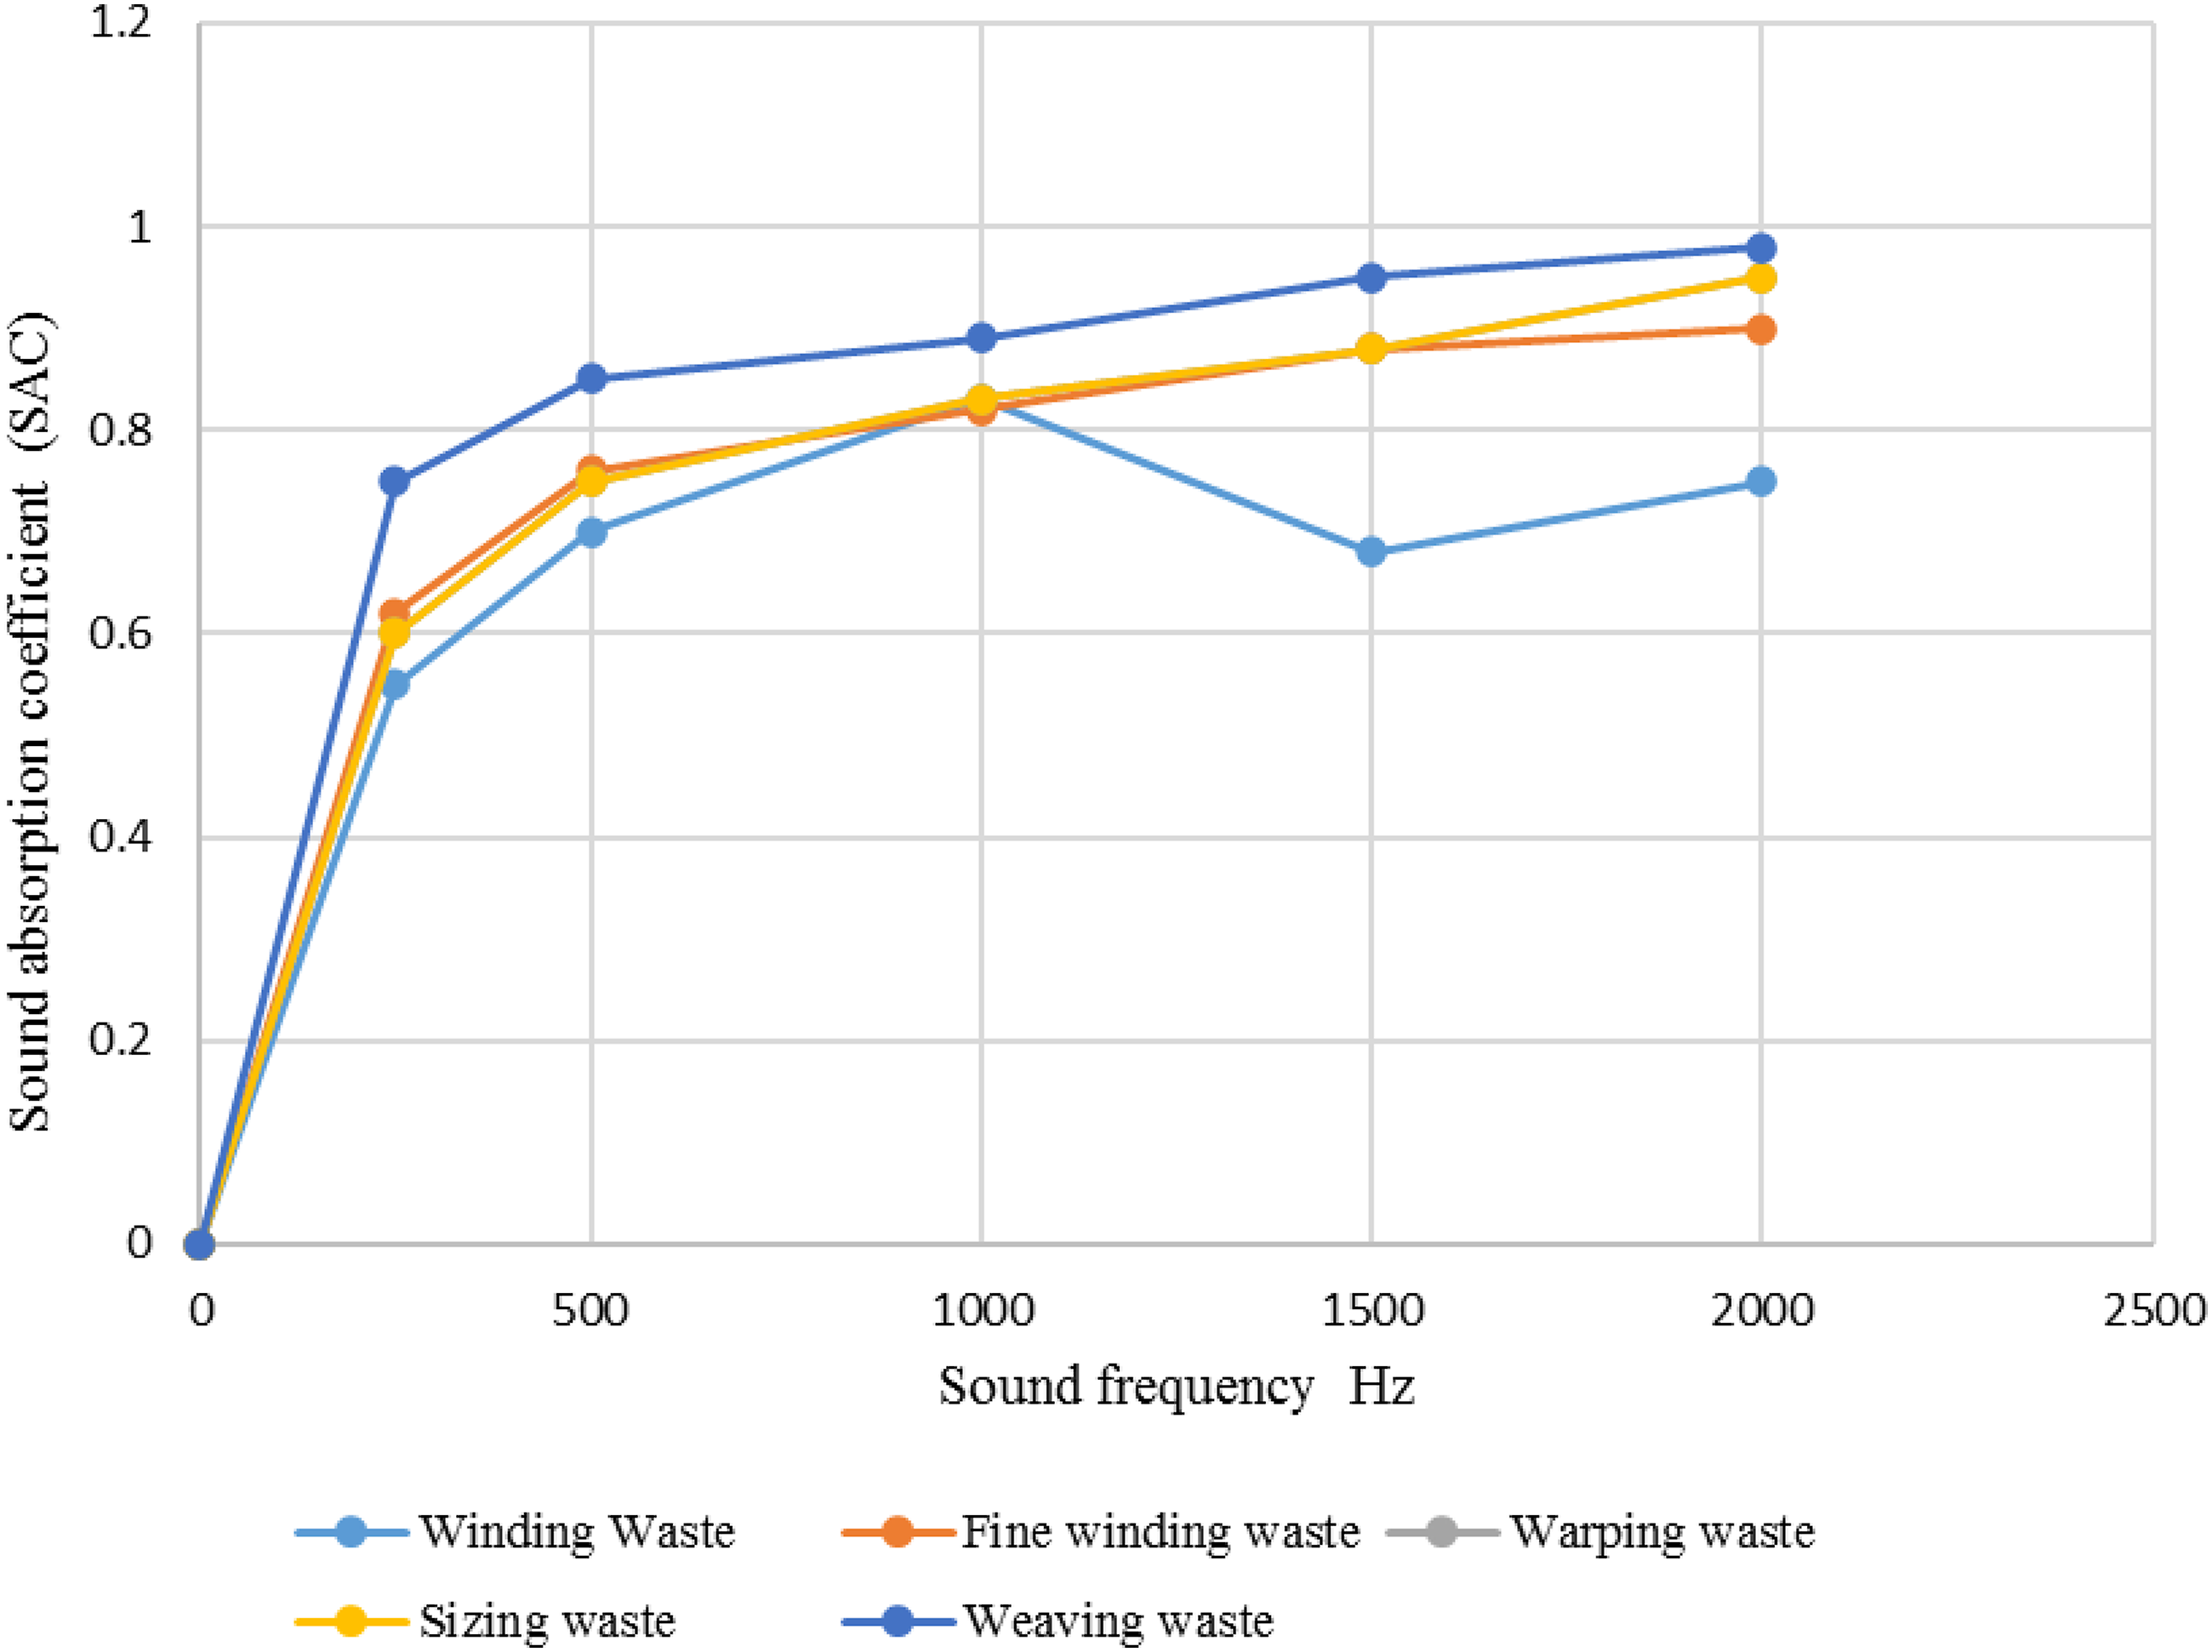
Figure 7 displays the Noise Reduction Coefficient (NRC) values for various weaving mill waste samples. Noise reduction coefficient of different sound absorbers from weaving mill waste.
The relation between properties of spinning and weaving waste absorber characteristics and noise reduction coefficient
The Noise Reduction Coefficient (NRC) value depends on the structure of the absorber, its porosity, and tortuosity. Figure 8(a)–(d) illustrates the relationship between the NRC value of the spinning waste absorbers and their structural characteristics. The air permeability of the sound absorber material, which is proportional to the absorber material porosity (Φ) divided by the time recorded on the Prosometer (t), can affect its NRC by influencing the way sound waves pass through the material (see Figure 8(a)). Sound absorber materials with higher air permeability facilitate easier passage of sound waves, enhancing their overall effectiveness in sound absorption. Conversely, materials with lower air permeability may impede the passage of sound waves, potentially reducing their absorption capabilities. a, b, c, d. Relations between the value of Noise Reduction Coefficient (NRC) of the spinning waste absorbers and its structural characteristics. (a) NRC versus sample (Porosity/time (t) measured by Prosometer) (b) NRC versus sample density. (c) NCR versus the ratio of porosity/sample thickness (d) NCR versus sample tortuosity.
Density of materials
Higher-density materials typically have better sound absorption properties, as they are more effective at dampening sound waves. This is because denser materials are better at dissipating the energy of sound waves as they pass through or interact with the material. 31
As a result, sound absorber materials with higher density often have higher NRC ratings, indicating superior sound absorption capabilities (see Figure 8(b)).
The ratio of porosity/sample thickness
Porosity plays a crucial role in determining the sound absorption capability of fibrous materials. When the porosity of a fibrous sound absorber increases, the material becomes more effective at absorbing sound. This is because increased porosity allows sound waves to penetrate deeper into the material, where they can be dissipated and converted into heat energy. Additionally, higher porosity can also lead to increased airflow resistance within the material, which further enhances its sound absorption properties.
However, it’s important to note that the relationship between porosity and sound absorption is influenced by various factors, such as the material’s density, fiber arrangement, and thickness, which can impact the effectiveness of sound absorption.
In the case of fibrous sound absorbers, sample thickness can affect the NRC in several ways, such as providing more material for sound wave interaction and influencing the depth of sound wave penetration.
In our case, with a constant weight of the absorber, the porosity effect increases as the thickness increases, resulting in a reduction in absorber density. 31 The value of NRC is proportional to the ratio of porosity/thickness, as shown in Figure 8(c).
The effect of fibrous sound absorber porosity/sample thickness on its NRC is that the NRC typically increases with higher porosity, as a greater amount of air space allows for better sound absorption. However, the effect of sample thickness can vary depending on the specific material and structure, so it’s important to consider both parameters when designing sound absorbers.
Therefore, when optimizing the NRC of a sound absorber, it’s important to find a balance between porosity and sample thickness to achieve the desired acoustic performance while also considering practical and structural constraints.
The tortuosity
The tortuosity of a fibrous sound absorber affects its NRC by increasing the flow resistance of the material, thereby enhancing its sound absorption capabilities. Tortuosity refers to the degree of curvature in the path traveled by sound waves as they propagate through the material. 47
Higher tortuosity creates a longer and more convoluted path for sound waves to travel through the absorber, increasing the complexity of their journey. This increased path length results in greater interactions between the sound waves and the fibrous material, leading to more opportunities for the sound energy to be dissipated and converted into heat. Therefore, higher tortuosity can contribute to improved acoustic performance by enhancing the sound absorption capabilities of the material.
In Figure 8, the calculated Noise Reduction Coefficient (NRC) values for all examined samples fall within the range of 0.47 to 0.8, which is rated between excellent to good absorber design.
Comparison between the sound absorption of the combination of spinning and weaving waste
This type of absorber utilizes several types of waste to improve its absorption capacity. In this study, an investigation was conducted to explore the effectiveness of various combinations of spinning and weaving waste in forming a sound absorber.
Figures 9 and 10 illustrate the impact of different combinations of spinning and weaving waste on the Sound Absorption Coefficient (SAC) and Noise Reduction Coefficient (NRC). The sound absorption coefficient of combination spinning and weaving waste. Noise reduction coefficient of different sound absorbers from combinations of spinning and weaving mill waste.
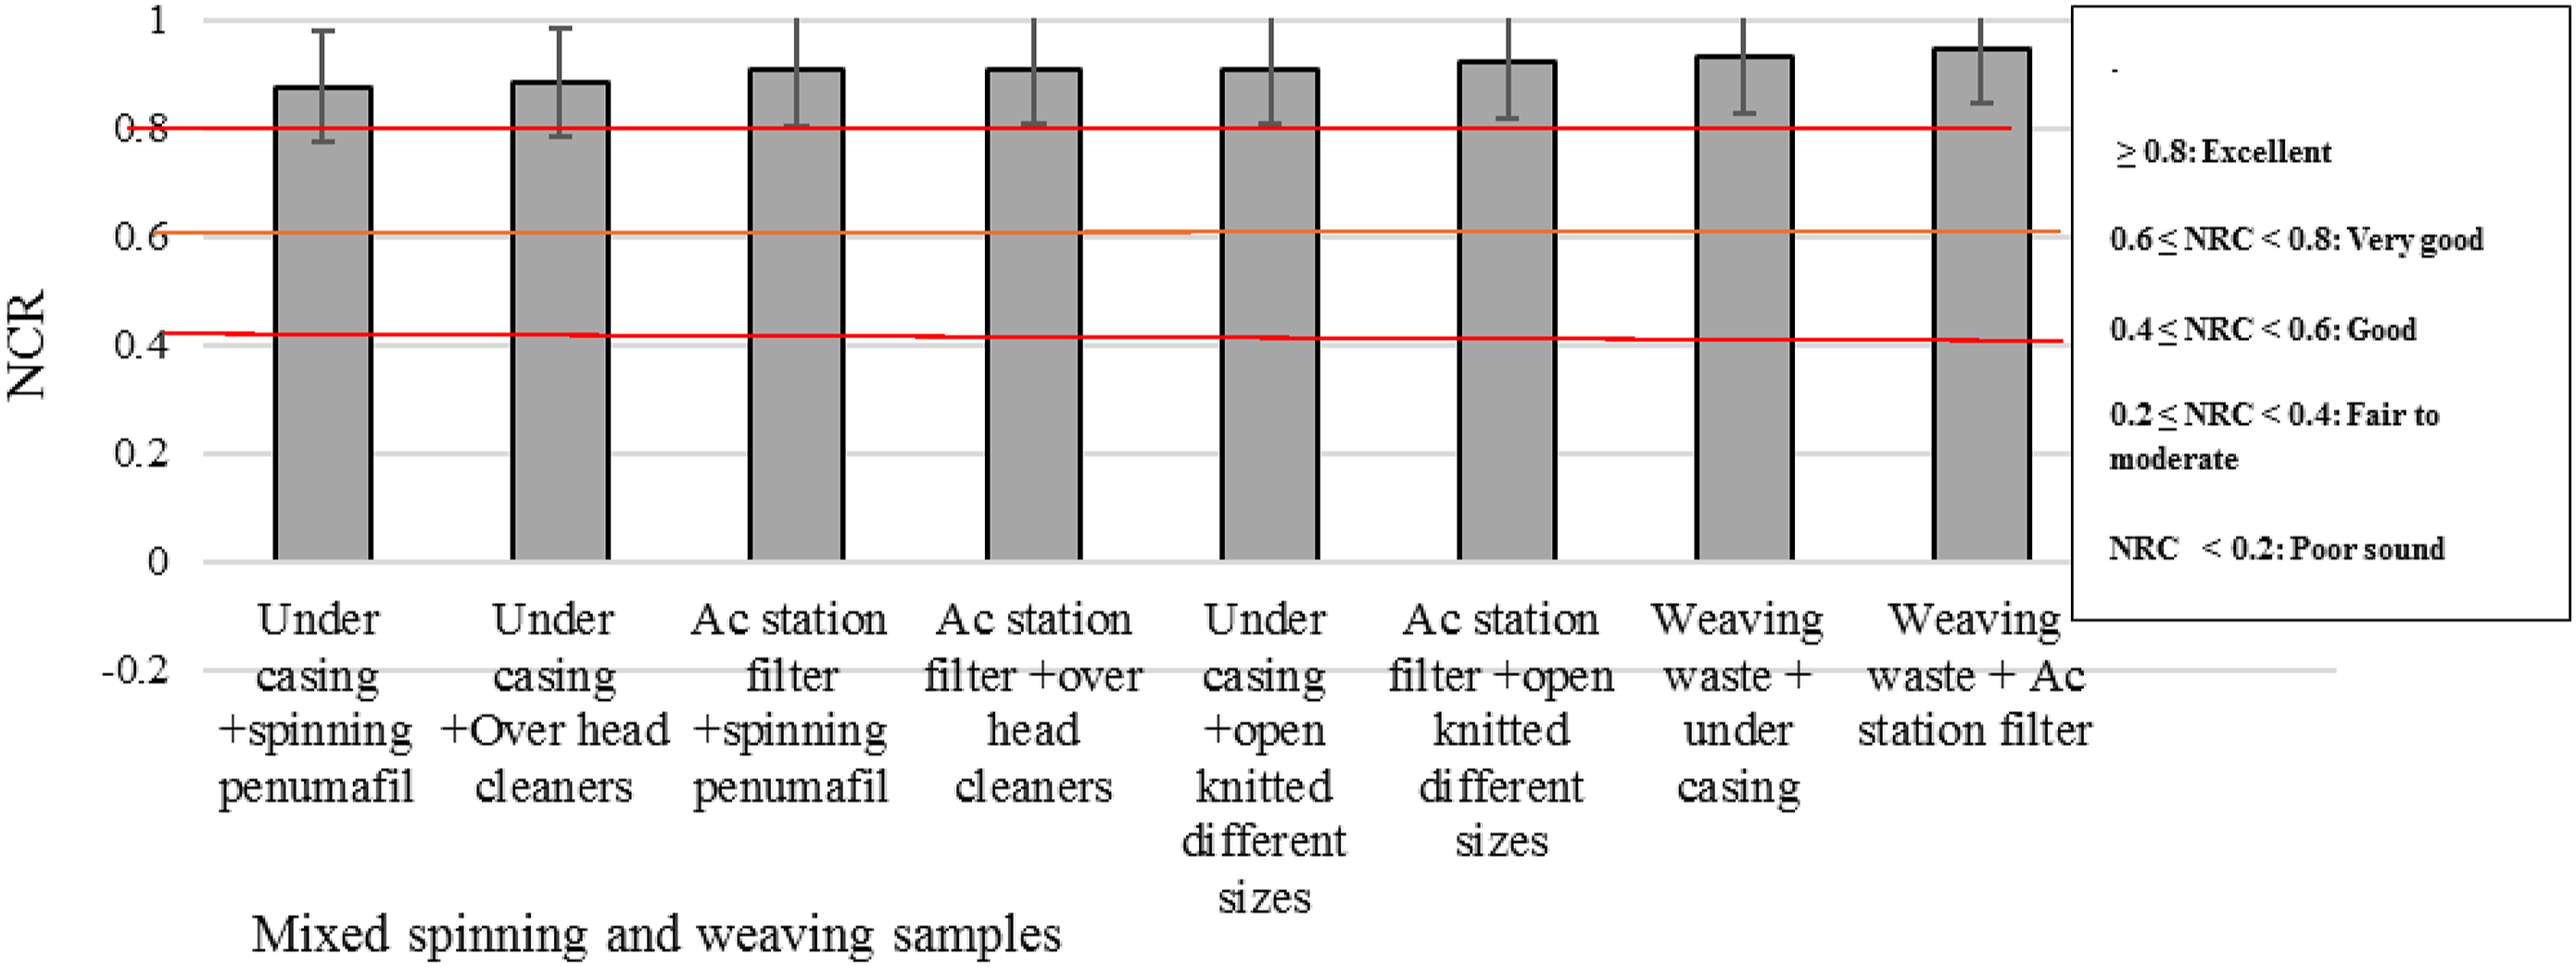
All selected combinations of waste samples demonstrate excellent ratings for the Noise Reduction Coefficient (NRC), as depicted in Figure 10.
In the case of waste fibers, a hybrid absorber structure shows improved absorption in the mid and high-frequency range due to increased density, tortuosity, and flow resistivity through the thickness [54]. Overall, textile materials offer a versatile and effective solution for creating sound absorbers due to their ability to manipulate density, porosity, and other acoustic properties.
Sound transmission loss measurements of the waste absorber samples
Sound Transmission Loss (STL) is a measure of how effectively a material or structure reduces the transmission of sound from one side to the other, representing the difference in sound intensity levels between the source side and the receiving side of the material (all the samples have the same weight of 7.5 gm). The STL can be affected by the material type and absorber structure. Figure 11(a)–(c) show the value of STL of the different sound absorbers made of spinning, weaving, and mixing of both wastes at different sound frequencies. a, b, c. The value of sound transmission loss (STL) of the different sound absorbers made of pre-consumer textile waste. (a) Sound transmission losses for spinning waste samples, (b) Sound transmission losses for weaving waste samples, (c) Sound transmission losses for mixed samples from spinning and weaving waste.
The results revealed that the panels made of waste material exhibited STL ranging from 8 dB to 46 dB within the low-frequency range of 500 Hz to 2000 Hz. This indicates that waste from spinning and weaving processes is effective for absorbing sound at frequencies up to 2000 Hz. The value of STL increases for higher frequencies, reaching up to 46 for samples ID 20, 21, 22, and 23. This improvement enhances the sound absorption performance for both types of textile waste. Furthermore, integrated materials may possess a superior internal structure for sound absorption due to the combination of fibrous material with yarns.
A setup, depicted in Figure 3, was used to measure the variation of sound pressure across the absorber panel area in both the X and Y directions. The comparison between the sound pressure measurements obtained using this apparatus and those obtained using other methods shows a high degree of agreement, as illustrated in Figure 12. Comparison between new quick sound absorber apparatus and reverberation room method measurements.
Figure 13 shows the variation of the sound pressure across the sample. This may be due to the geometric configuration of the absorber at the measured area, such as its porosity, density, or tortuosity, which can impact the dispersion and diffusion of sound waves. Sound contour over absorber area measurement refers to the measure of the distribution of sound levels across a sample area. This is important for assessing the effectiveness of sound-absorbing materials in reducing sound reflections and improving overall acoustic performance. Sound pressure variability across the sample in the X and Y directions.
Analysis of sound contour over absorber panel area
A sound contour over an absorber panel area is a graphical representation of the sound pressure level distribution over a specific area of sound absorbers. It illustrates how sound energy is absorbed by the material and how pressure levels vary across the area. Begin by identifying specific points within the absorber area where sound levels need to be measured. These points are typically distributed in a grid pattern to effectively cover the entire area. Sound level meters are then placed at each measurement point to capture sound levels at those locations. Figure 14 displays the measurement points over the panel area. Locations for measuring sound absorption across the panel area.
Creating sound contours is a valuable tool for assessing the spatial distribution of sound levels and optimizing the structure and design of sound absorbers. Sound levels are recorded at each measurement point, and the collected data is then used to create a graphical representation of the sound contour over the absorber area, as shown in Figure 15. Measured sound pressure contour map at 1500 Hz.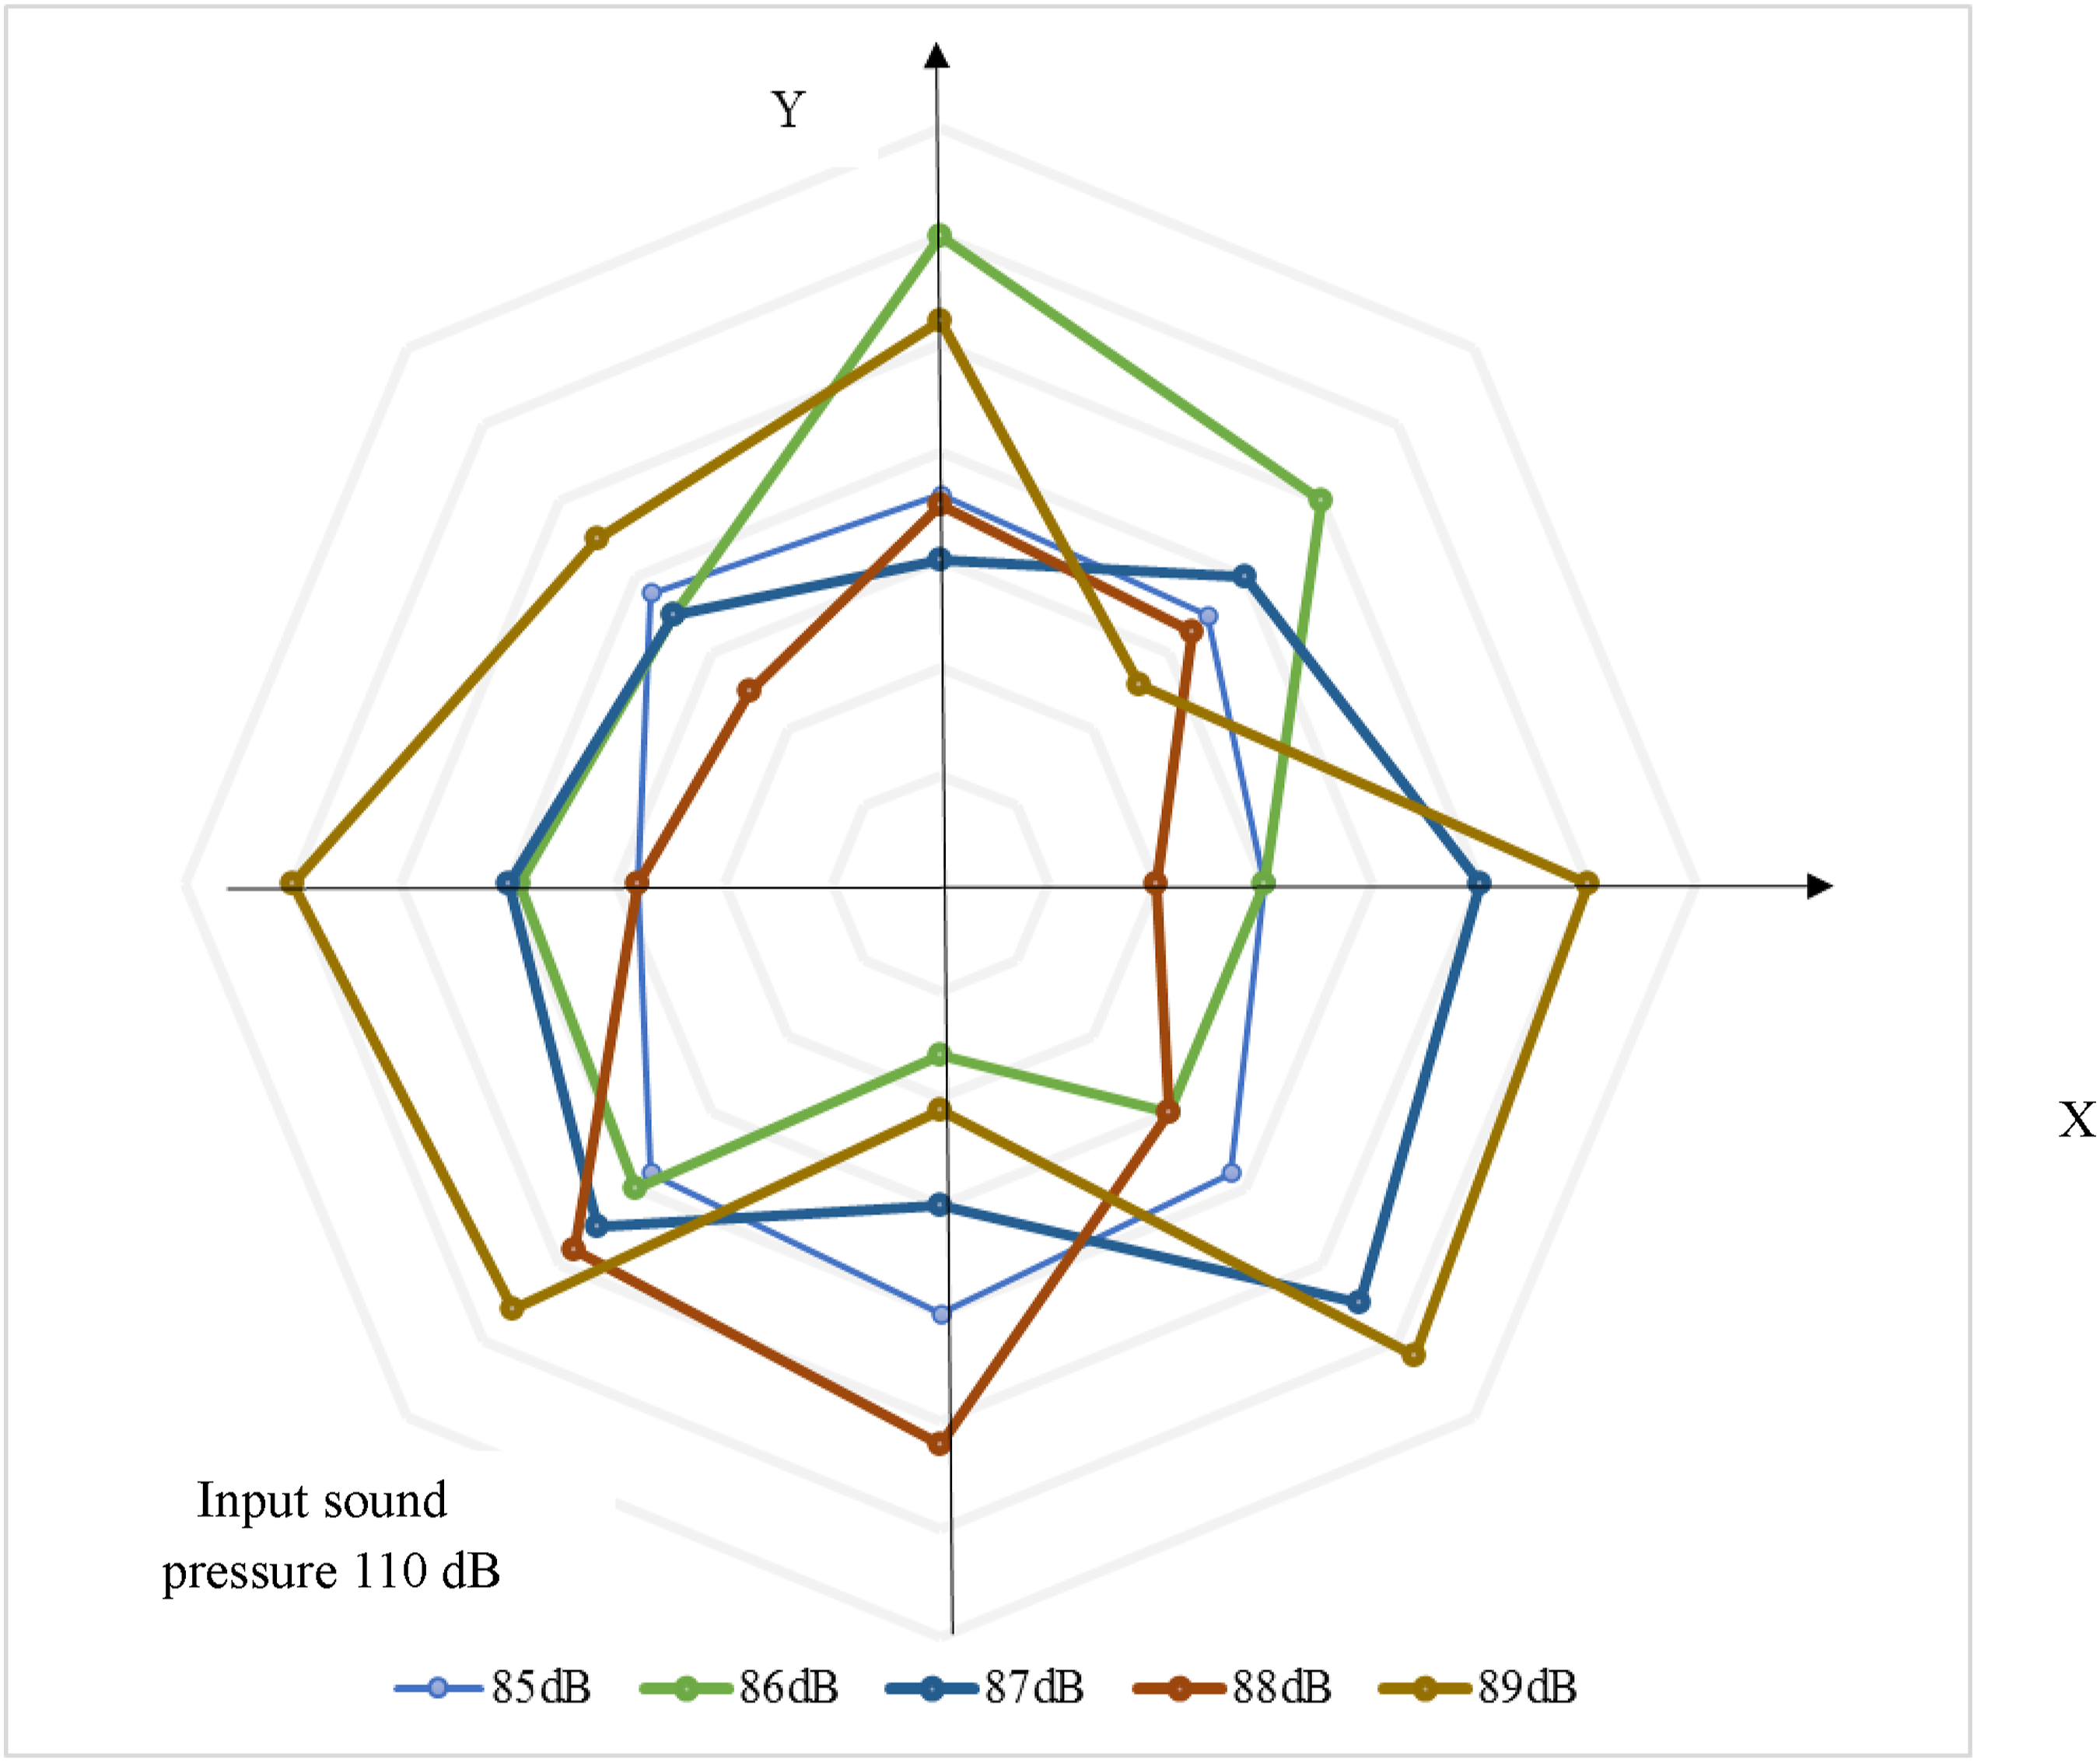
Sound contour map at a frequency of 1500 Hz for hybrid samples.

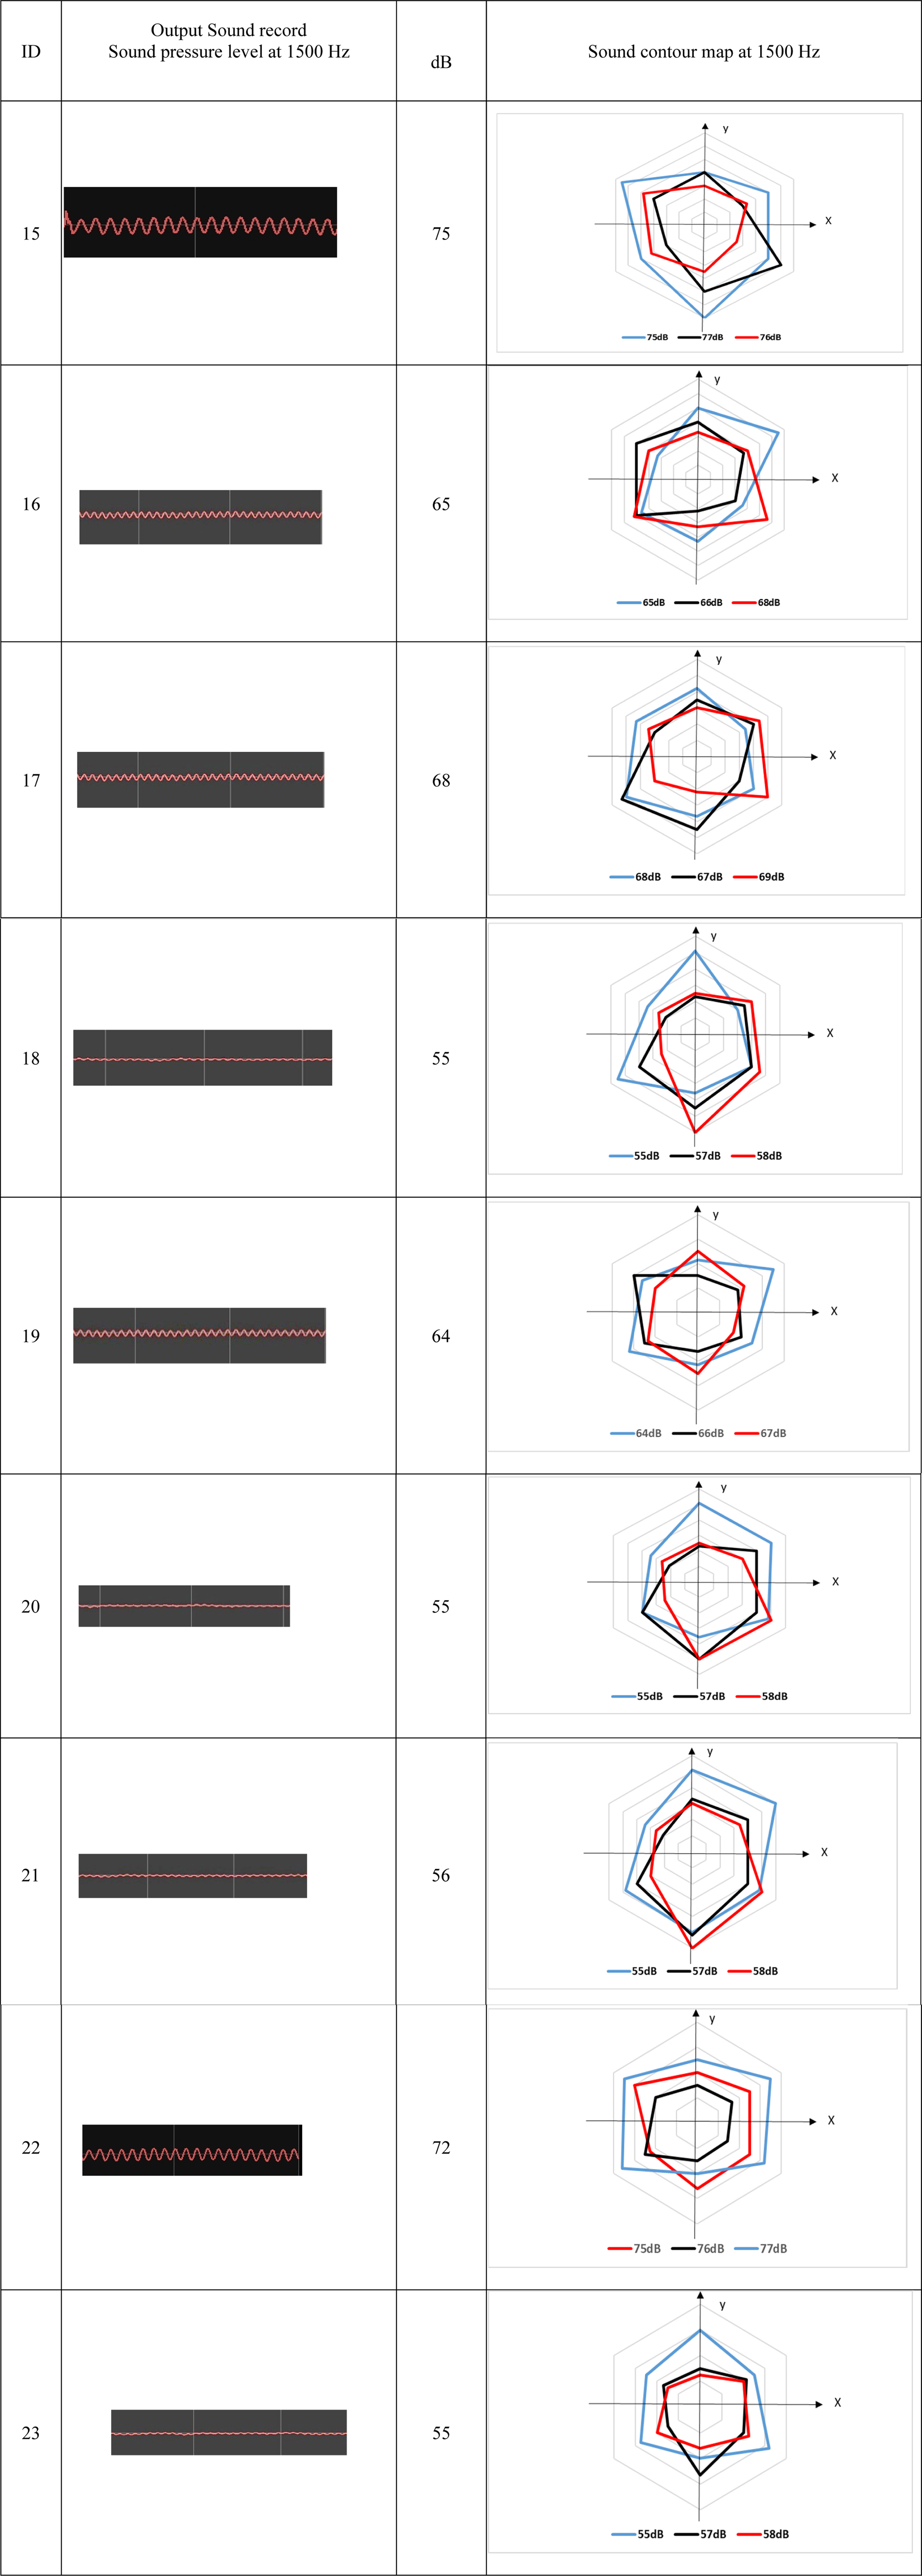
Table 5 presents the measured sound contour at a frequency of 1500 Hz using different sound absorber designs, demonstrating that samples 18, 20, 21, and 23 yield the best results. The sound contour indicates the uniformity of the structure of these samples.40–49
Conclusions
This study compares the Sound Absorption Coefficient of various types of waste extracted from spinning and weaving mills. The sound absorption coefficient was measured for all designed samples and the noise reduction coefficient (NRC) results enable us to compare the absorption capacity of various waste sound absorbers. Combining spinning and woven waste has advantages in improving sound absorption properties.
The acoustic properties of soft boards crafted from waste yarns were discovered to closely resemble those of conventional boards or sound insulation products derived from renewable resources.
At a board density of 40 kg/m3, the value of the sound absorption coefficient varied from 0.4 to 0.9, and the noise reduction coefficient reached 0.65. The effect of several structural parameters including porosity, thickness, and areal density, tortuosity on sound transmission loss was analyzed. The knowledge of the material structure and its sound absorption effect enables the proper selection and design of sound absorber panels. A setup was designed to define the sound contour map of the absorber, aiding in the identification of the internal structure of the sound panel. The experimental data signifies that a laboratory procedure to measure sound absorption on a wide area can impact the dispersion and diffusion of sound
Footnotes
Declaration of conflicting interests
The author(s) declared no potential conflicts of interest with respect to the research, authorship, and/or publication of this article.
Funding
The author(s) received no financial support for the research, authorship, and/or publication of this article.