
Abstract
Introduction
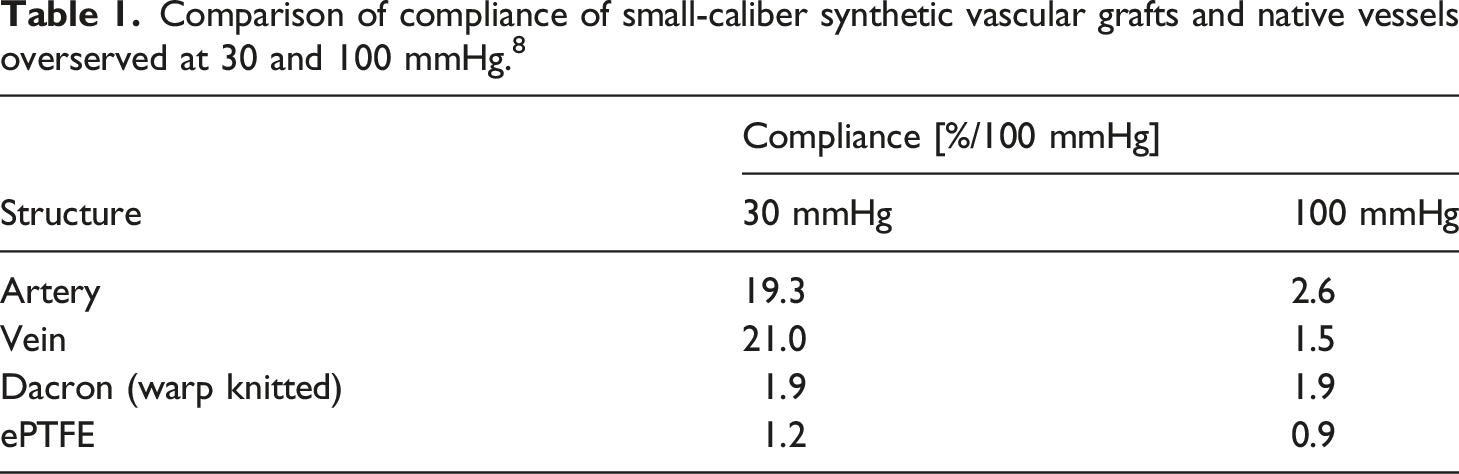
Cardiovascular disease is the leading cause of death worldwide. 1 At present, various synthetic vascular grafts made of polyester or expanded polytetrafluoroethylene (ePTFE) are being successfully used. However, small-caliber vascular grafts (diameter ≤6 mm) show low patency rates of less than 50 % at a 5-years follow-up. 2 One of the commonly named causes in literature is a compliance-mismatch between the vascular graft and the native vessel, which leads to neointimal hyperplasia and subsequent occlusion of the vascular graft.2–7 Particularly in the low physiological pressure range, synthetic vascular grafts cannot adequately represent the compliance behavior of native vessels.8–10 Autologous vascular prostheses therefore remain the gold standard for small-lumen vascular replacement. However, autologous vessels are limited in availability and often of poor quality.11,12 There is therefore a clear clinical need for a small-caliber vascular graft with physiological compliance properties.
Due to the mentioned deficits, many research groups are engaged in the development of small-caliber vascular grafts with physiological compliance. Essentially, the research work can be divided into two groups: the development of new biomaterials and tissue engineering. 13
In recent decades, the use of polyurethanes as alternative materials for vascular prostheses has been widely investigated.14,15 Polyurethanes comprise a wide range of materials that have low thrombogenicity and promising mechanical and physical properties that allow for a compliance comparable to a native artery. However, current polyurethane grafts are not able to mimic the complex stress-strain behavior of the native arteries and thus tend to dilate in the long term.
Comparison of compliance of small-caliber synthetic vascular grafts and native vessels overserved at 30 and 100 mmHg. 8
In the field of tissue engineering, various approaches to cultivate small-caliber vascular grafts have been pursued in recent years with promising results.21–24 However, there are a number of translation hurdles, such as guarantee of constant quality, since the cells are subject to individual qualitative fluctuations for each patient. Furthermore, a long production time and strict regulations make the transfer of these approaches into the clinic difficult. They are therefore to be regarded as an alternative for clinical routine in the long term.
In a simplified model, vascular compliance results on the behavior of two central extracellular protein components: collagen and elastin. With their circumferentially stretched arrangement, the elastin fibers ensure an even distribution of tension in the vessel wall and are decisive for the radial elastic properties of the vessels. The collagen fibers do not significantly contribute to the mechanical properties of the vascular wall in the low physiological pressure range due to its higher initial length and a winded structure. At higher pressures, the substantially stiffer collagen fibers are fully stretched and protect the vascular wall from overexpansion (Figure 1(a)).7,16
To address the compliance-mismatch of synthetic vascular grafts, we investigated the influence of the material and structural elasticity on the compliance behavior of small caliber implant structures gaining for a stress-strain behavior adapted to the native artery. Through a specific combination of the structural elasticity of a warp knitted textile structure with the material elasticity of the incorporated TPU (thermoplastic polycarbonate urethanes) and PVDF (polyvinylidene fluoride) yarns, we aim to biomimic the stress-strain behavior of the native artery (Figure 1(b)).
Materials & methods
Materials
For the non-elastic yarn component, a PVDF multifilament yarn with a linear density of 150 dtex and 48 individual filaments (Lenofil®, Lenzing Plastics, Lenzing, Austria) was used. PVDF shows very good biocompatibility and is already being used in medical implants. Compared to polyethylene terephthalate (PET), which is widely used in textile implants, PVDF has a better chemical resistance and thus long term durability in vivo, as well as better elasticity and tensile strength. 25 The linear density of 150 dtex was the smallest linear density of commercially available multifilament PVDF yarns and is within the range of yarns used in commercial vascular grafts as well as current research approaches in the field of vascular grafts for open surgery.17,26 In order to obtain a dense structure with good flexibility as well as to allow good ingrowth of the cells of the surrounding tissue into the graft, a multifilament yarn was used, as is also common in vascular grafts for open surgery.
The group of polycarbonate urethanes was selected as the polymer for the elastic yarn component. Compared to other polyurethanes, these TPUs have the highest resistance to oxidative and hydrolytic degradation27,28 and are therefore particularly suitable for use in long-term implant applications. Furthermore, polycarbonate urethanes have good properties with regard to stress corrosion cracking, which is of importance for the elastic properties and the use of the TPU in vascular grafts. Another advantage of polycarbonate urethanes is a reduced platelet activation and a reduced inflammatory response. 29
The following polymers of the Chronoflex polymer group from AdvanSource Biomaterials Corporation (Wilmington, Massachusetts, USA) were considered as polymer for yarn production: Chronoflex AL 93A, Chronoflex AL 55D, Chronoflex AL 75D, Chronoflex C 93A and Chronoflex C 75D. The polymer selection covers the entire spectrum from aromatic/aliphatic and high to low Shore hardness of the polymers identified within the material research. The selected polymers were screened in preliminary tests on a single-screw extruder melt spinning machine (Fourné Polymertechnik, Alfter-Impekoven, Germany) with regard to their processability into multifilaments. Based on the results of the spinning tests, the polymer Chronoflex C 93A was selected for the production of the TPU yarn.
TPU yarn production
The polymer granulate was dried in a vacuum oven at 80°C for 10 hours before melt spinning. The yarns were produced on a single-screw extruder melt spinning machine (Fourné Polymertechnik GmbH, Alfter-Impekoven, Germany) with a constant feed rate of 4.2 cm³/min at a spinning head temperature of 218°C. After application of a spin finish (Limanol LB 25/10), the yarn was drawn off by means of a mono-galette with a spinning draft between 15 and 61. Subsequently, the multifilaments were drawn over two duo-galettes with a heating section in between. The drawing was performed with a draw ratio between one and three and a drawing temperature between 20°C (room temperature) and 110°C. The titer of the yarn was determined by the winding speed in relation to the constant feed rate of the extruder. The winding speed was set in the range between 90 and 129 m/s. The multifilament yarn consisted of 30 filaments and had a target mean linear density of 150 dtex in order to match the linear density of the PVDF yarn. The number of filaments had to be reduced compared to the PVDF yarn (48 filaments), as otherwise no spinnability could be ensured in the melt spinning process at the specified linear density.
The passage of a further heating section following the drawing process enabled a relaxation of the multifilament yarns. Due to relaxation forces and internal tensions of the yarns after the melt spinning process, uneven creeping can occur on the bobbin until further processing. The heat treatment was intended to reduce of internal stresses. The relaxation temperature was set to 24°C to 80°C.
Textile structure
In order to mimic the vessel wall structure of the native artery consisting of elastin fibers and collagen fibers, elastic TPU fibers were combined with non-elastic PVDF fibers in a tubular fabric by use of warp knitting technology. The textile structures were manufactured on a double-face Raschel machine (DR 16 EEC/EAC, Karl Mayer Textilmaschinenfabrik, Obertshausen, Germany) with a gauge of 30 needles per inch.
With regard to the stitch construction, the counter-lapping 1 × 1 lap - 2 × 1 lap (locknit) has proven in the past to be particularly suitable for elastic fabrics. This lapping combination has also proven successful for the manufacturing of today’s synthetic vascular grafts. 18 The underlap of the 2 × 1 lapping is twice as long as that of the 1 × 1 lapping and therefore significantly more aligned in the circumferential direction of the tubular textile structure. For this reason, the elastic TPU yarn was used for the manufacturing of the 2 × 1 lapping, which is intended to mimic the function of the aligned elastin fibers in the native artery. Due to the larger angle of the underlaps of the 1 × 1 lapping to the circumferential direction of the textile structure, they are only aligned under radial elongation of the tubular structure and contribute to load bearing. For this reason, the non-elastic PVDF yarn was used for the manufacturing of the 1 × 1 lapping, which is intended to mimic the function of the tangled collagen fibers in the native artery.
In order to ensure a stable process, the elastic yarn had to be fed into the warp knitting machine at a constant thread tension. Therefore, electronic yarn feeders (Ultrafeeder, BTSR International, Olgiate Olona, Italy) were installed at the warp knitting machine, enabling a tension-controlled feed in of every TPU-yarn. The yarn was fed directly into the knitting area without further deflection to avoid variations in tension.
The density of the warp knitted fabric is tailorable by varying the stitch course density. The determined process window for the stitch course density was between 8 and 14 stiches/cm. The morphological and mechanical properties of the textile structure can also be adapted by the thread tension of the elastic TPU yarn in the determined process window of 1 to 10 cN.
The textile structures were produced with 36 threads per lapping and a targeted diameter of the tubular structure of 6 mm. Due to influences of the investigated process parameters on the radial shrinkage of the textile in the warp knitting process, the produced samples had actual diameters between 5.0 and 6.5 mm with a mean diameter of 5.9 mm.
Experimental design
Definition of operating field
Factors and factor levels of the definition of operating field.

The statistical evaluation of the results was performed using the software Minitab (Minitab Inc., State College, USA) version 20.1. For each response, a model of the main effects of the five factors examined was calculated. In order to minimize the measurement noise caused by non-significant effects, the model was recalculated stepwise without the non-significant factors (factor elimination). 30 A confidence level of 95 % was considered for the factor elimination.
Optimization
Factors and factor levels of the optimization.

The statistical evaluation of the results was carried out according to the definition of operating field by first calculating a model of the main effects of the three factors examined for each response and subsequently recalculating the model without the non-significant effects (factor elimination). 30 A confidence level of 95 % was considered for the factor elimination.
Testing
Yarn characterization
For characterization of the yarns, the linear density, tenacity, breaking elongation, elastic strain fraction and Young’s modulus were tested on a tensile testing machine (zwickiLine Z2.5, Zwick/Roell, Ulm, Germany). The tenacity and breaking elongation were tested in accordance with the DIN EN ISO 2062 standard. 31 The elastic strain fraction was tested referring to the DIN 53835-2 standard. 32 The linear density was tested in accordance with the DIN EN ISO 2060 standard 33 using a wrap reel (Type 231/1B, Zweigle KG, Reutlingen, Germany). The Young’s modulus was calculated from the secant modulus in the linear-elastic region of the stress-strain curve of the tenacity test within the limits of 0 and 50 % elongation. The characterization of the yarn with the above tests was performed on the samples of the definition of operating field.
Textile characterization
For characterization of the textile structure, the effective stitch course density, effective stitch wale density and wall thickness were tested. The effective stitch course density and effective wale density were tested in accordance to the DIN EN 14971 standard 34 with a stereo microscope (M205C, Leica Microsystems GmbH, Wetzlar, Germany). The wall thickness was tested in accordance to the EN ISO 5084 standard 35 using a thickness gauge (DMD 3, Wolf-Messtechnik GmbH, Freiberg, Germany). The characterization of the textile with the above tests was performed on the samples of the definition of operating field.
Compliance testing
The load case of the graft fabric under pressure load was transferred to the load case in a tensile test. It was assumed that the tangential wall stress σ
t
of the knitted fabric is decisive for the radial compliance at a given inner pressure p (Figure 2(c)). The tangential wall stress σ
t
was equated with the wall stress σ
z
in the circumferential tensile test (Figure 2(b)) in order to establish a relationship between the force F in the tensile test and the inner pressure p in the graft. For this purpose, the specimen was clamped between two pins and subjected to tensile stress according to the standard ISO 7198
36
(Figure 2(a)). Test setup for testing the compliance with a tensile tester (left), load case of the graft during the tensile test (middle) and load case of the graft under pressure load (right).
The wall stress σ
z
of the graft in the tensile test was calculated using the following formula (Figure 2(b)):
The tangential wall stress σ
t
of the vascular graft under pressure load was approximated using the Barlow’s formula
37
(Figure 2(c)):
By equating the wall stress for both loading cases, the correlation between the pressure load in the compliance test and the corresponding tensile load in the tensile test can be determined to: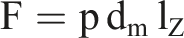
The grafts were cut to a length of 17 mm. The length of the samples results from the load limit of the used load cell in combination with the required maximum load of the samples (120 mmHg pressure equivalent). Using a standardized steel ruler (resolution: 0.5 mm), the length of the specimens was controlled following cutting. The tensile test was performed on a tensile testing machine (Z100, Zwick/Roell, Ulm, Germany). The samples were clamped between two pins, each with a diameter of 1.5 mm. The force and the gauge length (distance between the upper edge of the upper pin and the lower edge of the lower pin) were measured and plotted. The samples were loaded three times in sequence to ensure that the specimens were aligned between the pins. The testing speed was 5 mm/min. Using the gauge length and the diameter of the pins, the inner circumference of the specimen was calculated:
Considering the wall thickness of the textile, the mean diameter of the graft was calculated. Subsequently, by plotting the mean diameter of the graft under load versus the corresponding pressure equivalent of the tensile stress, the compliance C was calculated according to the ISO 7198 standard:
36

The compliance was determined at tensile stresses corresponding to mean pressures from 20 mmHg to 120 mmHg and a pressure difference equivalent p 2 -p 1 of 10 mmHg. Since the wall stress in the graft depends on both the internal pressure and the diameter of the graft (Figure 2(b)), the calculation of the correlation between force F in the tensile test and the pressure p is based on the actual diameter of the graft at the applied force according to the formula F = p d m l Z explained above.
The evaluation of the compliance was performed on both the samples of the definition of operating field and the optimization.
An extruded ePTFE vascular graft with a diameter of 6.0 mm (FlixeneTM Vascular Graft, Atrium Medical Corporation, New Hampshire, USA) and a native sheep artery (carotid artery) with a diameter of 5.5 mm were tested as benchmarks. The number of samples for both benchmark measurements was n = 3.
Results
Yarn production
A stable spinning process could be set for each test point for both the definition of operating field and the optimization.
The linear density of the spun yarns ranged from 108.0 to 209.2 dtex with a mean linear density across all experimental points of 151.6 dtex. The mean standard deviation for all experiments was 1.33 dtex, which corresponds to a coefficient of variation of 0.9 %. Statistically significant main effects on the linear density were determined for the factors winding speed and draw ratio after factor elimination. The main effect of the winding speed was −58.8 dtex at p < .001 and the main effect of the draw ratio was 26.1 dtex at p = .002.
The tenacity of the yarns ranged from 4.78 to 21.42 cN/tex with a mean tenacity across all experimental points of 11.48 cN/tex. The mean standard deviation for all experiments was 1.10 cN/tex, which corresponds to a coefficient of variation of 9.2 %. A statistically significant effect on the tenacity was only determined for the factor draw ratio with a main effect of 8.45 cN/tex at p = .007 after factor elimination. The main effect of winding speed was also comparatively high at 5.22 cN/tex but statistically insignificant at p = .06.
The breaking elongation of the yarns ranged from 108.8 to 176.2 % with a mean value across all experimental points of 137.7 %. The mean standard deviation for all experiments was 13.4 %. The coefficient of variation of the breaking elongation (9.7 %) was thus at a similar level to that of the tenacity (9.2 %). A statistically significant effect on the breaking elongation was only determined for the factor draw ratio with a main effect of −50.0 % at p = .001 after factor elimination.
The values for the elastic strain fraction range between 95.3 % and 97.9 % with a mean value across all experimental points of 96.7 %. The mean standard deviation was 0.49 %, resulting in a low mean coefficient of variation of 0.5 %. A statistically significant effect on the elastic strain fraction was only determined for the factor draw ratio with a main effect of 1.8 % at p = .006 after factor elimination.
The Young’s modulus of the yarns ranged from 1.52 to 14.48 cN/tex with a mean Young’s modulus across all experimental points of 5.35 cN/tex. The mean standard deviation for all experiments was 0.59 cN/tex, which corresponds to a coefficient of variation of 11.9 %. Statistically significant main effects on the Young’s modulus were determined for the factors winding speed and draw ratio after factor elimination. The main effect of the winding speed was 2.14 cN/tex at p = .021 and the main effect of the draw ratio was 3.75 cN/tex at p = .001.
Summary of the results of the yarn characterization.

Textile production
Not all factor level combinations of the definition of operating field could be realized in the warp knitting process. For the high factor setting (10 cN) of the thread tension, yarn breaks occurred in the selvedge yarns at four experimental points. It was not possible to change the factor setting with other experimental points in order to maintain a balanced design of experiments. In order to ensure the production of the grafts, the thread tension at these four experimental points had to be reduced from 10 cN to 8 cN and 5.5 cN respectively. The non-orthogonality of the consequent design of experiments was taken into account in the statistical evaluation of the results. With the reduced settings of the thread tension, a flawless production of the grafts at all experimental points could be realized (Figure 3). Warp knitted grafts of different experimental points (a) and microscopic image of the textile structure of the graft (b).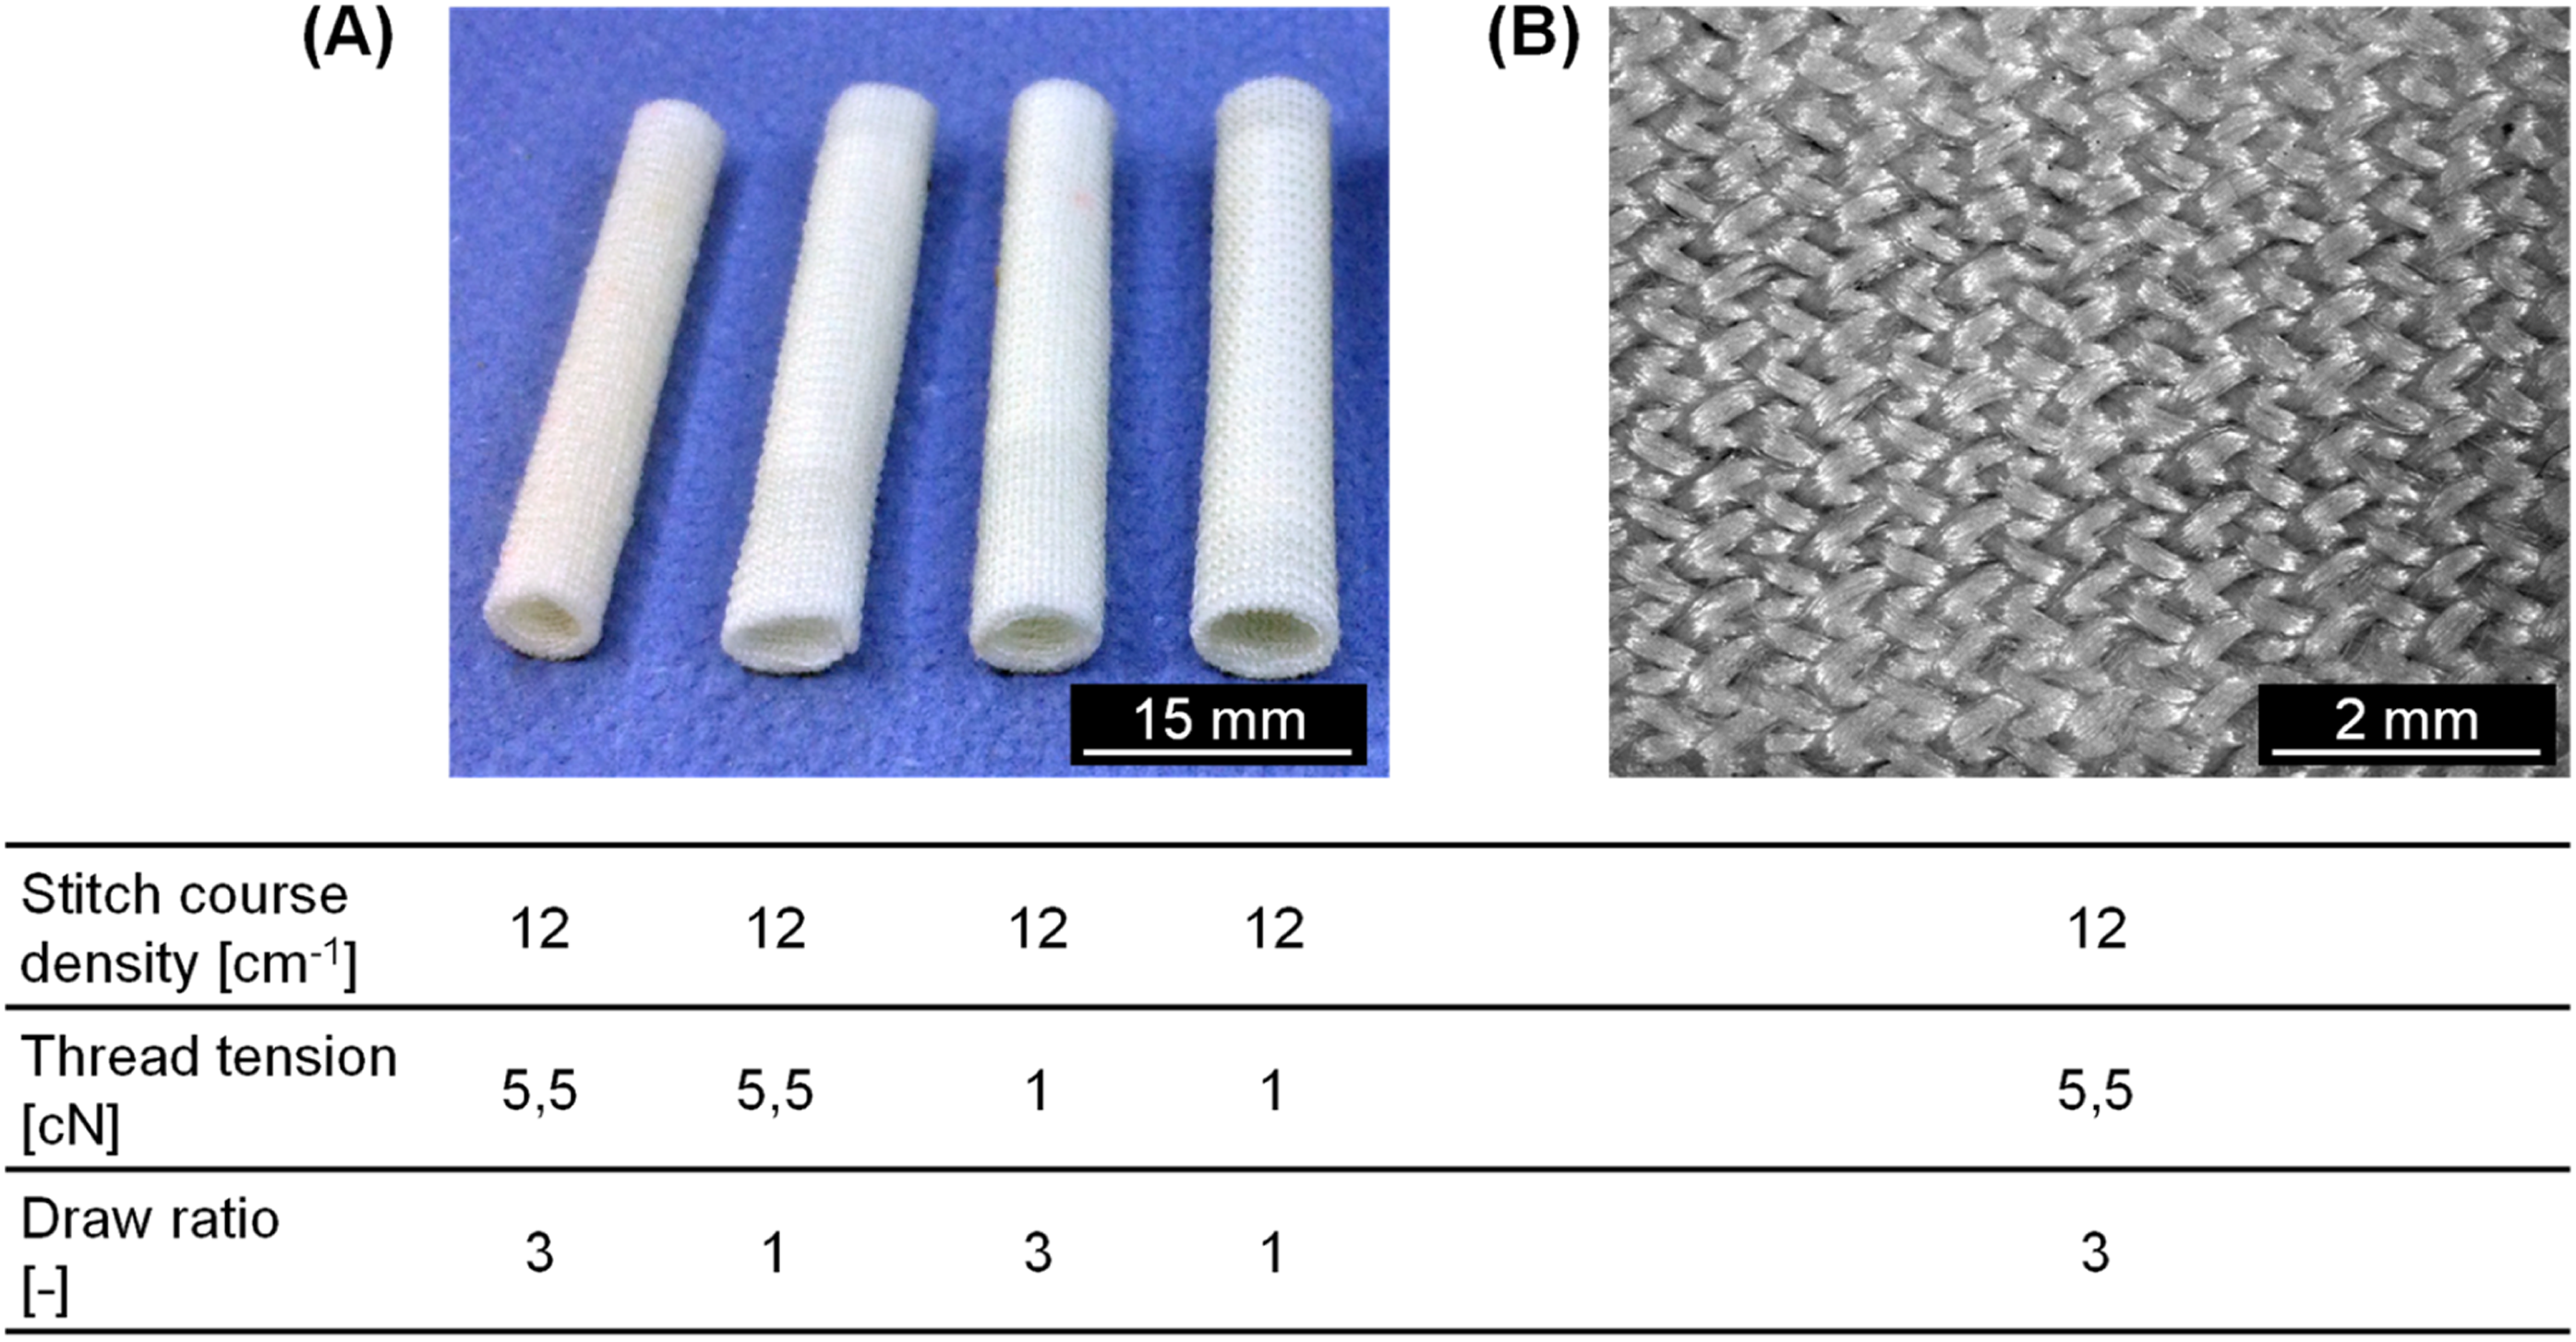
Due to the fact that the relaxation temperature had no statistically significant effects on the examined properties of the yarns, it was assumed that it also had no effect on the examined properties of the textile structure. For this reason, the factor relaxation temperature was removed from the statistical analysis by means of factor elimination for the following experiments.
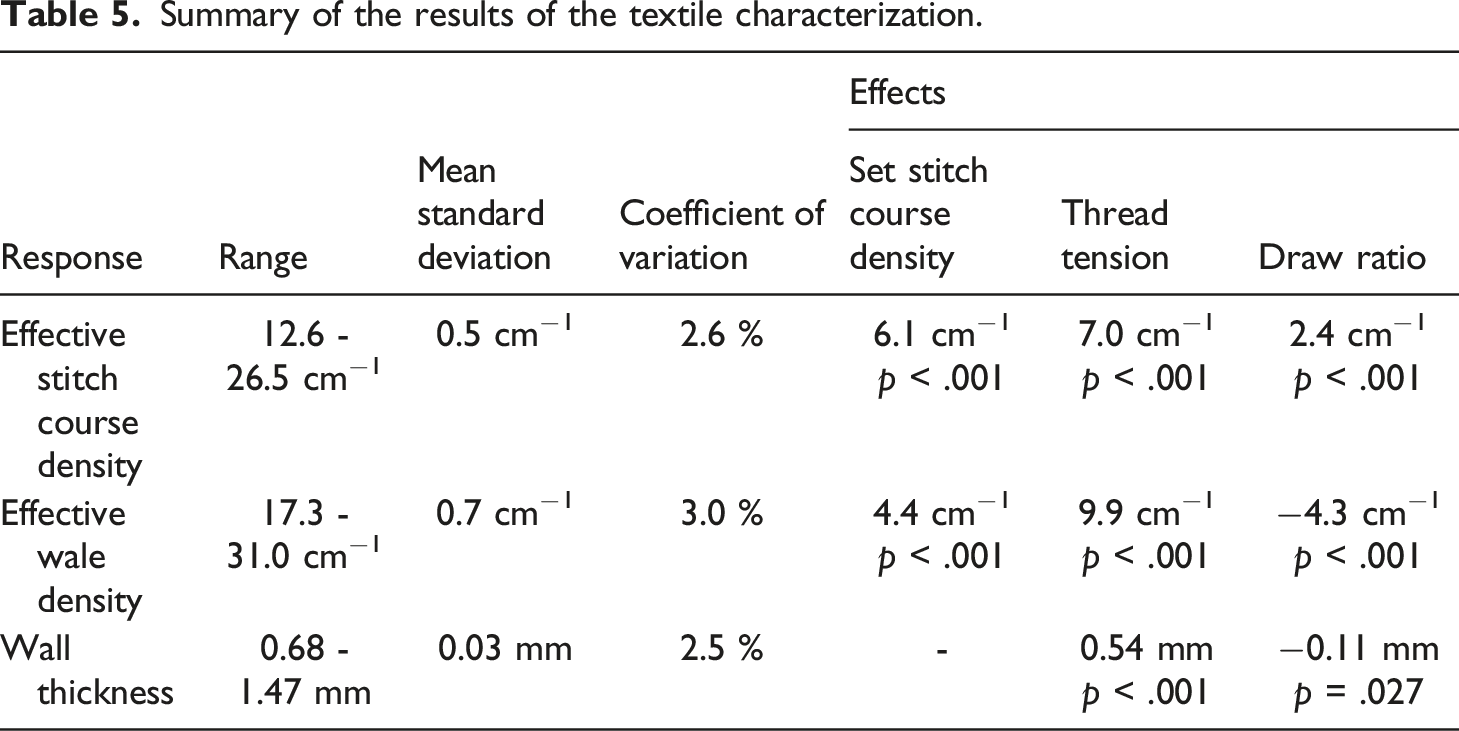
The effective stitch course density of the warp knitted grafts ranged from 12.6 to 26.5 cm−1. The mean standard deviation for all experiments was 0.5 cm−1, which corresponds to a low coefficient of variation of 2.6 %. The effective stitch course density was significantly higher than the set stitch course density for all experimental points. Statistically significant main effects on the effective stitch course density were determined for the factors draw ratio, stitch course density and thread tension after factor elimination. The main effect of the set stitch course density on the effective stitch course density was 6.1 cm−1 at p < .001. This effect is obvious and corresponds to the difference of 6.0 cm−1 of the two factor levels of the set stitch course density. The main effect of the thread tension on the effective stitch course density was 7.0 cm−1 at p < .001 and the main effect of the draw ratio was determined to 2.4 cm−1 at p < .001.
The effective wale density of the grafts ranged from 17.3 to 31.0 cm−1. The mean standard deviation for all experiments was 0.7 cm−1, which corresponds to a low coefficient of variation of 3.0 %. The effective wale density was significantly higher than the gauge of the machine (30 needles per inch respectively 11.8 needles per cm) for all experimental points. Statistically significant main effects on the effective wale density were determined for the factors draw ratio, stitch course density and thread tension after factor elimination. The major main effect was determined for the factor thread tension with 9.9 cm−1 at p < .001. The main effect of the set stitch course density was 4.4 cm−1 at p < .001 and the main effect of the draw ratio was determined to −4.3 cm−1 at p < .001.
The wall thickness of the grafts ranged from 0.68 to 1.47 mm. The mean standard deviation for all experiments was 0.03 mm, which corresponds to a low coefficient of variation of 2.5 %. Statistically significant main effects on the effective wale density were determined for the factors draw ratio and thread tension after factor elimination. The major main effect was determined for the factor thread tension with 0.54 mm at p < .001. The main effect of the draw ratio was −0.11 mm at p = .027.
Summary of the results of the textile characterization.
Compliance
The stress-strain curve from the tensile test of the second and third loading cycle were shifted to higher strain compared to the first loading cycle (Figure 4). This could be observed for all samples, as well as for the ePTFE and native vessel references. The results for the second and third loading cycles were nearly identical. It was assumed that the samples were slightly aligned during the first loading. In the following, the measurement data of the second loading cycle were evaluated. Since the stress-strain curves are identical after the first cycle, the grafts show a completely elastic behavior without irreversible plastic deformation within the investigated force range. The method used to determine compliance in the quasi-static tensile test is therefore considered valid. Exemplary stress-strain curve of the compliance measurement.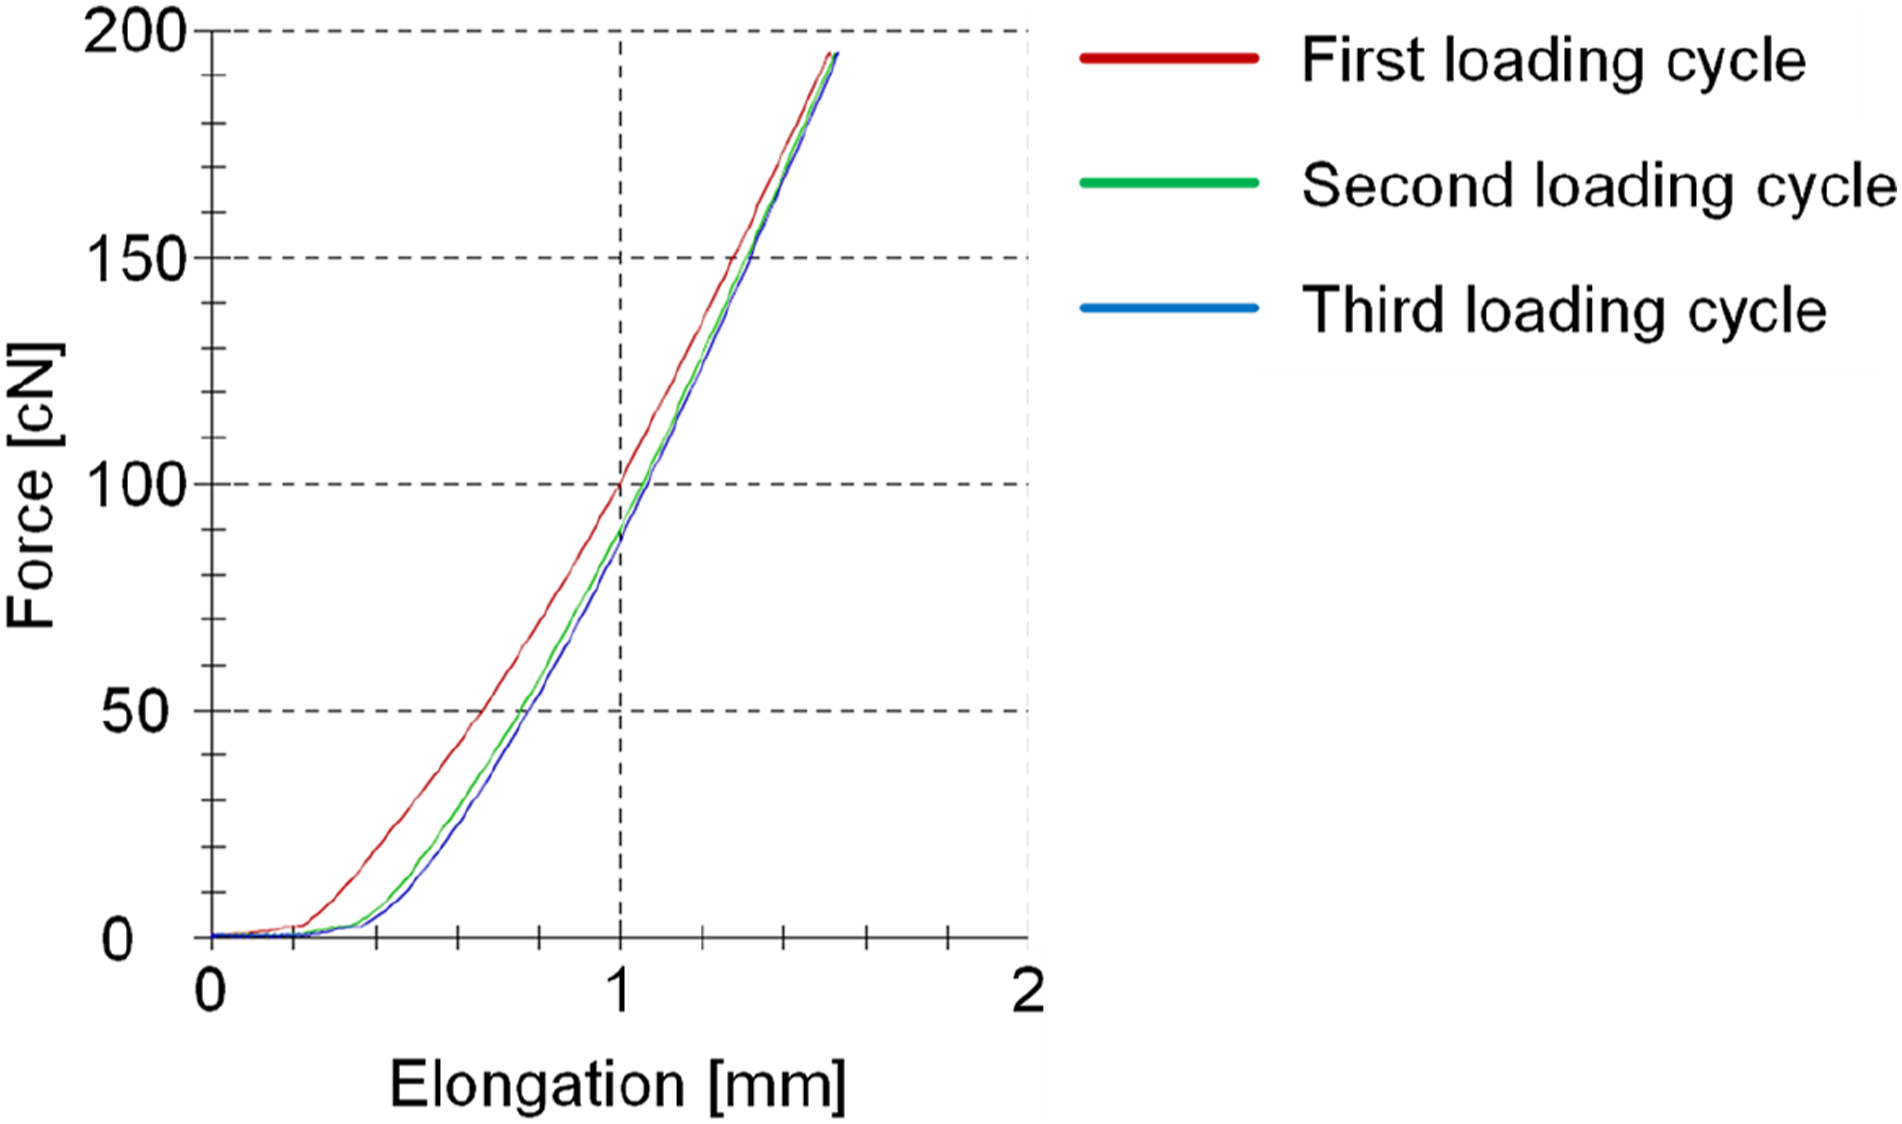
Definition of operating field
The compliance at a pressure of 30 mmHg within the definition of operating field ranged from 9 to 30%/100 mmHg with a mean value across all experimental points of 15.8%/100 mmHg. The mean standard deviation at 30 mmHg was 1%/100 mmHg. This corresponds to a mean coefficient of variation of 6.4%. The compliance at a pressure of 80 mmHg was lower for all experimental points and ranged from 7 to 25%/100 mmHg with a mean value across all experimental points of 13.6%/100 mmHg. The mean standard deviation of the compliance at 80 mmHg is 1%/100 mmHg, which is at the same level as the mean standard deviation of the compliance at 30 mmHg (mean coefficient of variation: 5.9 %).
After factor elimination the main effects of the factors stitch course density and draw ratio were determined as statistically significant both at a pressure of 30 mmHg and 80 mmHg. At a pressure of 30 mmHg the main effect of the stitch course density was −9.3%/100 mmHg at p < .001, while the main effect of the draw ratio was slightly lower with −7.6 %/100mmHg at p < .001. At a pressure of 80 mmHg the main effect of the stitch course density was −7.0 %/100 mmHg at p < .001, while the main effect of the draw ratio was equal with −6.9 %/100 mmHg at p < .001. The main effect plots of the compliance for the definition of operating field are shown in Figure 5. Main effect plot of the reduced model for the response compliance in the definition of operating field at a mean pressure equivalent of 30 mmHg (a) and 80 mmHg (b).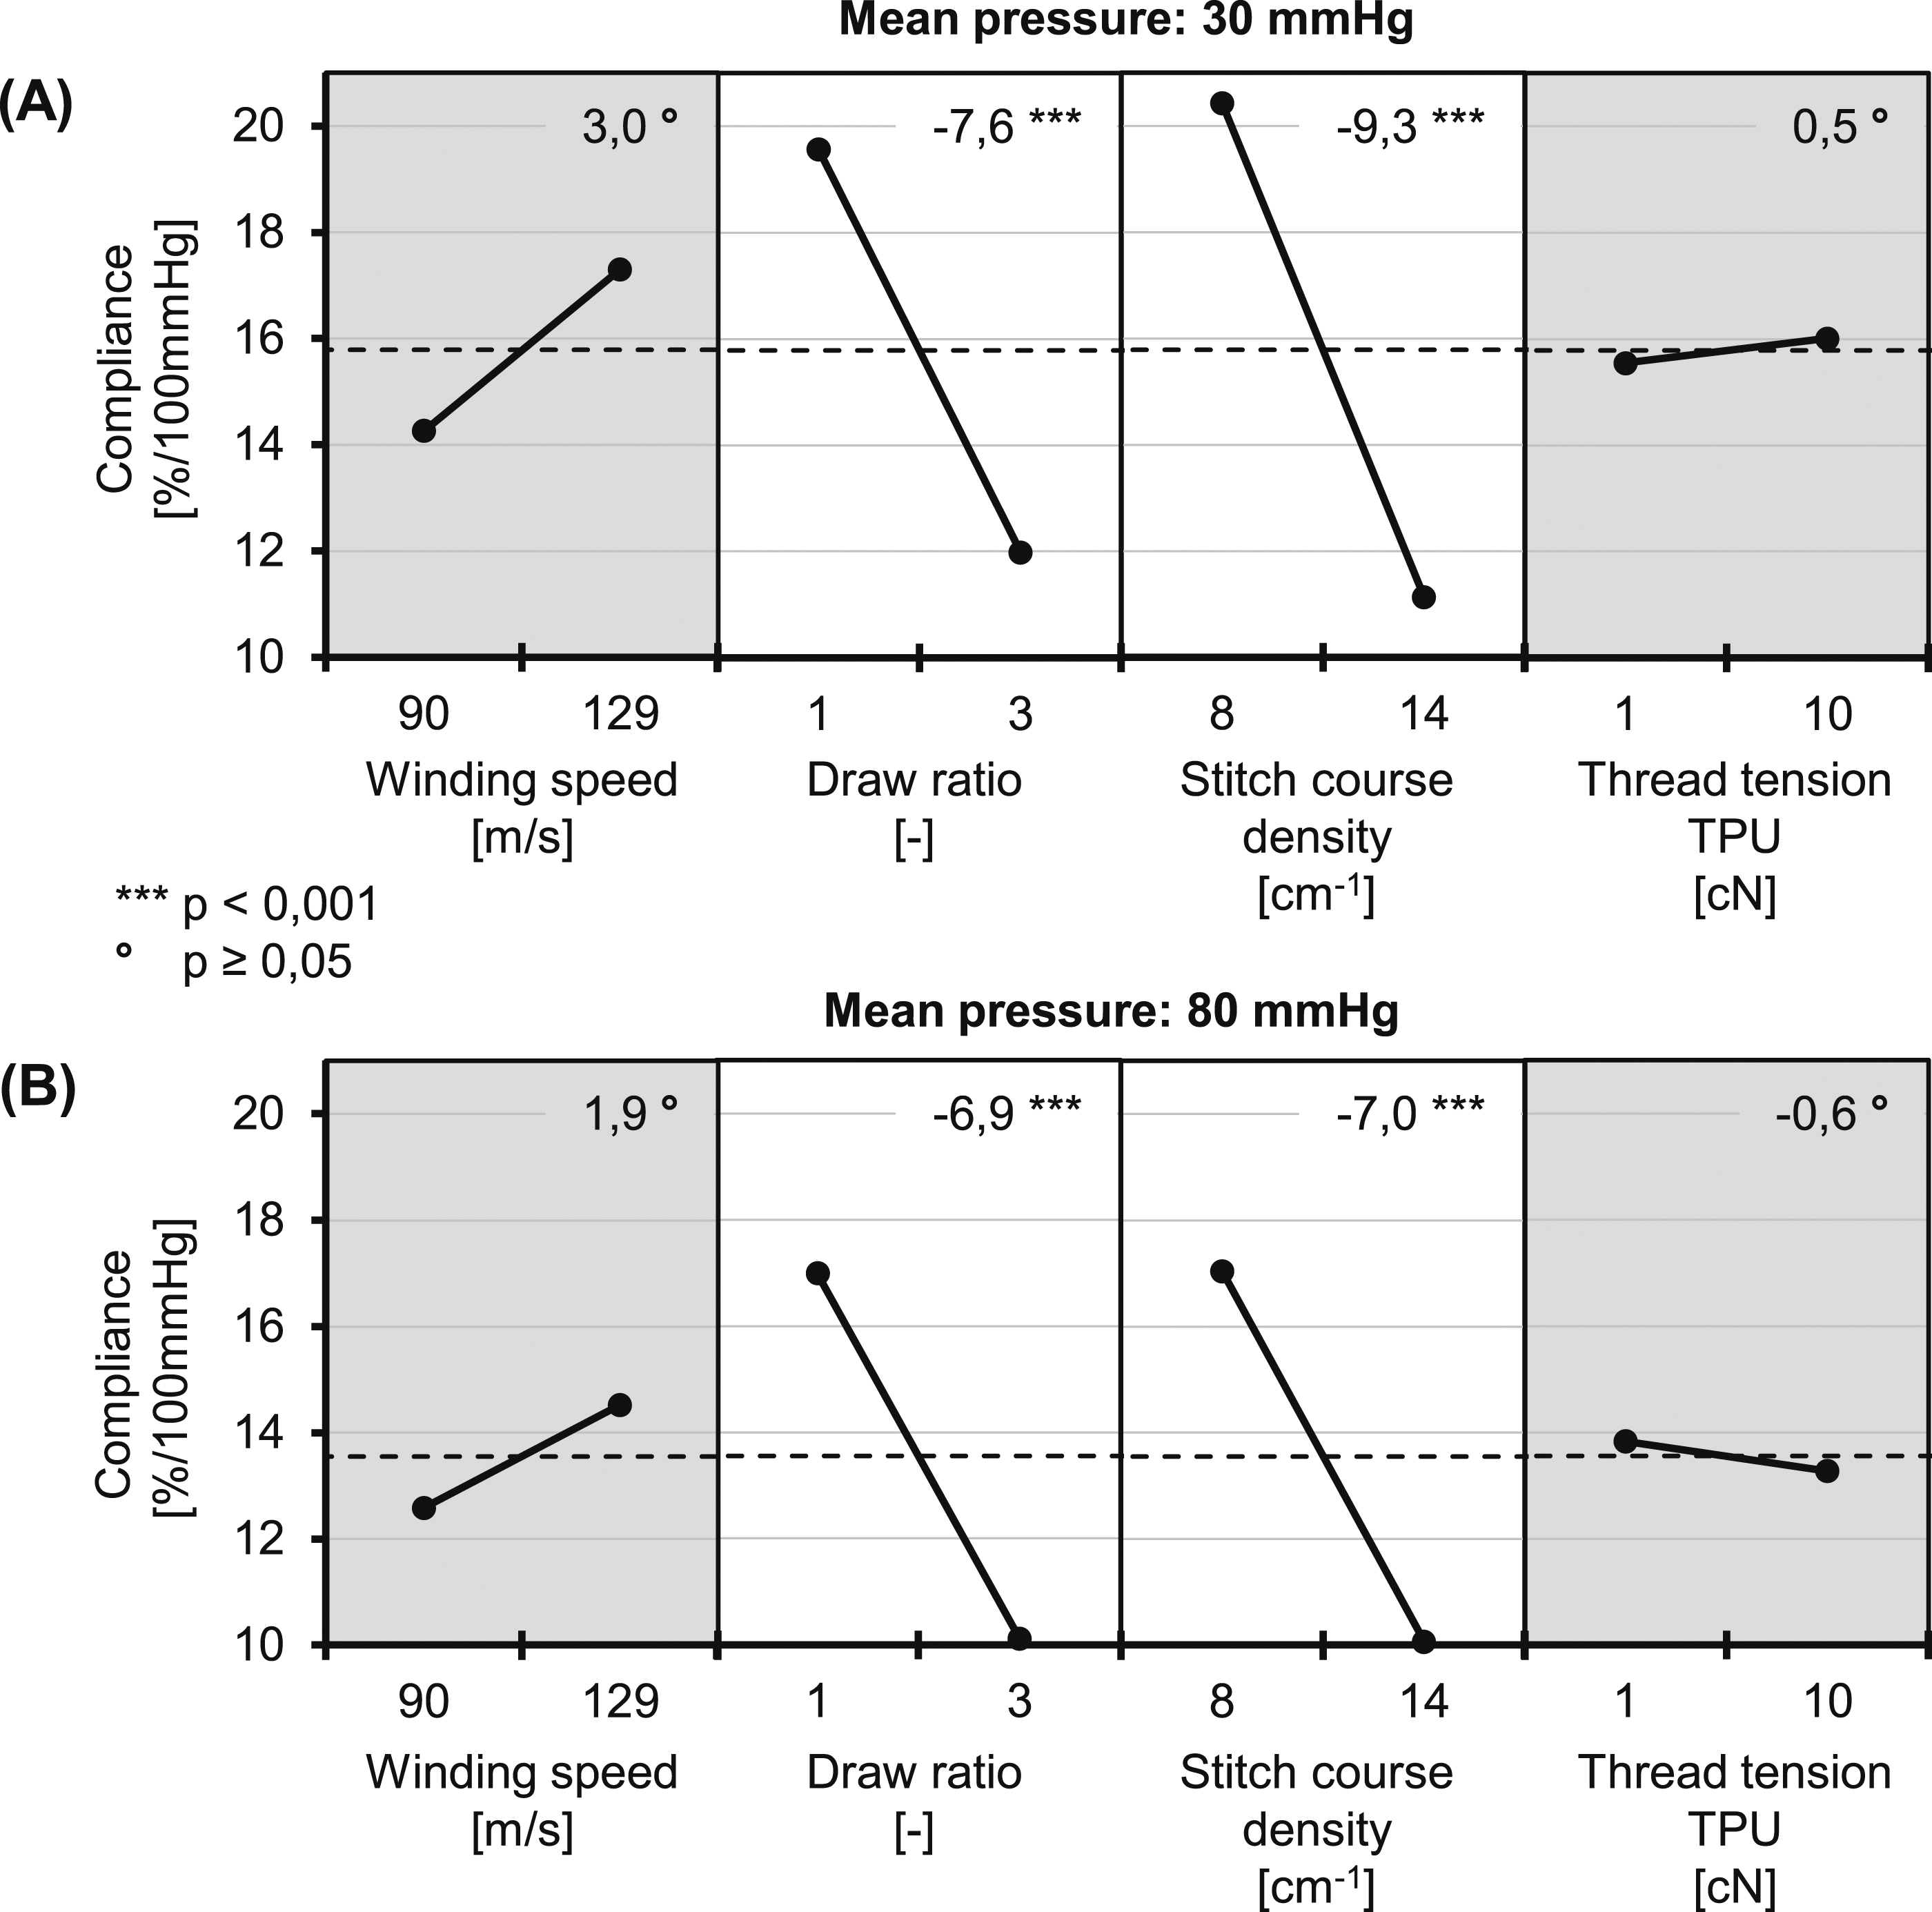
Although the thread tension had highly statistically significant effects on all further textile properties examined, no statistically significant effect was observed for the compliance. However, it must be considered that the factorial design of experiments is not balanced with respect to the set factor levels of the thread tension, which can negatively influence the determination of statistically significant effects of this factor.
Both at a mean pressure of 30 mmHg and 80 mmHg, the standard deviation of the mean values of the four replications of the central point (dispersion of the replications) was greater than the mean standard deviation for the four replications of the central point (dispersion of the repetitions) by a factor of 3.5 - 4.1 (mean pressure of 30 mmHg: 3.5; mean pressure of 80 mmHg: 4.1).
Optimization
For the optimization, the factors winding speed and relaxation temperature were not considered anymore, as the showed no statistically significant effects on the compliance or further textile properties of the warp knitted grafts in the definition of operating field. However, the thread tension was still included as a factor in the design of experiment to determine any statistically significant effects that may not have been determined due to the lack of process stability at high thread tensions. Therefore, the high factor level of the thread tension was lowered to 5.5 cN at which a stable warp knitting process was achievable at all experimental point in the definition of operating field. Furthermore, the factor levels of the stitch course density were adapted to a more stable and reasonable process window between 10 and 12 cm−1, based on the results of the definition of operating field. The factor levels of the draw ratio were retained. The factors and factor levels of the optimization are summarized in Table 2. For the optimization, a stable warp knitting process could be achieved for all experimental points.
In the statistical evaluation, it was observed that the influence of the replication had no statistical significance. Thus, the warp knitting process with the applied process parameters could be considered stable and reproducible. For the further evaluation of the results, both replications of the test points were therefore combined.
In contrary to the definition of operating field, the thread tension of the TPU yarn could be determined as a statistically significant effect in addition to the draw ratio and the stitch course density both at a pressure of 30 mmHg and 80 mmHg.
At a pressure of 30 mmHg the main effect of the draw ratio was −14.4%/100 mmHg at p < .001, while the main effect of the stitch course density was −5.0%/100 mmHg at p < .001 and the main effect of the thread tension −2.6 %/100 mmHg at p = .002. At a pressure of 80 mmHg the main effects of the draw ration (−13.0 %/100 mmHg at p < .001) and the stitch course density (−3.7%/100 mmHg at p < .001) were slightly lower compared to the pressure of 30 mmHg, while the main effect of the thread tension (−2.6 %/100 mmHg at p < .001). The main effect plots of the compliance for the definition of operating field are shown in Figure 6. Main effect plot for the response compliance of the optimization experimental design at a mean pressure equivalent of 30 mmHg (a) and 80 mmHg (b).
Furthermore, the curve of the compliance was plotted over the mean pressure between 20 and 120 mmHg. The interval between the measurement points was 10 mmHg and the compliance was calculated over a pressure difference of 10 mmHg. The plot of the compliance of two promising experimental points together with a commercial ePTFE graft and a native sheep artery is shown in Figure 7. Results of compliance as a function of mean pressure for two experimental points of the optimization experimental design along with a commercial ePTFE graft (FlixeneTM Vascular Graft) and a native sheep artery.
At mean pressures between 90 and 120 mmHg, the differences between the native artery and the two biomimetic grafts are in the range of the standard deviation of the measurements. At a mean pressure of 80 mmHg, the compliance of the biomimetic grafts is 15 - 20 % lower than the compliance of the native artery. At a mean pressure of 20 mmHg, the compliance of the biomimetic grafts is 48 – 54 % lower than the compliance of the native artery. The compliance of the biomimetic grafts is on average a factor of 4.0 higher compared to the ePTFE graft over the entire pressure range from 40 to 120 mmHg. At a mean pressure of 20 mmHg, the compliance of the biomimetic grafts is a factor of 5.5 to 6.3 higher compared to the ePTFE graft.
Discussion
In this study, we melt spun TPU fibers and combined them with PVDF fibers in a warp knitted textile structure. By the interaction of material and structural elasticity of these fibers and the warp knitted construct, we mimicked the stress-strain behavior of native arteries in order to reduce the compliance-mismatch between the vascular graft and the native artery.
Medical grade TPU Chronoflex C 93A from AdvanSource Biomaterials Corporation served as the starting polymer for fiber production. The multifilament yarns were produced by melt spinning. This enables maximum biocompatibility of the yarns, since compared with the commonly used wet spinning process of TPU fibers, the risk of residues of the solvent remaining in the fibers can be excluded.
A stable spinning process could be implemented. Due to the variation of the spinning parameters of winding speed, draw ratio and relaxation temperature within the statistical design of experiments, the achieved linear density of the yarns varied between 108.0 and 209.2 dtex. The average linear density over all experiments was 151.6 dtex, corresponding to the target value of 150 dtex.
The draw ratio had a significant effect on all the yarn properties investigated. An increase in draw ratio resulted in a higher linear density, a higher tenacity, a lower breaking elongation, a higher elastic strain fraction and a higher Young’s modulus. These effects are caused by alignment and interlacing processes at the molecular level during the drawing process. Due to the higher alignment and interlacing of the polymer strains, drawn yarns can take higher loads and show a higher modulus. The drawing process elongates the yarn and aligns the molecules in the yarn. This builds up internal stresses that counteract the elongation of the yarn. Due to the elongation of the yarn during the drawing process and the given conservation of mass, higher drawn yarns show a lower linear density compared to lower dawn yarns. However, we hypothesize that in the relaxation process of the yarn, these internal stresses cause the yarn to contract, resulting in a higher linear density. The effect on the elastic strain fraction can be explained by a partial breaking of the hard phase of the TPU (Mullins effect). 38 The increase of the winding speed resulted in a significant decrease of the linear density. This can be explained by the conservation of mass in the spinning process. Furthermore, the results suggest that the increase in winding speed and the resulting increased melt drawing leads to an increase in tenacity. However, this effect was not statistically significant and needs further investigation. The reset temperature has no effect on the investigated yarn properties.
For all analyzed yarn properties, the repeatability of results over multiple test series was lower than the repeatability of the measurements within one test series. The reproducibility of yarn production therefore still provides potential for improvement.
With the analyzed process parameters of the yarn and fabric production, the properties of the warp knitted textile structure could be specifically adjusted. However, the thread tension of the TPU yarn had a great influence on the process stability of the warp knitting process. Therefore, not all test points with a high factor setting of the thread tension could be implemented according to the planned design of experiments and the thread tension had to be reduced for four experimental points. For this reason, a non-orthogonal design of experiments was given. This was taken into account in the statistical evaluation, but the significance of the effects determined may have suffered as a result, especially for the factor thread tension. Nonetheless, the thread tension had the greatest effect on the stitch course density, the wale density and the wall thickness of the textile structure. Due to the higher thread tension, the restoring force of the yarns is increased, which leads to a higher shrinkage of the warp knitted fabric. This results in a great increase of stitch course density, wale density and wall thickness of the structure.
The draw ratio also had a significant effect the stitch course density, the wale density and the wall thickness of the textile structure. The higher Young’s modulus of the drawn yarns results in lower shrinkage of the warp knitted fabrics. As a result of the lower shrinkage, a decrease in stitch course density and wale density and wall thickness was observed.
The set stitch course density had a significant effect on the effective stitch course density and the wale density. Since the effective stitch course density is directly adjusted via the set stitch course density, the large positive effect on this is obvious. Furthermore, the underlaps of the warp knitted fabric are more circumferentially oriented at higher stitch course densities. As a result, the restoring force of the yarns is stronger in the circumferential direction, which leads to a higher shrinkage and thus a higher wale density.
The set stitch course density and the draw ratio also had great significant effects on the compliance both at a mean pressure of 30 mmHg and 80 mmHg in the definition of operating field. The factor stitch course density had a negative main effect on the compliance of −9 %/100 mmHg on average. Due to a high stitch course density, more underlays are present in the textile structure in the circumferential direction. Consequently, the applied force is absorbed by a higher number of fibers. This results in a lower compliance. The factor draw ratio also had a negative main effect on the compliance of −8%/100 mmHg on average. The effect of the draw ratio is assigned to the elastic modulus of the TPU yarn. Due to the higher Young’s modulus of drawn TPU yarns compared to undrawn yarns, the compliance of knitted fabrics made from drawn yarns is lower. Although the thread tension had great effects on the remaining properties of the textile structure, no statistically significant effect on the compliance was determined in the definition of operating field. One explanation may be the non-orthogonality of the experimental design related to this factor. Since the factor settings of the thread tension had to be adjusted for four experimental points, existing effects may not be determined to be statistically significant.
In the optimization, all factors evaluated had a negative main effect on the compliance. The cause of the effects of stitch course density and draw ratio on the compliance have already been described above. The negative effect of thread tension results from the already described effect of greater stitch course density at higher thread tension. As a result, the applied force is absorbed by a larger number of fibers, which reduces compliance. Compared to the definition of operating field, a highly significant main effect was also determined for the thread tension. In addition, normalized to the difference in factor levels, the main effects of all factors were larger than in the definition of operating field. This is explained on the one hand by the orthogonality of the definition of operating field and on the other hand by the reduced scope of the factors investigated from five to three. The actual magnitude of the effects as well as their statistical significance can thus be determined more precisely.
While the effect of thread tension was the same at both pressures, the factors draw ratio and stitch course density showed larger effects in the low pressure range of 30 mmHg than in the high pressure range of 80 mmHg. In perspective, this enables a further selective adjustment of the compliance curve in the different pressure ranges (Figure 8). However, further modifications and adjustments of both the spinning process and the warp knitting process may be necessary in order to be able to operate the processes in a stable and reproducible manner beyond the investigated experimental space. Schematic representation of the further adaptation of the compliance of the biomimetic graft in specific pressure ranges.
Overall, our approach has increased the compliance of the biomimetic graft over the entire pressure range of 20 - 120 mmHg by a factor of 4.0 - 6.3 compared to the ePTFE grafts in clinical use today. With the biomimetic graft, we were able to achieve a compliance of 46 - 56 % of the native artery in the low pressure range of 20 - 40 mmHg. In contrast, the commercial ePTFE graft has a compliance of only 8 - 12 % of the native artery in the same pressure range. In the high pressure range of 80 - 120 mmHg, the biomimetic graft has a compliance of 80 - 120 % of the native artery. In the same pressure range, the commercial ePTFE graft has a compliance of only 20 - 25 % of the native artery.
Further tests must be carried out with regard to the blood tightness of the graft. By means of light microscopic analysis of the textile structure, no porosity can be determined (Figure 3(b)), however, the structure in the current configuration shows water permeability. It must be investigated whether contact with blood causes clotting of the structure and thus blood impermeability. In addition, a coating of the structure with collagen or gelatine, for example, can be investigated, as is also used in commercial vascular prostheses. In this case, the change in the mechanical, in particular the elastic properties of the graft due to the coating must not be disregarded. However, the determined correlations between process parameters and properties of the graft provide the basis for counteracting this by means of specific adaptation of the textile structure.
Conclusion
With our approach of combining material and structural elasticity in a warp knitted textile structure, we were able to enhance the compliance by an average factor of 4.0 compared to the clinical ePTFE graft over the entire pressure range from 40 to 120 mmHg. At a low mean pressure of 20 mmHg, the compliance of our biomimetic grafts is even higher with a factor of 5.5 to 6.3 compared to the clinical ePTFE graft. With the gained results regarding the correlation between the process parameters of yarn and fabric production and the mechanical properties of the small-caliber vascular graft, further adaptation of the elastic properties towards physiological compliance be performed in the future.
The results represent a major step towards a clinical, biomimetic vascular graft without compliance mismatch. Furthermore, the approach we have developed can be transferred to other flat, tubular or complex three-dimensional textile implants in the future.
Footnotes
Declaration of conflicting interests
The author(s) declared no potential conflicts of interest with respect to the research, authorship, and/or publication of this article.
Funding
The author(s) disclosed receipt of the following financial support for the research, authorship, and/or publication of this article: This work was supported by the Forschungskuratorium Textil, Bundesministerium für Wirtschaft und Energie (18534N/1).