
Abstract
In the process of using adhesive method for variable cross-section 3D weaving, the introduction of adhesive at the yarn increasing point greatly increases the friction and wear between carbon fibers, which can lead to a decrease in the overall performance of the prefabricated component. In response to the above issues, a self-made experimental fixture was developed to test the friction and wear performance between carbon fibers in bonding process. The effects of friction angle, preloaded tension, and friction frequency on the friction properties between carbon fiber bundles were investigated. Solidworks is used to model bonded carbon fiber bundles with a friction angle of 90°, and ABAQUS is used to simulate the friction of the bonded carbon fiber bundle. The experimental results show that stress concentration occurs in the center of the friction area, and the wear degree at the center is more obvious, and the number of fiber breaks at the center was more than that of the side. Friction angle has great influence on friction coefficient, while pre-tensioning and friction frequency had a negligible effect. Based on the above results, when performing variable cross-section 3D weaving, it is recommended to increase the spacing between adjacent carriers and shorten the distance between the weaving chassis and the prefabricated parts. Additionally, it is advised to reduce the pre-added tension on the carrier device and increase the knitting frequency as much as possible within the scope of working conditions. The study results are of great significance for developing 3D weaving devices in terms of theoretical and engineering guidance.
Introduction
Three-dimensional weaving with variable cross-section by adhesive method refers to the use of adhesive to bond one or more auxiliary yarns to the main yarn participating in the weaving process to increase the cross-sectional area of the yarn. 1 Thereby achieving an increase in the cross-sectional area of the prefabricated component. 2 This near-net-molding weaving method avoids material damage and structural defects caused by subsequent mechanical processing and effectively ensures the stability and reliability of the mechanical properties of the prefabricated parts. 3 Carbon fibre preforms prepared by weaving, laminating, etc. not only have the advantages of high specific stiffness, high specific strength and good corrosion resistance that general composites possess, but also have better impact resistance, fatigue resistance, damage tolerance and layer bonding strength.4–9 Therefore, it can be widely used in engineering, aerospace, maritime, biomedical, automotive manufacturing, and other fields.10–15 Such as airplane propeller blades, wind blades, sporting goods, 16 manufactured by lamination method, and radomes, missile warheads and other structural components17–19 manufactured by weaving method. However, because the adhesive is used at the yarn adding point, the friction and abrasion between fibers are greatly increased during the weaving process, which can lead to a decrease in the overall performance of the braided preform.
Carbon fibre are widely used in weaving variable cross-section 3D prefabricated parts. During the weaving process, carbon fibers are subjected to a variety of mechanical stresses, such as bending, torsion, shear, stretching, etc.20–22 In addition, Carbon fibers have the flexible characteristics of large deformation, and present a unique friction and wear mechanism. Researchers have proposed various friction theories and computational methods based on fibre compositions. Based on Cullen's law of friction,23,24 Gralenh and Olofsson et al. 25 developed a fibre-twisting method to measure inter-fibre friction. The method applied constant load to one end of the twisted fibers, and a certain load to the other end to test the coefficient of friction and a certain force is applied at the other end to test the friction coefficient when sliding friction occurs. Tabor and Roselman et al. 26 used winch method to characterize the friction force between the carbon fiber bundle and the friction cylinder by measuring the tensile force at both ends of the carbon fiber bundle through the friction cylinder at a constant speed. The above two methods were applied in the last century, and the test methods were too crude and the friction coefficient measured was not accurate enough. Using the plate friction method, Mulvihill et al. 27 found that the friction contact area, the amount of sizing on the surface, and the arrangement of the fiber tows were the essential affecting factors of the friction properties of carbon fiber tows. This friction method is quite different from the friction of carbon fiber bundles in actual working conditions. Tourlonias et al. 28 used rotary reciprocating friction to simulate friction modes between warp and weft yarns during the weaving process, investigating the effects of friction angle and normal load on the frictional properties of carbon fiber tows. This method ignores the deviation of the contact angle of warp and weft yarns caused by rotation when studying the friction of warp and weft yarns, and cannot control the yarn tension. N.D. Chakladar et al. 29 employed a custom-made fixed pulley device to investigate fiber abrasion at various inter-bundle angles. They further developed a numerical method using Abaqus to determine the inter-filament friction based on the bundle friction. Before the friction test, the 12 k tow was manually divided, and then the tow numbers of different specifications were generated by weighing in an electronic balance. This method has a large error. Wu et al. 30 employed a linear friction approach to simulate the friction between the filament bundle and the tool during the three-dimensional weaving process, specifically focusing on the weft-beating motion. They further examined the impact of normal load on the friction and wear behavior of carbon fibers. By multiplying the actual contact area with the shear strength, the values of friction force and friction coefficient are obtained, and the representation method is relatively simple.
Chao et al. 31 numerically simulated the interfacial fracture behavior of carbon fiber reinforced pyrolytic carbon (C/C) composites. The results show that this zero-thickness interface element can accurately predict the interfacial fracture behavior of C/C composites when the constitutive parameters are determined. After that, Chao et al. 32 proposed the progressive damage criterion for numerical simulation, and studied the influence of porosity on the bending properties of two-dimensional overlapping carbon/carbon (C/C) composites. The results showed that with the increase of porosity, the bending strength is greatly reduced and the interlayer delamination is more serious. Dai Xin 33 et al. used Abaqus software to simulate the wear resistance of copper-plated carbon fiber tow. The results showed that the carbon fiber tow had good weave ability when it was coated with 0.5 ∼ 1.0 μ m copper layer.
Although many studies have been conducted on the frictional properties between tows, the effect of introducing adhesives on the frictional properties at the joints of carbon fiber tows has paid little attention during the variable cross-section three-dimensional braiding process. In this work, the self-made test fixture and linear friction tester are used to simulate the friction phenomenon near the bonding point of carbon fiber bundles in the process of variable cross-section three-dimensional weaving. The reciprocating friction motion of the test fixture is similar to the mutual friction between fiber bundles in the process of variable cross-section three-dimensional weaving, and the friction with a friction angle of 90° is simulated by finite element method, and the effects of friction angle, friction frequency and pretension on the friction coefficient between carbon fiber bundles are studied. In addition, the wear rate in the friction area was calculated, the wear behavior of carbon fiber bundle at the friction point after friction was characterized by SEM, and the tensile fracture strength of carbon fiber bundle after friction was tested by universal testing machine. The research results have important theoretical and engineering guiding significance for the actual working parameters of automatic knitting of variable cross-section three-dimensional knitting machine and the motion law of yarn carrier on the chassis in variable cross-section three-dimensional knitting machine.
Experimental section
Raw materials
PAN-based of T700-12K carbon fibre (fibres diameter 7 µm, elastic modulus:230GP, 12 000 single filaments per tow, manufactured by Toray Co., Japan) was chosen as a material for three-dimensional weaving. 9005 type fully transparent epoxy resin AB adhesive that purchased from Shenzhen Tegu New Materials Co., Ltd was used as the adhesive, The curing time of the adhesive is about 60s, and the shear strength after curing and the bending strength are 18 MPa and 56.3 MPa respectively. The 502 instant adhesive that purchased from Shaanxi Xi'an Yiba Adhesive Products Co., Ltd was used to fix the carbon fiber bundle on the fixture. The curing time of the 502 adhesive is about 10s, and the shear strength after curing is 25 MPa. The carbon fiber bundle impregnated with E51 epoxy resin which purchased from Guangdong Yuanzheng Chemical Co., Ltd was used for tensile measurement, and the epoxy value (EQ/100 g) was 0.48∼0.54.
Experimental equipment
ZJ-5750 Linear Abrasion Tester (China Shenzhen Zhijia Instrument and Equipment Co., Ltd) was used to test the coefficient of friction of carbon fibre bonding points. Experimental fixture is manufactured by 3D printer (Snapmaker, Shenzhen, China) for fixing carbon fibre bundles. SEM (FE-SEM, QUANTA-450-FEG, Switzerland) was used to characterize the surface morphology of carbon fibre bonding points after friction. UTM5504 Universal Testing Machine (LISI Shanghai Scientific Instrument Co., Ltd) was used to test the tensile properties of carbon fibre tows after friction. Digital vernier calipers (STANLEY, USA) are used to measure the thickness of carbon fibre bundles before and after friction. 50g weights (Hangzhou Shuanggu Metal Products Co., Ltd, China) were used to apply pre-tension to the glued carbon fibres.
Sample preparation
Preparation of bonded carbon fibers
Figure 1(a) showed that two carbon fibers with a length of 30 mm were glued together on the upper fixture by adhesive, and bonding point length was 10 mm. Figure 1(b) showed that the carbon fibers with a length of 35 mm were glued together on the lower fixture, and bonding point length was 10 mm. After being solidified 60s at room temperature, the bonded carbon fibers could be ready to use. Schematic diagram of bonded carbon fiber sample: (a) carbon fiber specimen on the upper fixture; (b) carbon fiber specimen on the lower fixture.
Fixation of bonded carbon fibers on fixtures
An experimental fixture is designed for this friction experiment was shown in Figure 2. The fixture was modeled by Solidwoks and manufactured by 3D printer. The experimental fixture is divided into upper fixture and lower fixture. Figure 2(a) shows the upper fixture. One end of the upper fixture is provided with two grooves. The groove is used for positioning the carbon fiber bundle, each with a width of 7 mm and a distance of 30 mm. The upper clamp is connected to the contact of the linear friction testing machine through bolts. In this experiment, the carbon fiber bundle specimen end was bonded to the upper fixture using 502 strong adhesives. The left end was bonded first, followed by bonding the other end of the carbon fiber specimen with varying weights using a clip clamp. The specimen was kept static for 10 s to ensure stability. Next, the right end of the carbon fibers was bonded to the upper fixture using 502 strong adhesives. Figure 2(b) shows the lower fixture. The two ends of the upper part of the lower fixture are respectively provided with three grooves, the width of each groove is 7 mm, the groove spacing at both ends is 40 mm, and the lower part is fixed on the wood board. The bonded carbon fiber bundle specimen is fixed on the lower fixture with the same fixing method as the upper fixture, and the other end of the lower fixture is fixed with the bottom board. As shown in Figure 2(c), fiber No.1 was in contact with fiber No. 2 during the 60° friction test, fiber No.1 was in contact with fiber No.3 during the 75° friction test, and fiber No.1 was in contact with fiber No.4 during the 90° friction test. Upper and lower fixture device diagram: (a) upper fixture; (b) lower fixture; (c) different friction contact angles.
Friction test method
Figure 3(a) shows the state diagram of the fixture on the machine. The upper fixture was fixed on the contact of a ZJ-5750 linear wear tester, and the contact was connected with a sensor, through which the change of the friction force F over time during the test was recorded. A Matlab code was developed, and after the friction was finished, the measured test data were imported into the Matlab software for processing to obtain a plot of the number of friction times versus friction force, followed by a plot of the number of friction times versus the coefficient of friction through the ratio of friction force to normal force. Figure 3(b) shows an enlarged view of the upper and lower fixtures after contact. The lower fixture is fixed on the base plate to simulate the friction in the real variable cross-section 3D weaving process. The bonded carbon fiber bundle was fixed on the upper and lower fixtures with a certain pre-added tension in the friction test. The size of the normal phase load was controlled by increasing the mass of weights on the friction contact, the carbon fiber on the lower fixture was stationary, and the carbon fiber on the upper fixture was driven to do the reciprocating friction movement under the friction tester contact. The distance of the reciprocating friction is 20 mm. Each parameter sample was tested for 5 times, and the average curve was drawn. Fixture on-machine status: (a) image of the test setup mounted on the friction tester; (b) enlarged view of the upper and lower fixture contacts.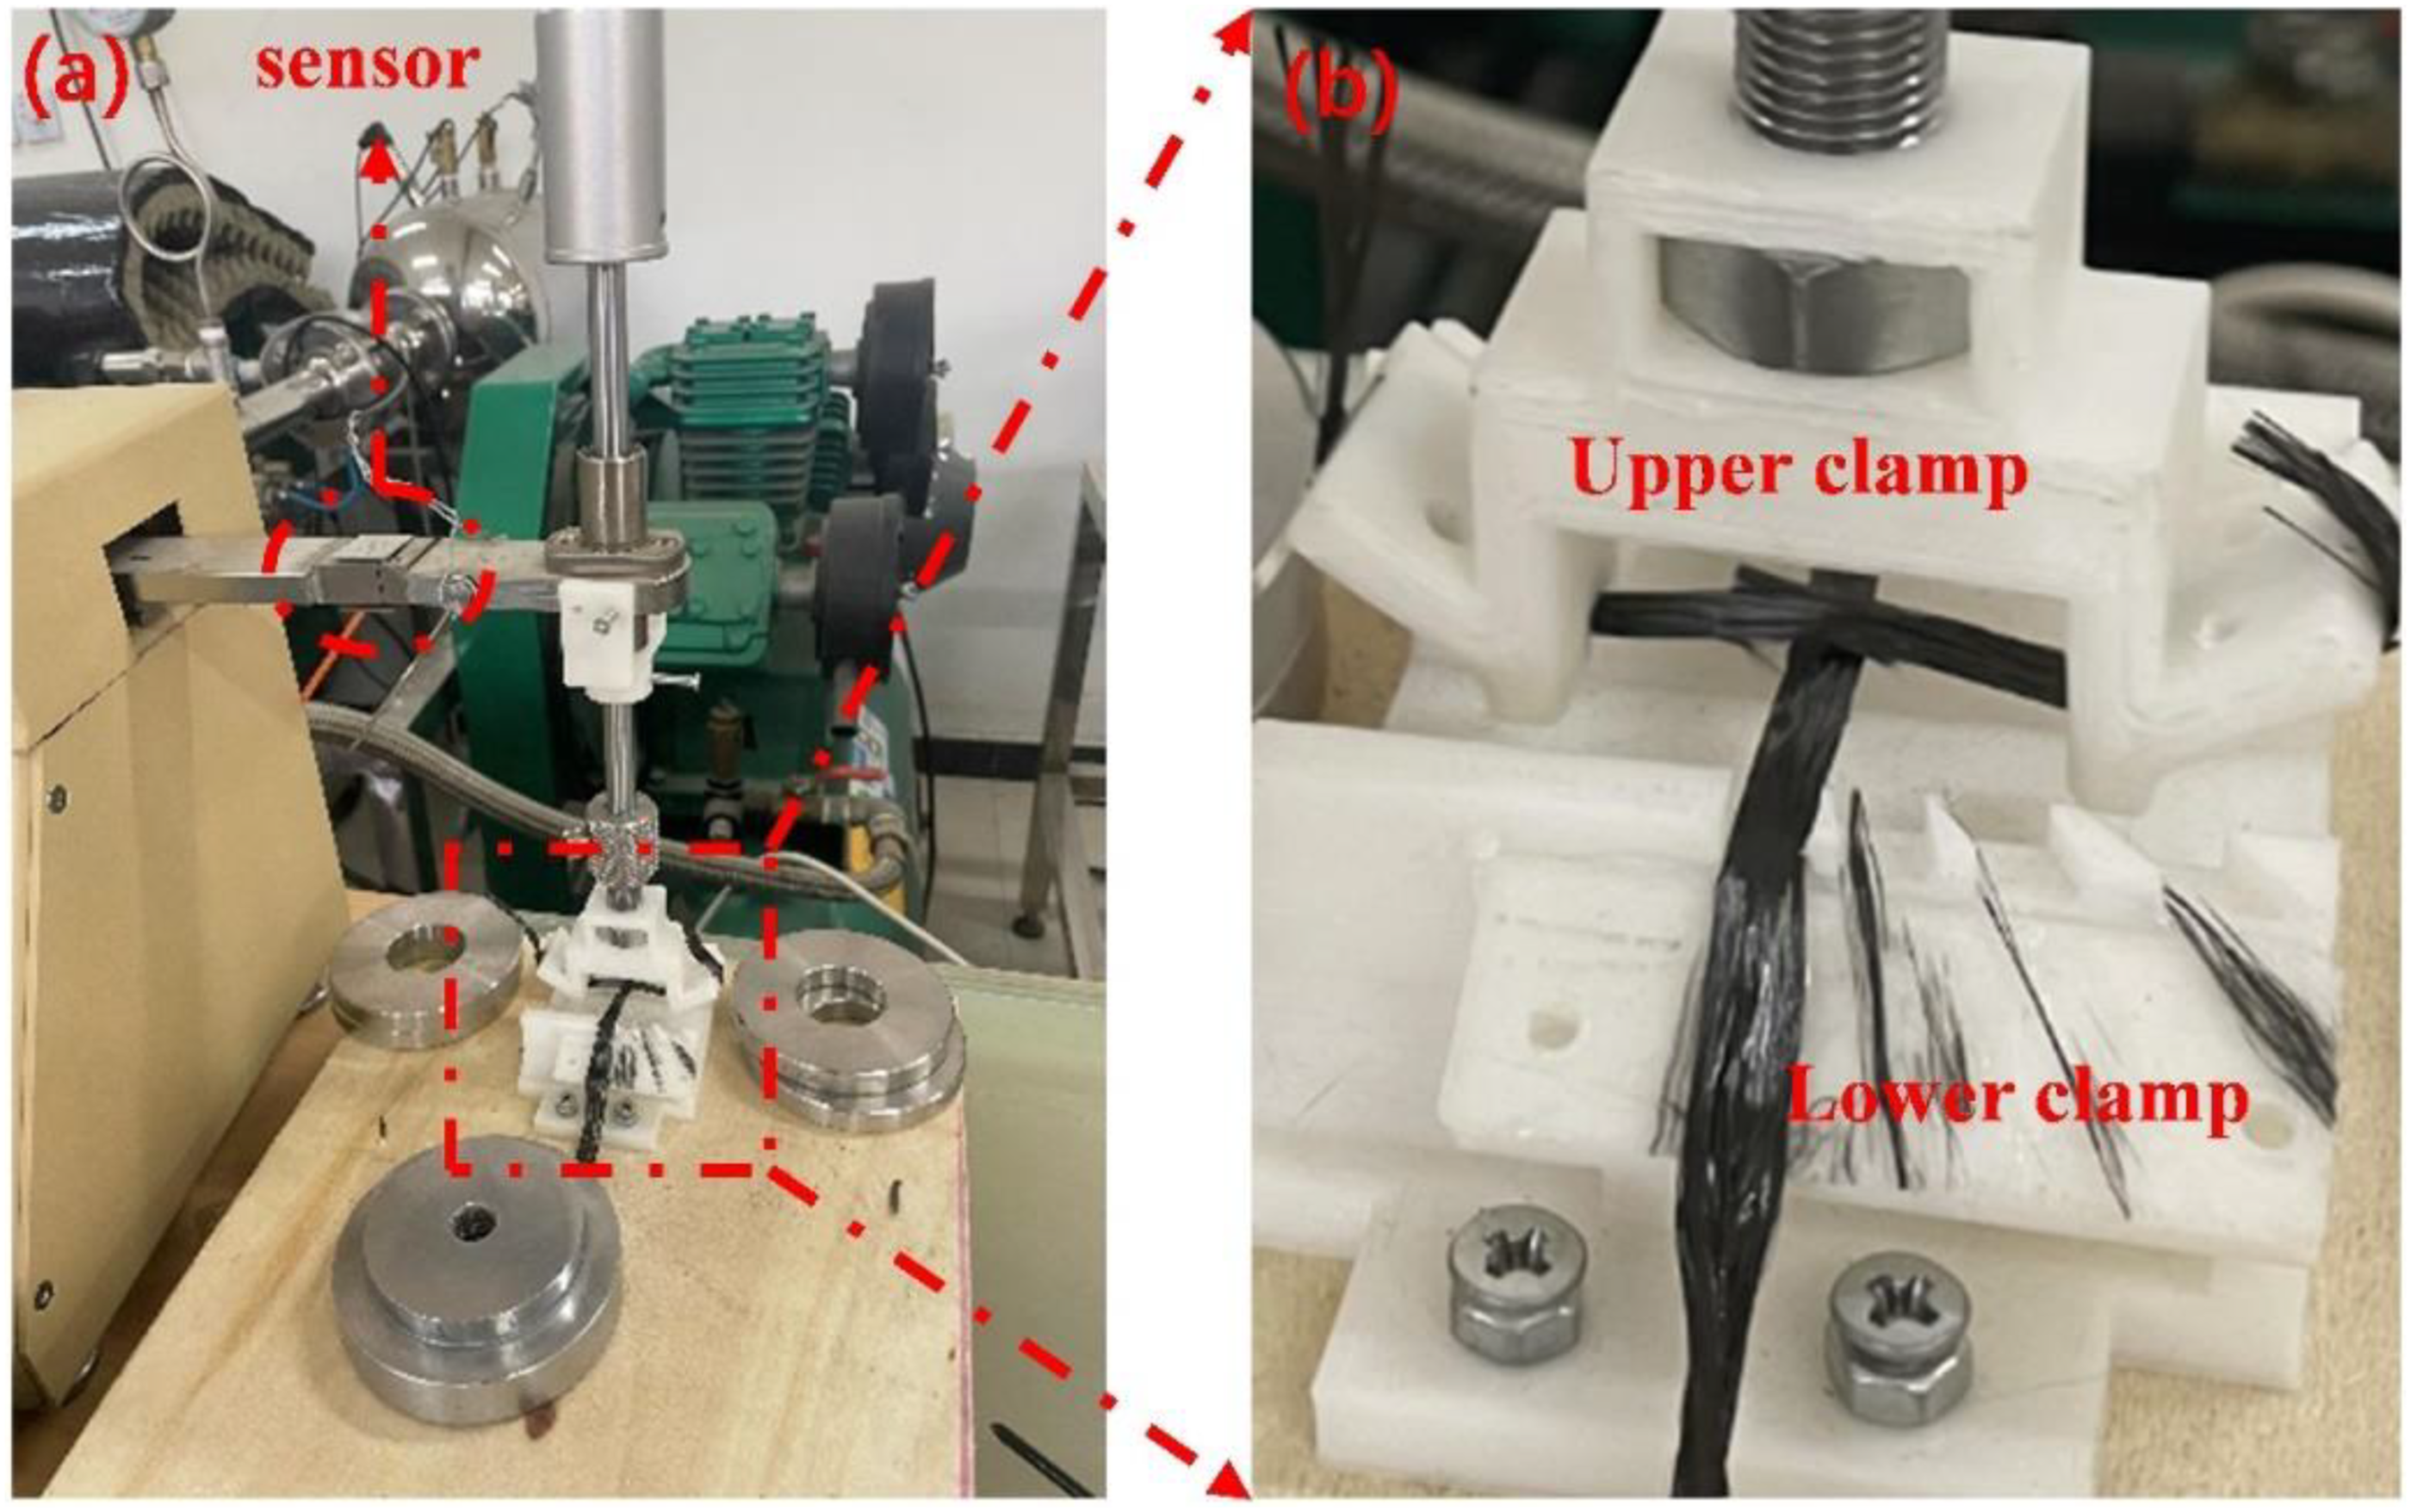
Friction test parameters.

Results and discussion
In order to investigate the stresses during friction at the bonding points of carbon fibre bundles, the friction properties at the bonding points were simulated. First, the arrangement of carbon fiber bundles at the contact point was studied. The carbon fiber bundles on the upper and lower fixtures were in contact stably at 90° under a certain normal phase load, and then were fixed using a 502 instant adhesive. After being solidified, Carbon fiber woven fabric were cut along the cross-section of the carbon fiber bundles. The fracture morphology observed by SEM was shown in Figure 4. The red dashed box shows the cross-section profile of the lower carbon fiber bundle, and an inverted trapezoidal shape was appeared in this area. The cross-sectional profile of the lower carbon fiber bundle.
According to the inverted trapezoidal profile of the lower carbon fiber bundle cross-section shown in Figure 4, the cross-section profile of the glued carbon fiber bundle model was designed as an inverted trapezoidal shape using Solidworks (2018 edition) software. If the T700-12K carbon fiber bundle had been modeled directly, 12,000 fiber filaments were needed to be set up, which was a huge amount of computation and would lead to an increase in computational error. Because the local wear of carbon fiber tow is consistent with the overall wear, the approximate minimum repeating unit cell is used to form the macro fabric.
33
The simplified model was shown in Figure 5. Figure 5(a) showed the simplified bonded carbon fiber bundle model, and Figure 5(b) showed the simplified model of a 90° contact between the upper and lower carbon fibers. Simplified model of bonded carbon fiber bundle: (a) Simplified model of bonded carbon fiber bundle; (b) The simplified model of a 90° contact between the upper and lower carbon fibers.
Friction material parameters.

Figure 6 shows the stress cloud of the carbon fiber bundle underneath after poison the friction property test at the friction angle 90°.There is a stress concentration phenomenon at the center of the friction area (red area in Figure 6). The maximum friction stress in the central area is 1.019 × 10⁵ Pa, and the minimum stress appears at the edge, and the minimum stress value is 1.896 × 10³ Pa. Stress cloud of carbon fiber bundle underneath after friction angle of 90° friction completion.

Comparison between calculated and simulated stress values.

The surface morphology of the carbon fiber bundle after friction at a friction angle of 90° is shown in Figure 7, and the location of the friction center is shown in the red dashed line area in Figure 7. As one can see from Figure 7, the wear of the carbon fiber bundle is more pronounced at the center of the friction. Compared to the friction edge, the wear rate of the friction center is higher, resulting in more fiber fractures. This phenomenon is mainly due to the stress concentration at the center of the friction region, which may be caused by shear and frictional stress between carbon fiber tows
35
and is consistent with the finite element simulation results. Surface morphology of carbon fiber bundle after friction test at 90° friction angle.
Effect of friction angle on the friction properties of carbon fibre bonding points
The effect of friction angle on the coefficient of friction μ of carbon fiber is shown in Figure 8. From which it can be seen that the coefficient of friction decreased sharply within the first 50 friction times, and gradually tend to be stable after 50 friction times. The main reason is that within the initial 50 friction times, due to the application of the normal phase load, carbon fiber bundles compress each other after contact and cause the fibers to rearrange. At the same time, the adhesive also plays a certain lubricating effect to reduce the frictional resistance between the fiber bundles. In order to ensure the accuracy of the test data, the friction coefficient of 100–200 times friction was taken as the average value. The coefficients of friction at 60°,75°, and 90° are 0.43,571, 0.40,544, and 0.38,206, respectively. The friction coefficients at friction angles of 60° and 75° are 1.14 and 1.06 times higher than those at friction angles of 90°, respectively, From the above analysis, it can be obtained that with the increase of friction angle, the friction coefficient decreases gradually. This is mainly because the variation of friction between fibers is equal to the product of the actual contact area between fibers and the interfacial shear strength,
36
and the interfacial shear length is a property of materials, so the actual contact area between fibers is directly proportional to the variation of friction. When the actual contact area between fibers increases, the variation of friction increases, and then the friction coefficient increases. Effect of friction angle on friction coefficient μ.
The friction angles of the two bundles of carbon fibers during the friction process are shown schematically in Figure 9. It can be seen that the red areas are the friction contact areas with friction angles of 60°, 75°, and 90°, and the contact areas of which were calculated to be 56.540 mm2, 50.729 mm2, and 49 mm2, respectively. The carbon fibre bundle on the lower fixture was selected and the difference in thickness at the carbon fibre bonding points before and after friction was measured using a vernier caliper. The volumetric wear rate was calculated.37,38 Volume wear rate is calculated by formula (3): Schematic diagram of different friction angles.

Parameters of carbon fiber bundle before and after friction.

Figure 10 is a graph showing the wear rate, and the wear rate can be obtained by bringing the thickness measured in Table 4 at the bonding point of the carbon fiber bundle before and after rubbing into the formula (1). The wear rates at the rubbing angles of 60, 75 and 90 are 0.735N−1 mm−1, 0.558 N−1 mm−1 and 0.294 N−1 mm−1 respectively. The wear rate at 60° and 75° is 2.5 and 1.898 times higher than the wear rate at 90°, respectively. This is mainly because the wear behavior is more influenced by the local mechanical mechanism of the contact area. The local mechanical mechanism depends on the specific fiber orientation.
36
With the decrease of friction angle, the friction coefficient increases gradually, which leads to the increase of wear at the fiber contact point. The graph of wear rate at different friction angles.
Effect of preloaded tension on the frictional properties of carbon fibre bonding sites
Figure 11. Shows the effect of pre-tension on the friction coefficient μ at the bonding point of the carbon fiber bundle. Because the friction coefficient changes greatly in the first 50 times, in order to ensure the accuracy of the test data, the friction coefficient between 100 and 200 times is taken as the average value. From Figure 11, it can be seen that the friction coefficient under pre tension of 2N and 1.5 N are 1.075 and 1.063 times higher than those under pre tension of 1N, respectively. The coefficient of friction increases with increasing preload tension. This is mainly because the stress in the friction area increases with the increase of pretension. Under the same friction area, the friction force of carbon fiber bundles with large pretension is slightly larger, and then the friction coefficient is slightly larger. Compared to the effect of friction angle on the friction coefficient of the carbon fibre bundle, the effect of preloaded tension on the friction coefficient of the carbon fibre bundle is small. Effect of different preloaded tensions on the coefficient of friction μ.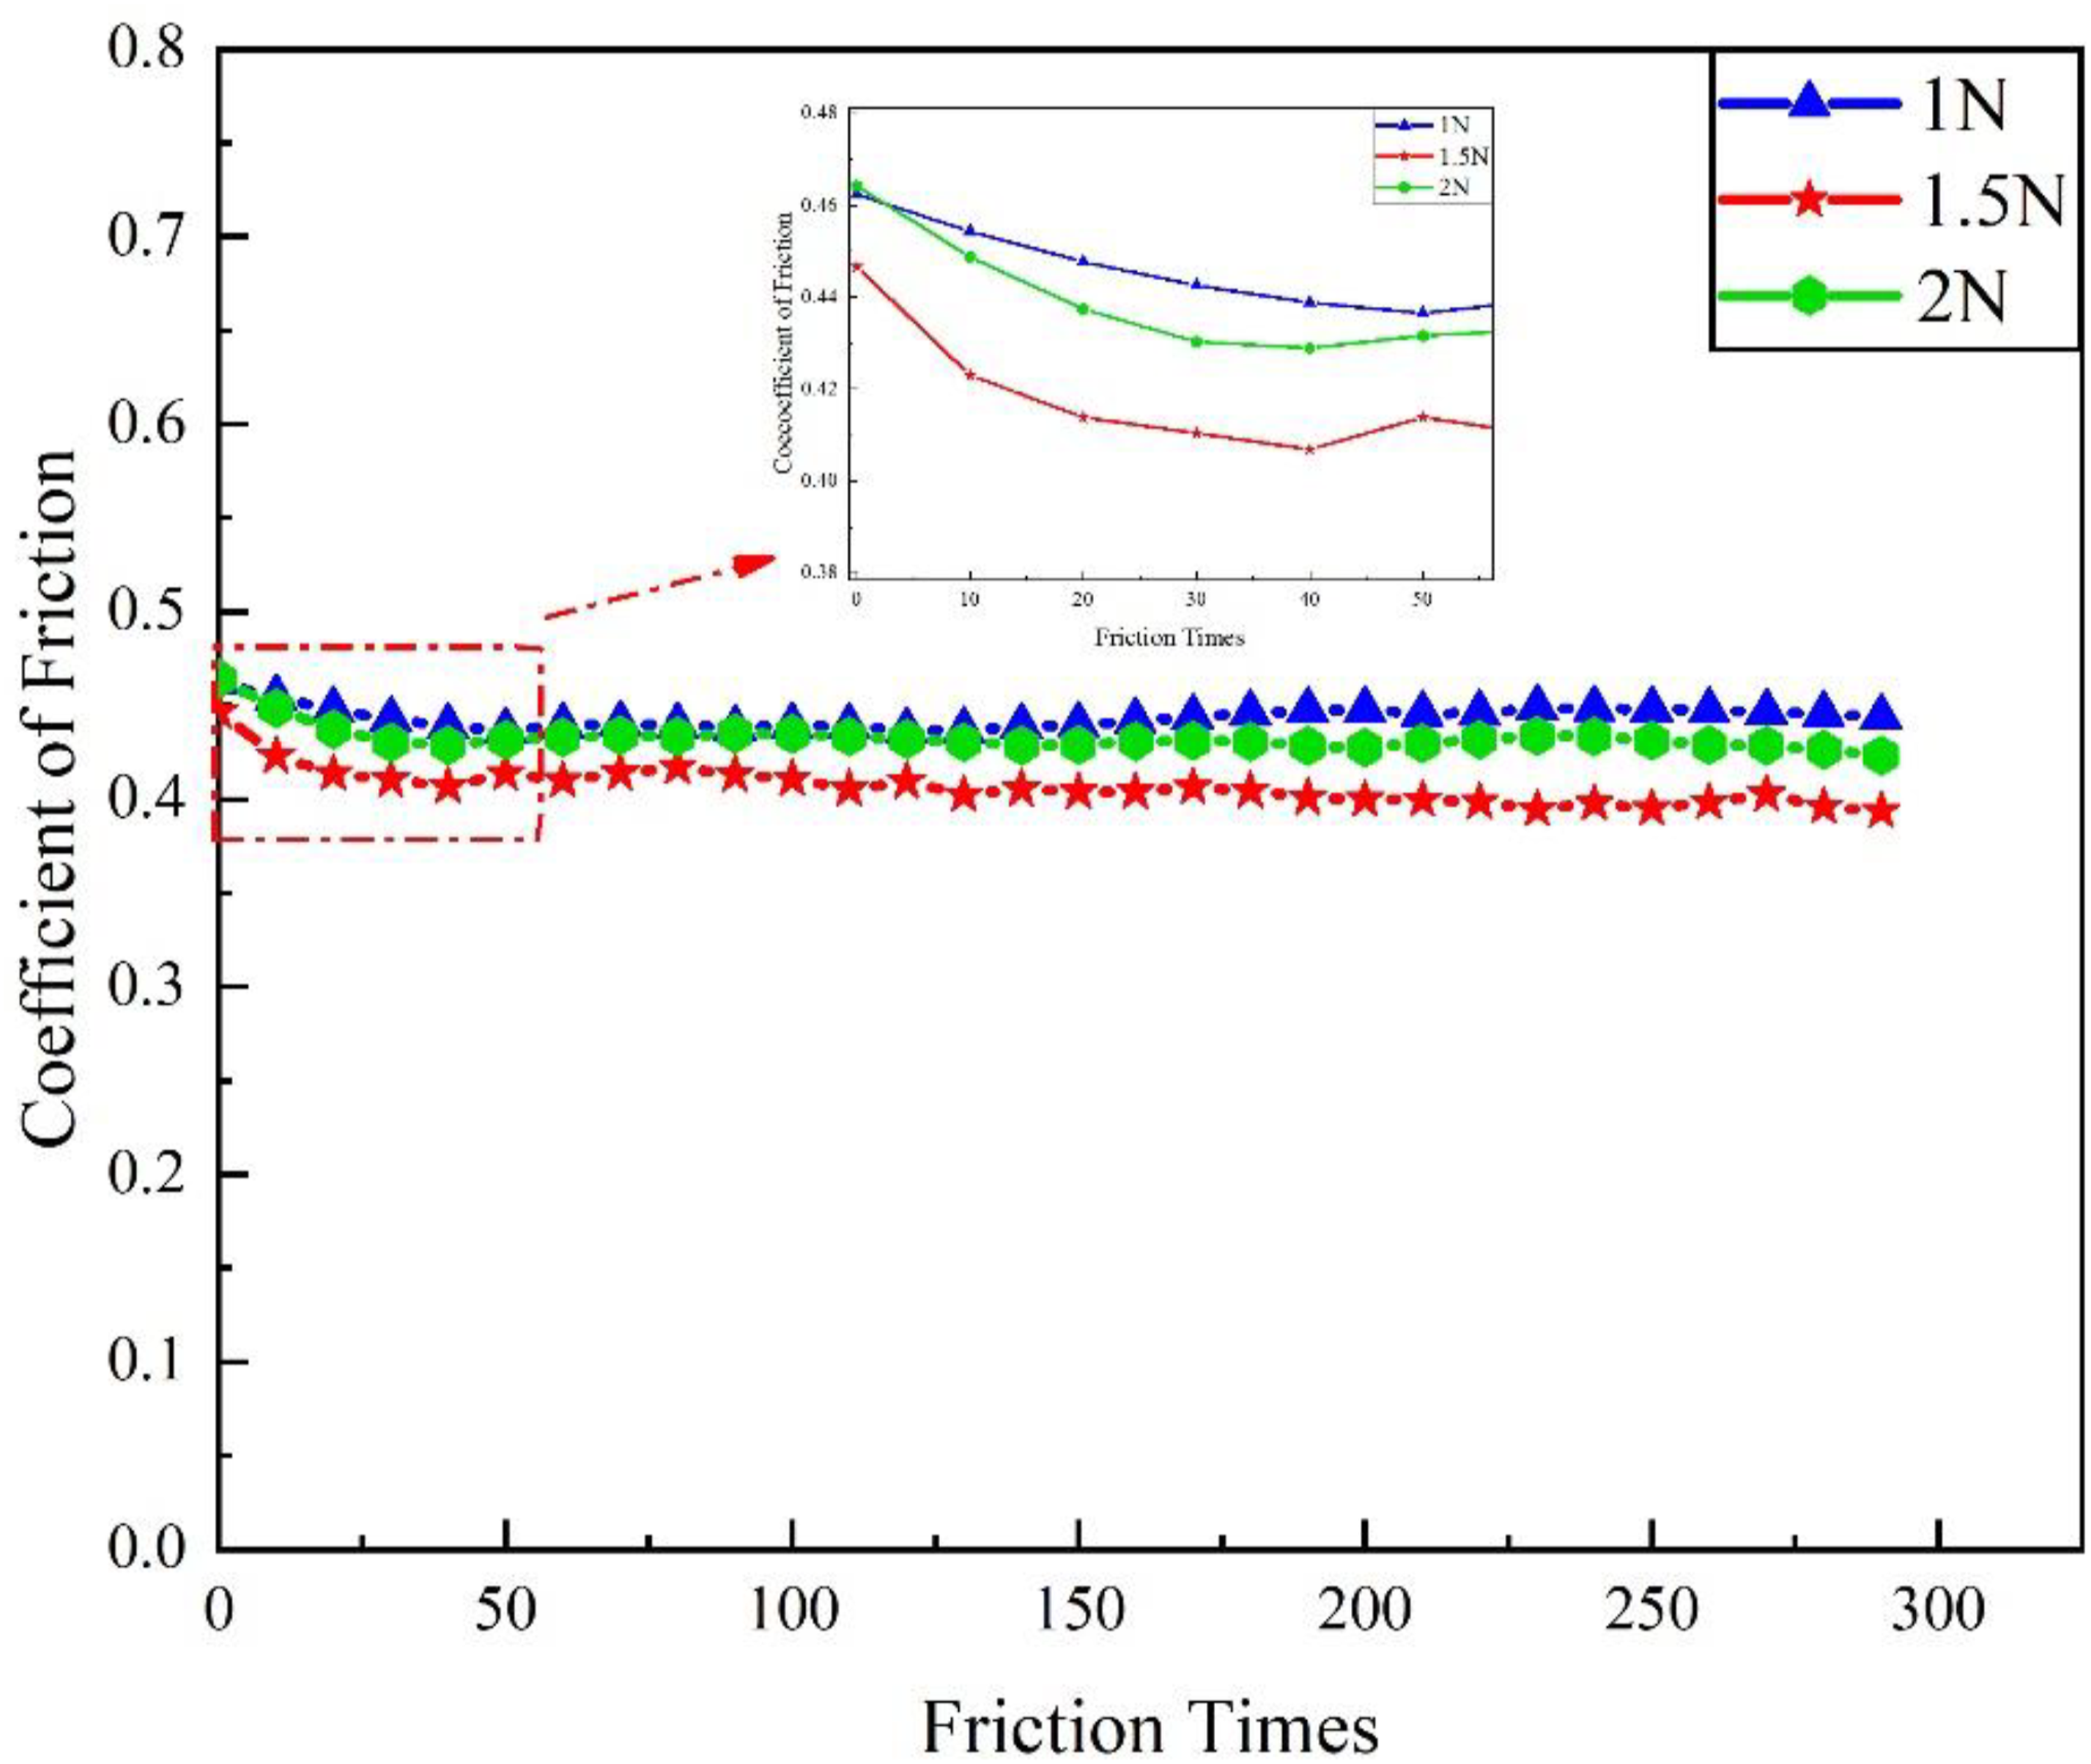
Figure 12 shows the surface morphologies of carbon fiber bundles after friction under different pre-tension. Figure 12(a), (c) and (e) are the surface morphology images of the carbon fiber bundles on the lower fixture magnified by 100 times after friction with pre-tension of 1N, 1.5N and 2N, respectively. Figure 12(b), (d) and (f) are the surface morphology images with 1000 times magnification within the dashed area of (a), (c), and (e), respectively. After friction, the adhesive exhibits agglomeration at the edge of the friction area, and the carbon fiber bundle experiences varying degrees of fiber breakage. Red dots are used to mark the number of fiber broken ends in Figure 12 (b), (d) and (f). According to statistics, the number of fiber broken ends in Figure 12(b), (d) and (f) are 155, 153, and 158 respectively. The number of fiber breaks under the three friction angles is similar, and the number of fiber breaks at the friction center is greater than the number of fiber breaks at the edge, which is mainly due to the occurrence of the stress concentration phenomenon at the center of the friction area. The above phenomena are in agreement with the finite element simulation results. Surface topographies of carbon fiber bundles after friction under different pretension: (a) Morphology magnified by 100 times with pre tension 1N; (b) Morphology magnified by 1000 times with pre tension 1N; (c) Morphology magnified by 100 times with pre tension 1.5 N; (d) Morphology magnified by 1000 times with pre tension 1.5 N; (e) Morphology magnified by 100 times with pre tension 2N; (f) Morphology magnified by 1000 times with pre tension 2N.
Effect of friction frequency on the frictional properties of carbon fibre bonded joints
Figure 13 shows the effect of friction frequency on the coefficient of friction μ at the bonding point of the carbon fiber bundle. The friction coefficient decreases sharply within the initial 50 friction times and stabilizes after 50 friction times. In order to ensure the accuracy of the test data, the average value is calculated by taking the friction coefficient between 100 and 200 times friction, and the friction coefficients at friction frequencies of 0.5 Hz, 1 Hz, and 1.5 Hz can be obtained, which are 0.43,009, 0.43,541, and 0.43,732, respectively. The difference is small and negligible. It can be concluded that the change in friction frequency hardly affects the friction coefficient μ. However, with the increase of friction frequency, as shown in Figure 13, when the number of rubs is 50, the friction coefficient of 0.5 Hz tends to be stable, when the number of rubs is 55, the friction coefficient of 1 Hz tends to be stable, and when the number of rubs is 60, the friction coefficient of 1.5 Hz tends to be stable. With the increase of friction frequency, more friction times are needed when the friction coefficient reaches stability. This is because the kinetic energy of carbon fiber bundle is greater when the friction frequency is 1.5 Hz, which increases the impact on carbon fibers in the process of reciprocating friction, and leads to a longer period of rearrangement of carbon fiber bundles. It is similar to the conclusion drawn by Montero L et al.
39
Effect of different friction frequencies on the friction coefficient μ.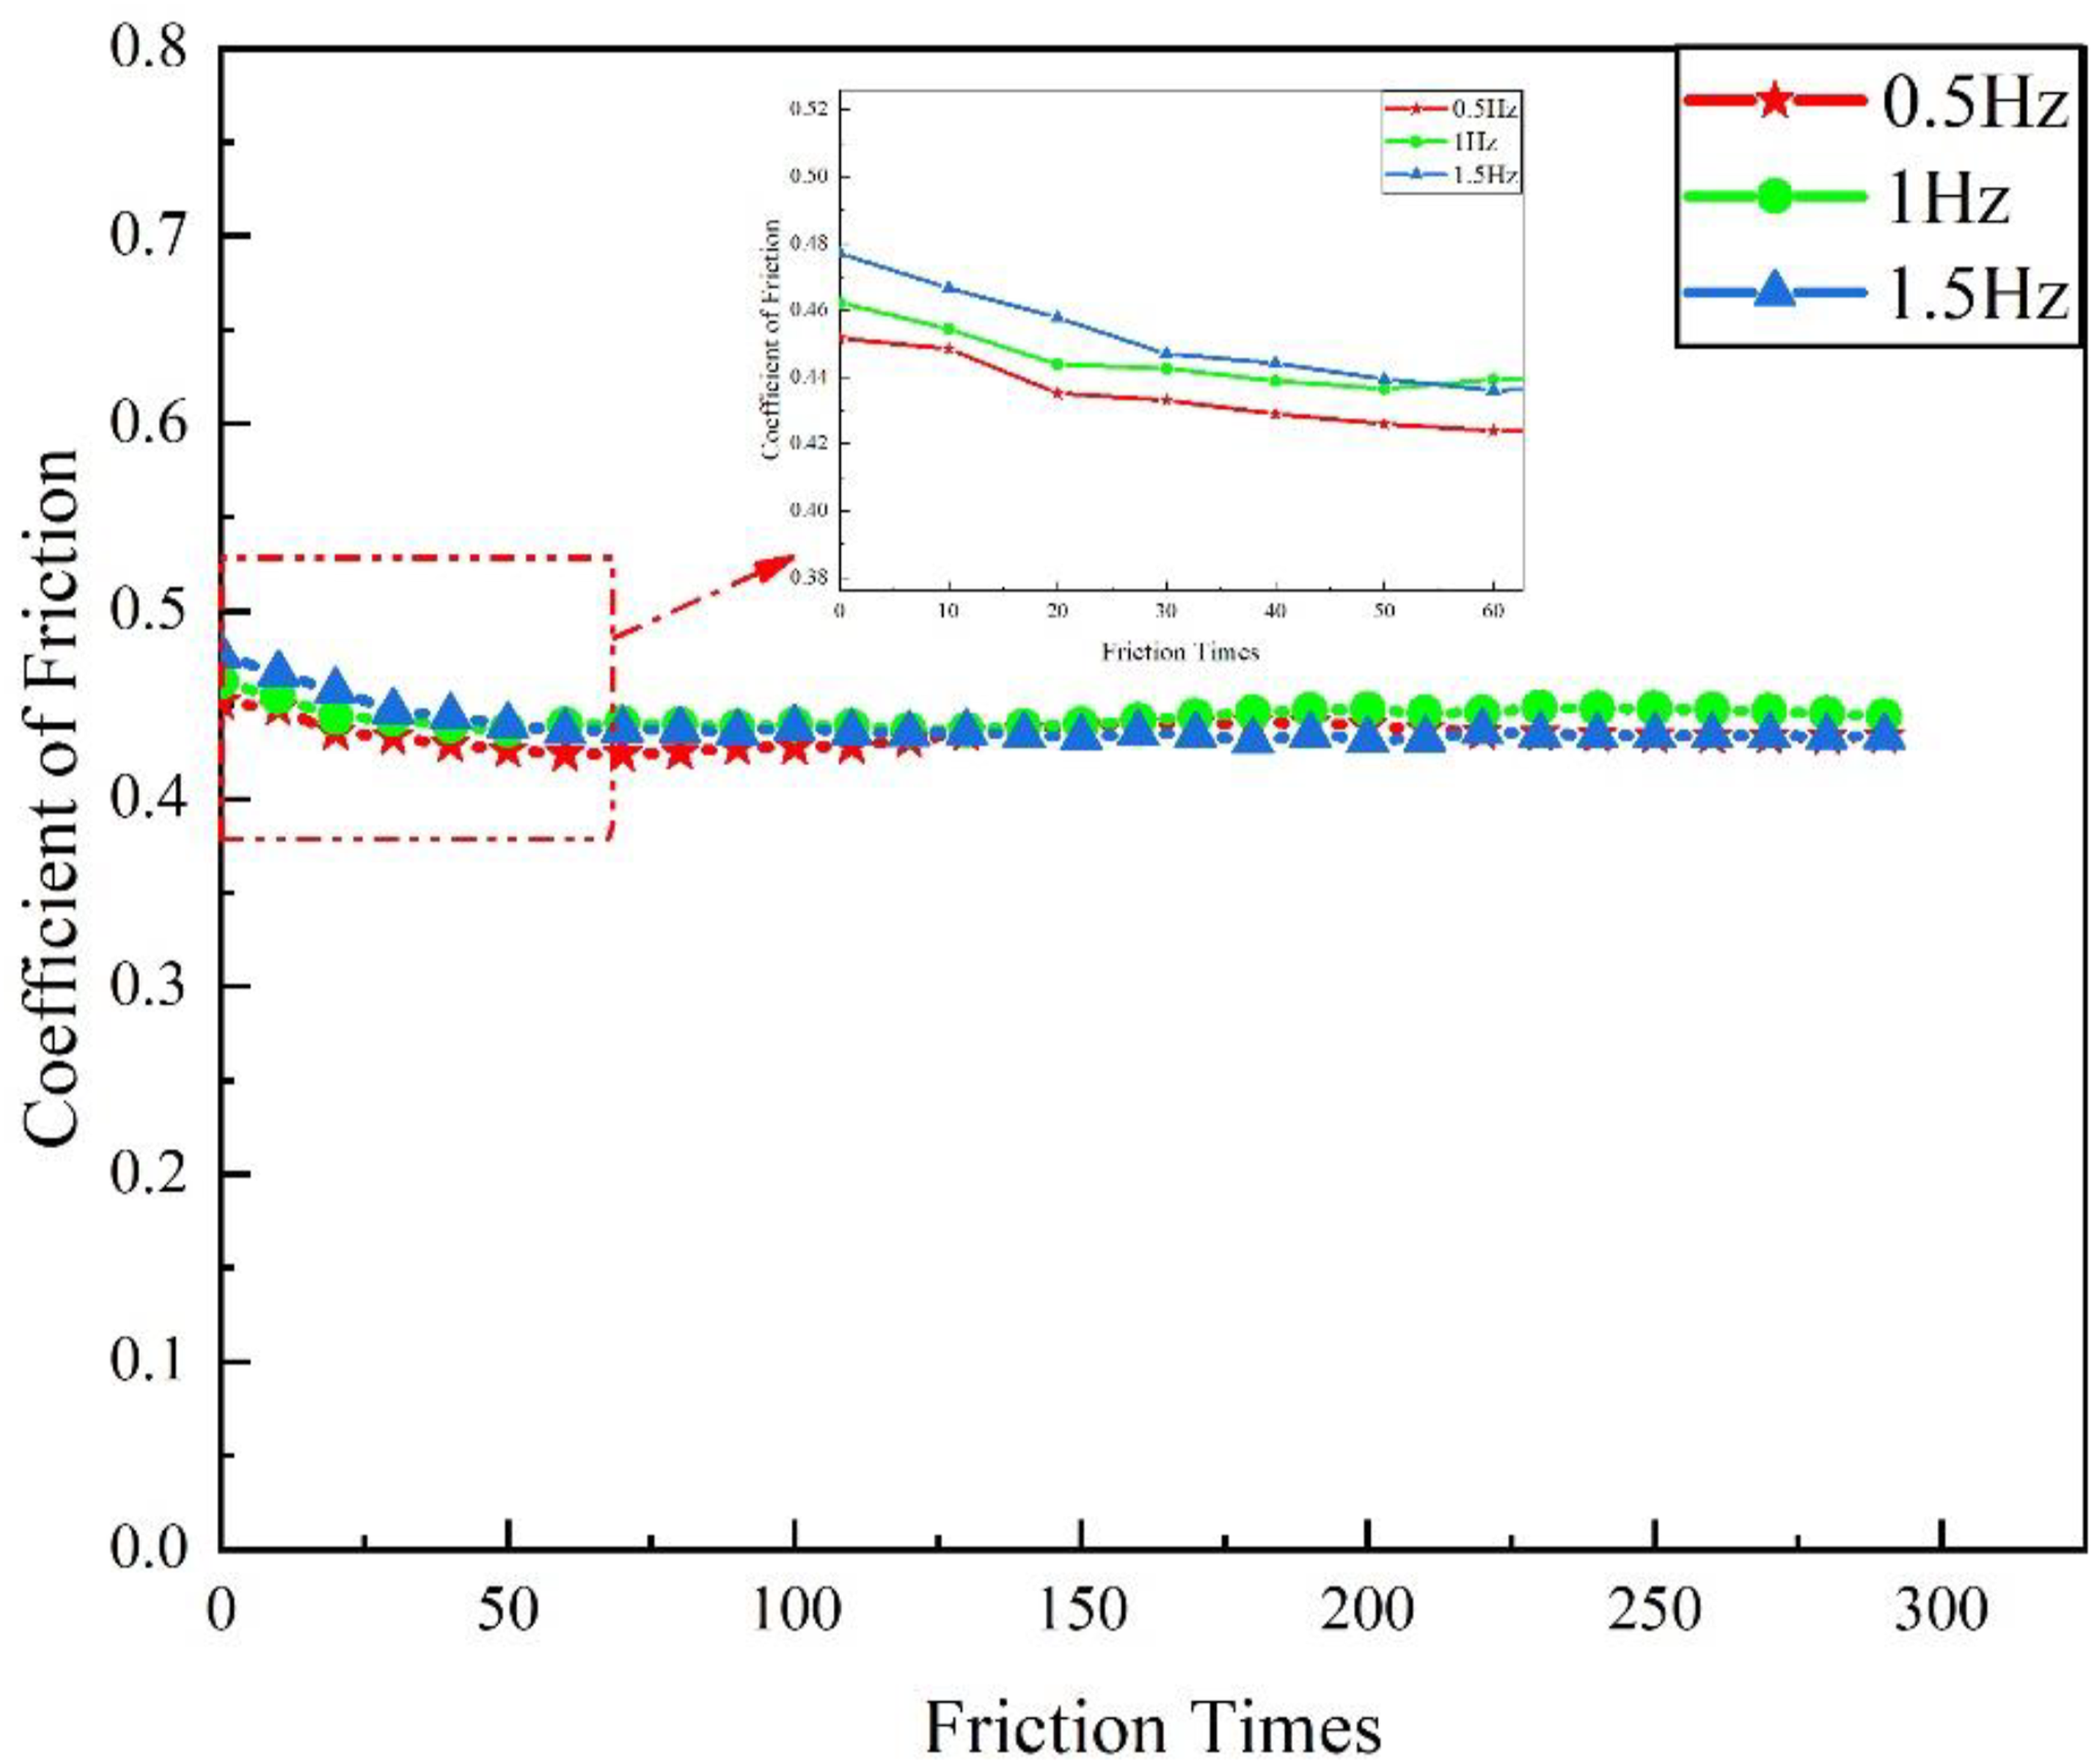
Figure 14(a) shows the tensile test diagram of the carbon fiber bundles on the lower fixture after friction by the universal testing machine according to ASTM D4018-99 standard. Before the test, the carbon fiber bundle after friction was immersed in the prepared E51 epoxy resin for 3 min, then naturally cured at room temperature for 12 h, and then cured in an oven at 120°C for 120 minutes
40
As shown in Figure 14(b), to prevent the fibre bundle from slipping during the stretching process, the two sides of the carbon fiber bundle after friction were fixed on the reinforcing sheet with 502 adhesives. Then the two sides of the reinforcing sheets are fixed on the upper and lower fixtures of the universal testing machine. The tensile properties of the carbon fiber bundles were tested with a loading speed of 1 mm/min, and the tensile fracture strength of carbon fiber bundles after friction at different friction frequencies were tested. Tensile test diagram: (a) Tensile specimen on the machine; (b) Tensile test specimen.
As can be seen from Figure 15, the tensile breaking strength of the carbon fiber bundle after friction frequency of 0.5 Hz, 1 Hz, and 1.5H was 58.589 N, 59.070 N, and 60.800 N, respectively. The tensile breaking strengths at friction frequencies of 1.5 Hz and 1 Hz increased by 3.7% and 0.8% respectively when compared to 0.5 Hz. From the above analysis, it can be concluded that the effect of friction frequency on the tensile breaking strength at the bonding point of carbon fibre bundle is small and negligible. Tensile breaking strength of carbon fiber tows after different friction frequencies.
Conclusion
In order to study the influence of adhesive on the friction properties of carbon fiber at the yarn-adding place of variable cross-section three-dimensional knitting, a test fixture was successfully developed to simulate the interaction between carbon fibers in the process of variable cross-section three-dimensional weaving, and the effects of friction frequency, pretension and friction angle on the friction performance between carbon fiber bundles are studied. and the following main conclusions are obtained: 1) Stress concentrations were observed at the center of the friction area, where the wear of the carbon fibre bundles was more pronounced at the center of the friction and a greater number of fibre breaks were produced. 2) The friction angle has the greatest influence on the friction at the bonding point of carbon fiber. The friction coefficient at the friction angle of 60° is 1.16 times that at the friction angle of 90°. In a certain range, the friction coefficient decreases with the increase of the friction angle, and the specific wear rate at the friction angle of 60° is 2.5 times that at the friction angle of 90°, and the specific wear rate decreases with the increase of the friction angle. 3) The friction coefficient of preloaded tensions 2N and 1.5 N is increased by 7.5% and 6.3% respectively compared with that of 1N. Compared with the friction angle, the pre-tension has little influence on the friction performance between carbon fiber bundles, and the number of fiber ends on the surface of carbon fiber bundles was similar under three pre-tension conditions. 4) The friction coefficient of carbon fiber bundles was almost the same at different friction frequencies, but the equilibrium state of friction coefficient increases with the increase of friction frequency. The tensile breaking strength at 2 Hz is 3.7% higher than that at 1 Hz, and the friction frequency has little influence on the friction properties of carbon fiber bundles.
In the future research. The finite element simulation of dynamic and static mechanics under different friction parameters should be strengthened, especially using progressive damage method to simulate the failure process of fibers.
Footnotes
Declaration of conflicting interests
The author(s) declared the following potential conflicts of interest with respect to the research, authorship, and/or publication of this article: The authors declare that they have no known competing financial interests or personal relationships that could have appeared to influence the work reported in this paper.
Funding
The author(s) disclosed receipt of the following financial support for the research, authorship, and/or publication of this article: This work was supported by the We thank the Shaanxi Provincial Key Research and Development Programme (No. 2022NY-057, 2023-YBGY-466); Shaanxi Qinchuangyuan “Scientist + Engineer” Team Construction Project (No. 2022KXJ-013); and Shaanxi Provincial Special Support Programme for Teaching Master Teachers and Leading Talents Project (Shaanxi Talent Office Letter No. [2022] 6);Science and Technology Directed Project of Xi'an Key Laboratory of Textile Composite Materials (No. xafzfc-zd01) for the financial support of this research.
Data Availability Statement
The raw/processed data required to reproduce these findings cannot be shared as the data also forms part of an ongoing study. The relevant data can be made available on request.