
Abstract
Selected 215/55 R17 radial tires for material test to obtain relevant material parameters. Used these parameters to build a finite element model and conduct longitudinal slip simulation. The relationship between longitudinal force and slip rate at different speeds and loads was determined by tire longitudinal slip tests. Then the longitudinal slip simulation results were compared with the test results to verify the feasibility of the model. The circumferential and axial rebar force of the belt layer at different speeds and the extreme value of the circumferential rebar force on the reverse-envelope of different skeleton materials were analyzed. The results show that: in the static state, the cord force of the belt layer had shown a trend consistent with the direction of the cord arrangement. As the speed increased, the belt cord force exhibited significant fluctuations and asymmetry. The rebar force of the turn-up points on the belt and ply is significantly smaller compared to the fetal crown ply. The rebar force at the fetal crown and belt wrapping points at 60 km/h was smaller than at 40 km/h and 80 km/h. The cord force of the fetal crown ply and the belt ply is much more affected by the load than that of the ply.
Introduction
The tire is the intermediate medium connecting the ground and the car. During the longitudinal skid, the tires mainly play the functions of regulating the speed of the vehicle and controlling the driving and braking of the vehicle. However, during the longitudinal sliding process, the overall deformation of the tire is severe, and the skeleton material of the tire is prone to damage. Wei Yintao and Shen Xiaoliang 1 predicted the six-component force of the tire by analyzing the steady-state rolling state of the tire. Finally, A new method to describe the tire rolling kinematics and calculate the tire forces and moments was presented. Li Li et al. 2 and Ge Shuqing et al. 3 analyzed the ground contact characteristics and static stiffness of tires through Abaqus software and experiments. The results indicate that under standard atmospheric pressure, as the load increases, the maximum normal stress of the tire moves from the center of the tire crown to both sides of the tire. Chen Wenyuan et al. 4 analyzed the tire footprint by finite element method. The results indicate that using finite element analysis to simulate the contact morphology of tires can shorten the design and development cycle. Shoop S et al. 5 studied the motion state and force analysis of radial tires on a deformable base. And used the analysis results to explore the effects of tire and terrain variables on vehicle maneuverability and terrain deformation. Jenog KM et al. 6 used finite element technique to study the puncture pressure of the load meridian. It was found that finite element modeling can effectively predict tire burst pressure and identify the pressure that reaches the breaking force of the steel bead steel wire. Li, Quantong et al. 7 predicted and analyzed the longitudinal slip rate in potholes. A modified slip rate control strategy based on sliding mode theory was proposed. This scheme can accurately estimate the vertical tire displacement and longitudinal reference speed, thereby improving braking safety. Haichao Zhou et al. 8 proposed an estimation method for the longitudinal force of smart tires based on the strain physical model. This algorithm can accurately predict the longitudinal force of intelligent tires, thereby providing useful information for vehicle stability control systems. Zhou F et al. 9 studied the static steering mechanics of tires by offsetting the steering axis. This study can provide a basis for estimating the steering driving torque of flexible chassis and optimizing device parameters. Tian L et al. 10 and Sun P et al. 11 studied the stress and deformation of the cord under high-speed tire conditions and the viscoelasticity of the cord of the dynamic tire, respectively. It was found that during the rolling process of high-speed tires, the wavelength of the sidewall standing wave increases with the increase of vehicle speed. And the relationship between cord stress and standing waves was determined. Pawel Baranowski12–14 conducted a series of static and dynamic tests using a program and Split Hopkinson pressure bar to obtain tire material parameters and convert them into appropriate constitutive models. In complex working conditions, the author used rubber explosion-proof ring tires and honeycomb composite tires for simulation research on explosive load conditions. By changing parameters such as tire cords, the strength, resistance, and explosion resistance of the tires were improved. Those methods provided strong assistance for modeling in this study. The above scholars have all conducted a certain analysis on the deformation of the tire under different working conditions and the stress on the cord, but have not conducted a deeper study on the stress on the cord during the longitudinal sliding process of the tire. This article was based on the PAC2002 model to fit experimental data such as tire slip rate, and obtained the numerical relationship between slip rate SR and longitudinal force Fx. Then, a finite element model of the tire under longitudinal sliding conditions was established in Abaqus software, and the feasibility of the model was verified through experimental data. By analyzing the tire model under longitudinal slip conditions, the deformation and stress status of the tire cord under different slip rates were studied. The vulnerable position of tire cord was predicted, and certain enhancement measures were given. This method can accurately observe the stress status of tire cord fibers during tire slip deformation. By monitoring the extreme points of the circumferential stress on the cord fibers, targeted reinforcement of the tire skeleton layer can be achieved.
Longitudinal slip test theory and principle
The tire longitudinal slip test is a branch of the tire six-component force test, which mainly studies the relationship between the tire slip rate SR and the longitudinal force Fx at different speeds. As shown in Figure 1, during longitudinal sliding, the longitudinal force Fx is the force acting on the tire along the X-axis by the road. The specific role of tire longitudinal force in the process of driving and braking is to accelerate or decelerate the vehicle. When Fx is positive, the tire is driven. At this time, Fx is the driving force. When Fx is negative, the tire is under braking. At this time, Fx is the braking force. The tire slip rate SR is caused by the difference between the wheel center angular velocity Tire coordinate system.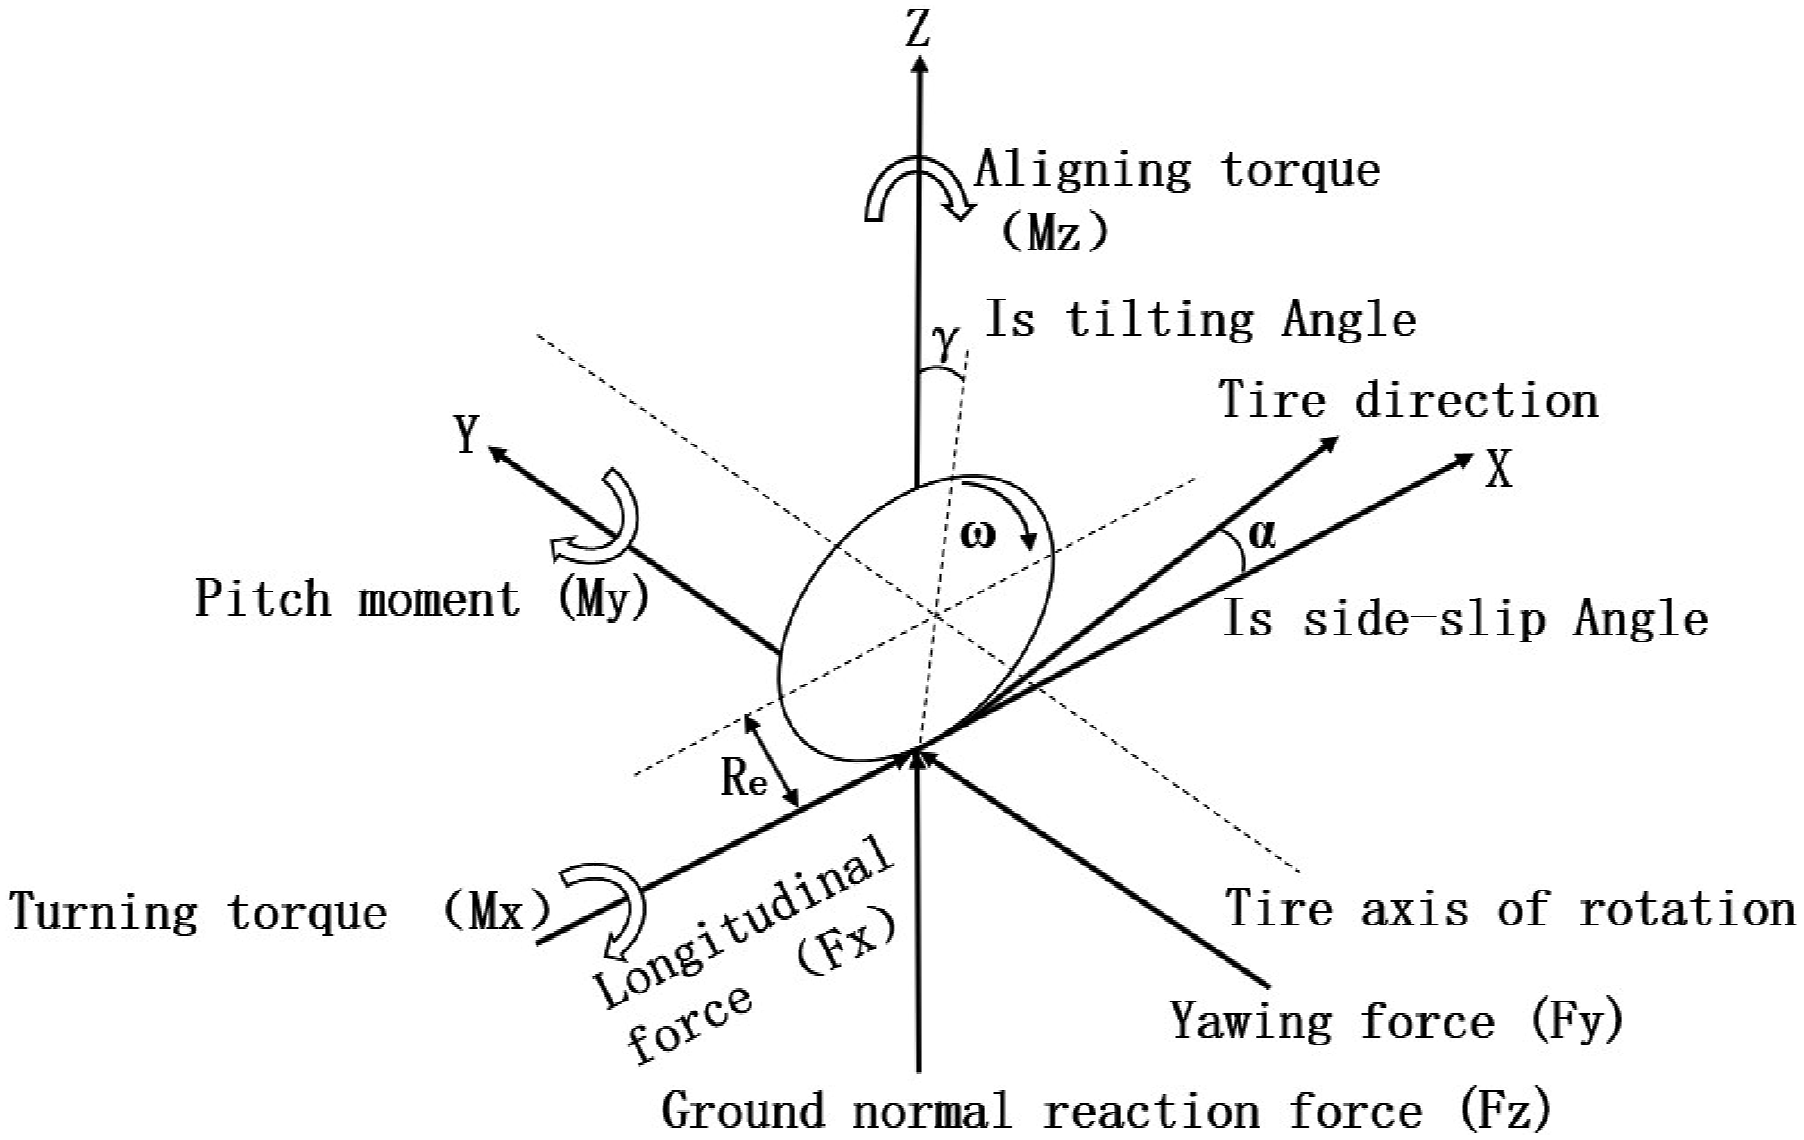

When running a tire slip test, precise control of the speed is required. As shown in Figure 2, the tire is placed on a steel belt supported by two rotating drums. Slip is achieved by applying a fixed angular velocity ω (rad/s) to the tire and simultaneously applying an angular velocity Schematic diagram of steel belt road.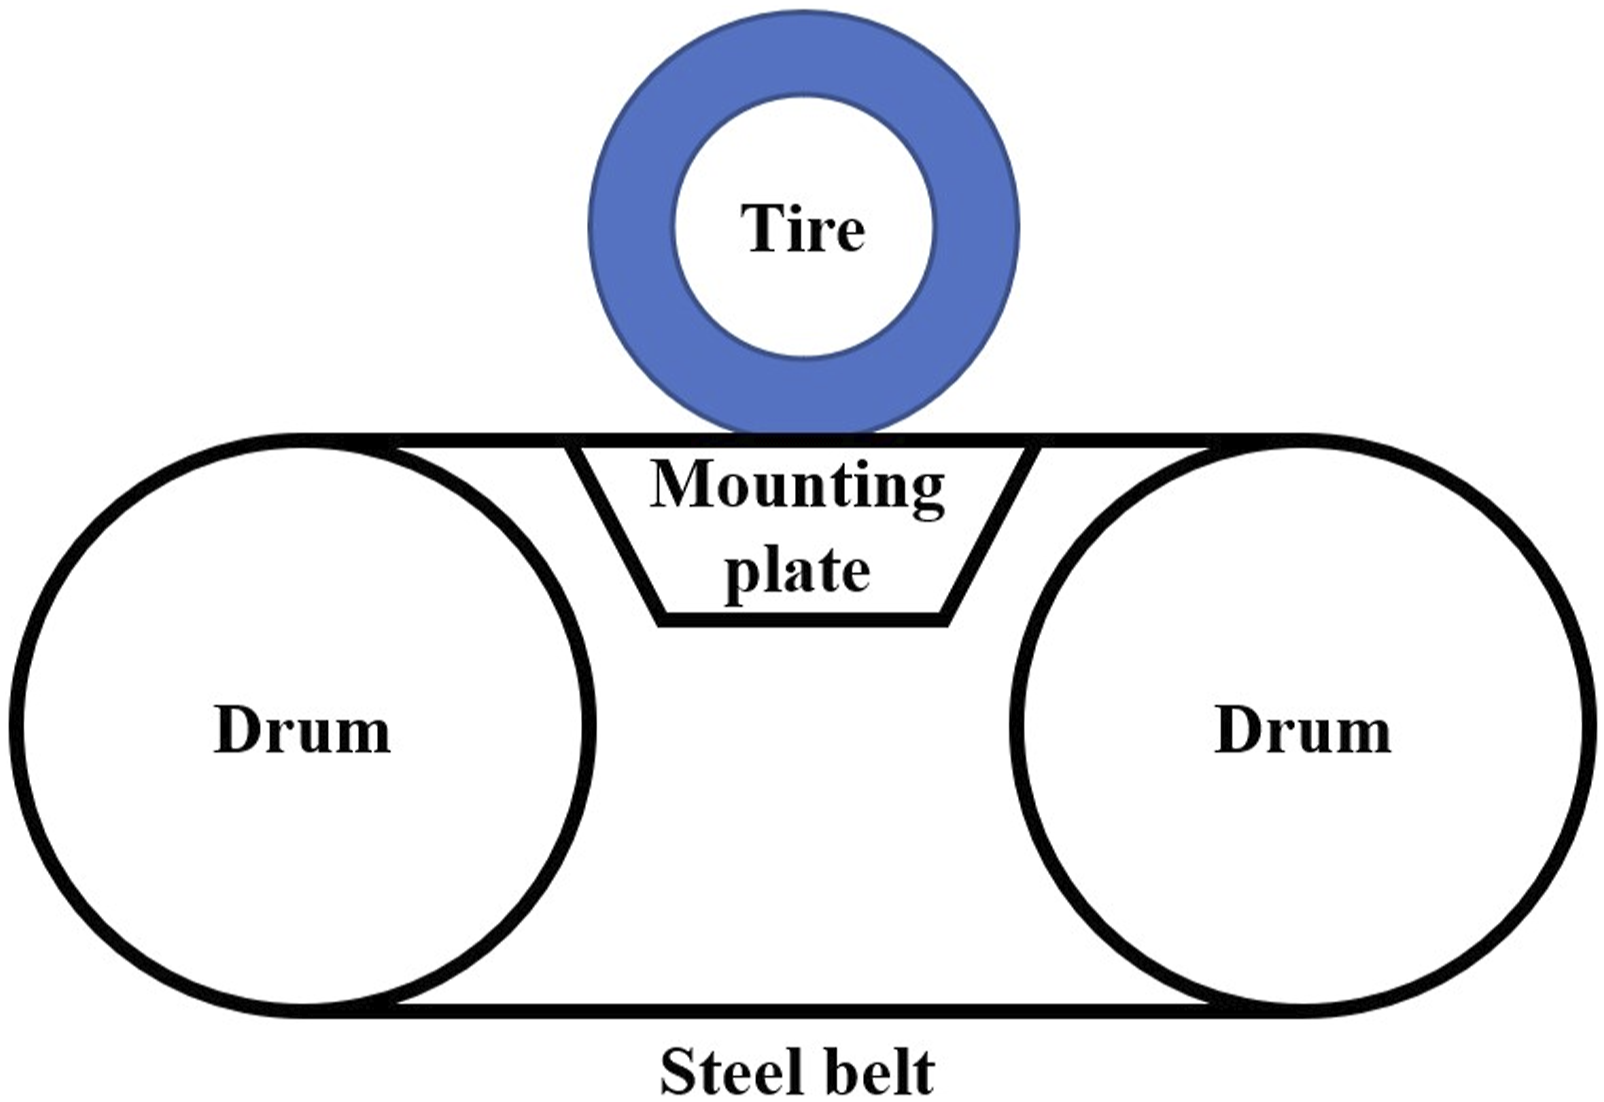
The data of the tire test process is measured by sensors on the support platform. The data vibration after general experiments and simulation measurements is relatively large, and the regularity is not strong. It is necessary to process the data through relevant formulas to make it regular. This study used the PAC2002 model to regularize experimental and simulation data. The data of driving and braking slip ratios are obtained and then fitted by the PAC2002 model. Its related parameters are shown in Figure 3. The basic form of the PAC2002 tire model formula:
15
D determines the peak value of the model curve, called the crest factor. C determines the use of the sine part, so it affects the shape of the overall curve, called the shape factor. B determines the trend of the extension curve, which is called the stiffness factor. E corrects the characteristic of the curve near the peak, called the shape factor. PAC2002 tire model curve and its main influencing parameters.


The longitudinal force calculation under pure longitudinal slip condition can be derived from equation (2). In pure longitudinal slip conditions, there is no slip angle. The inputs to the calculation formula are slip rate, vertical load, and roll angle. The output of the formula is the longitudinal force. As shown in formula (3):


Tire finite element model
Tire material test
As shown in Figure 4, the rubber material of each part of the tire and the extracted cord material were placed on a material stretching machine for tensile test. The rubber material was stretched to 3 times its original length, and the skeleton material such as the cord was stretched until it just breaked. The stress-strain parameters of rubber and cord materials were obtained through uniaxial tensile tests of multiple groups of materials. Material uniaxial tensile testing.
Drew the corresponding stress-strain curve from the measured data. The data of tensile and compression tests and several sets of constitutive model data were fitted by Origin software. Due to the maximum deformation of the tread when the tire is grounded, this study compared the tensile test data of the tread rubber adhesive with the data of various constitutive models to select a suitable constitutive model. As shown in Figure 5, by comparing the test data with the constitutive model, it was found that the tensile data of this tire sample fitted the Yeoh model best. Therefore, the constitutive model equation of Yeoh was used to perform parameter transformation operation on the original rubber stress-strain curve. Three model parameters of C10, C20, and C30 were obtained, as shown in Table 1. And the corresponding framework material parameters are shown in Table 2. The constitutive equation of the Yeoh model: Constitutive model fitting curve. Yeoh model parameters of different rubber materials. Yeoh model parameters of different rubber materials.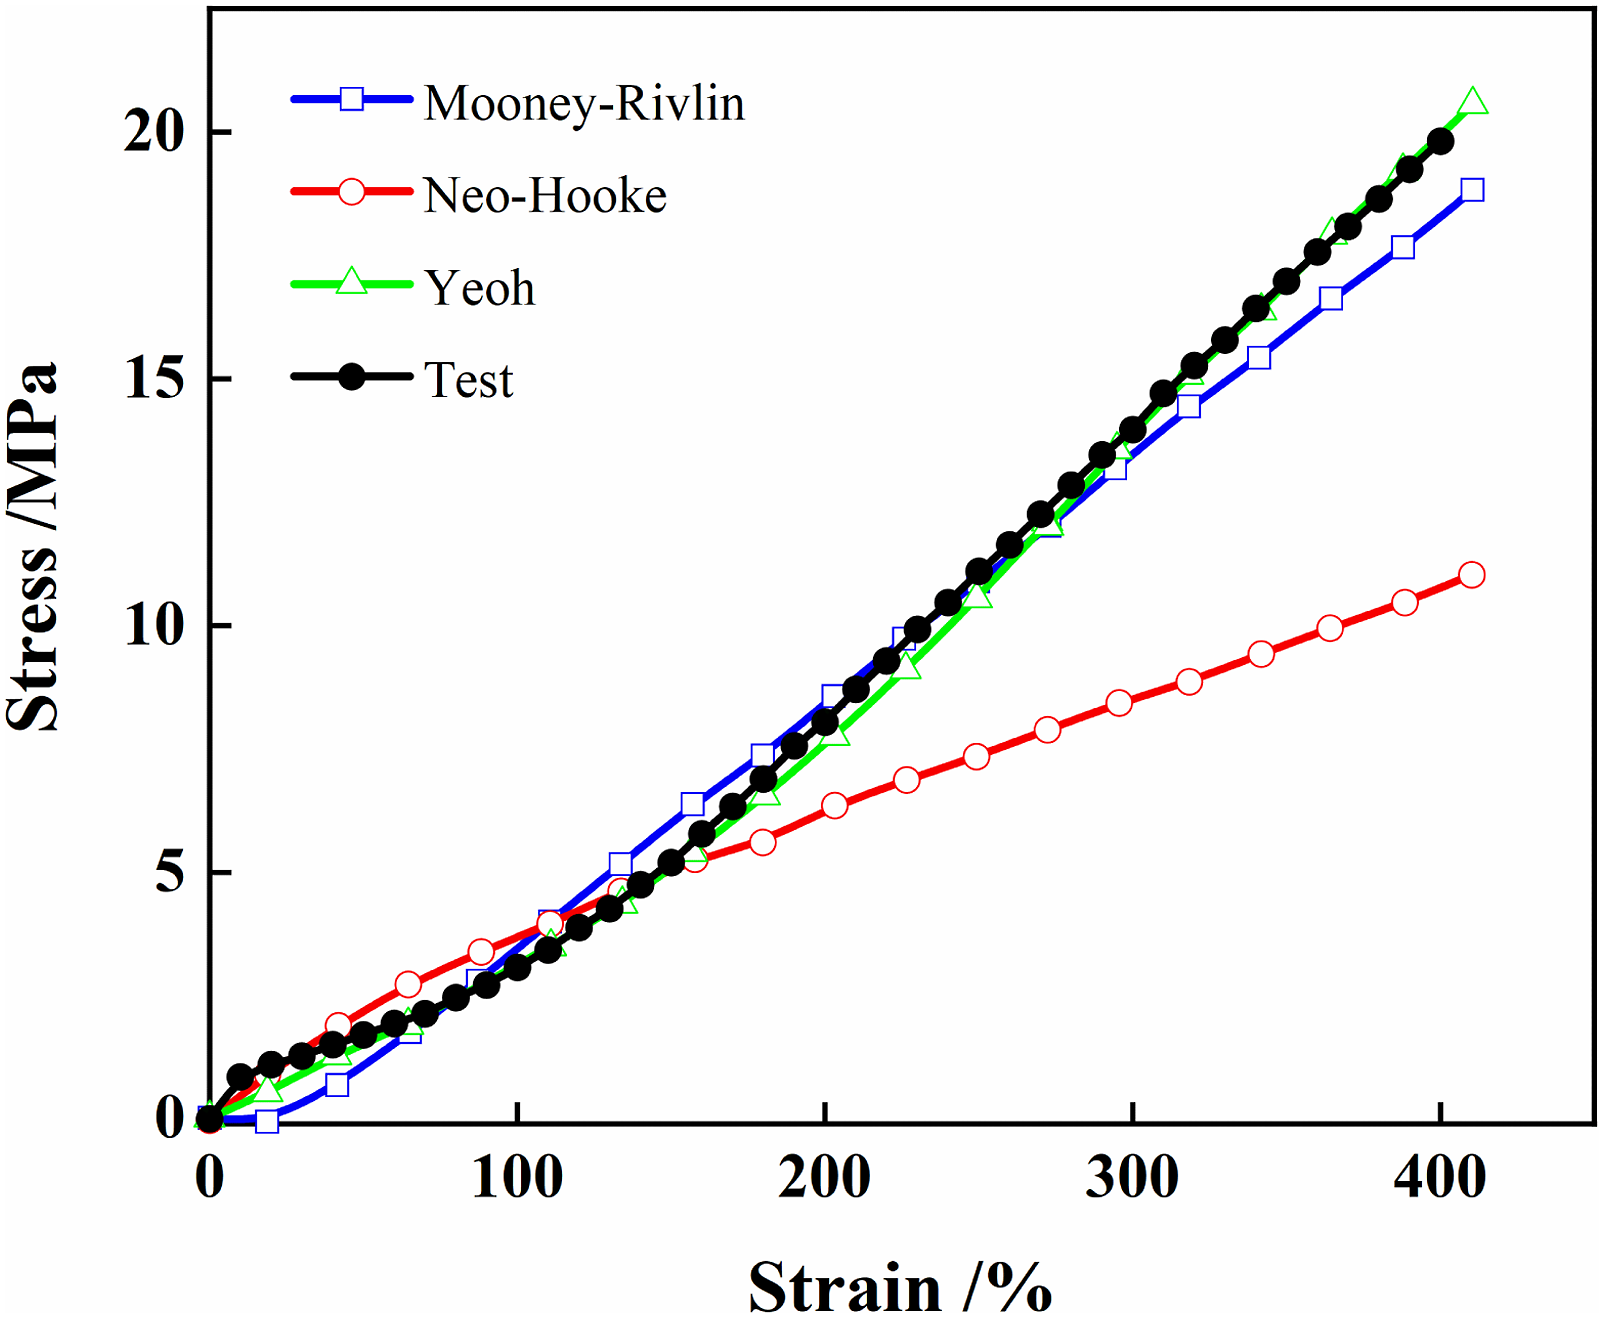


3D tire model establishment
The tire is roughly divided into tread, belt layer, inner liner, bead ring, sidewall, apex and other parts through the above material test. Used Abaqus software to divide the tire section into corresponding Sets and assigned corresponding material properties. The skeleton materials such as the belt layer, cord layer, and crown layer were embedded into the interior of the tire through the * embedded command. The tire section is shown in Figure 6(a). The section was then mirrored and processed with the *SYMMETRIC MODEL GENERATION command. Rotated it 360° in the circumferential direction to become a complete pneumatic tire model. The complete 3D tire model is shown in Figure 6(b). The 2D model has 764 nodes and 670 mesh elements. The 2D reinforcement mesh element type is SFMGAX1 surface element, and the rubber part mesh element type is CGAX4RH axisymmetric element. The 3D model has 38,200 nodes and 33,500 mesh elements. The 3D reinforcement mesh element type is SFM3D4R surface element, and the rubber part mesh element type is C3D8RH element. Tire Finite Element Model. (a) The tire section (b) 3D tire model.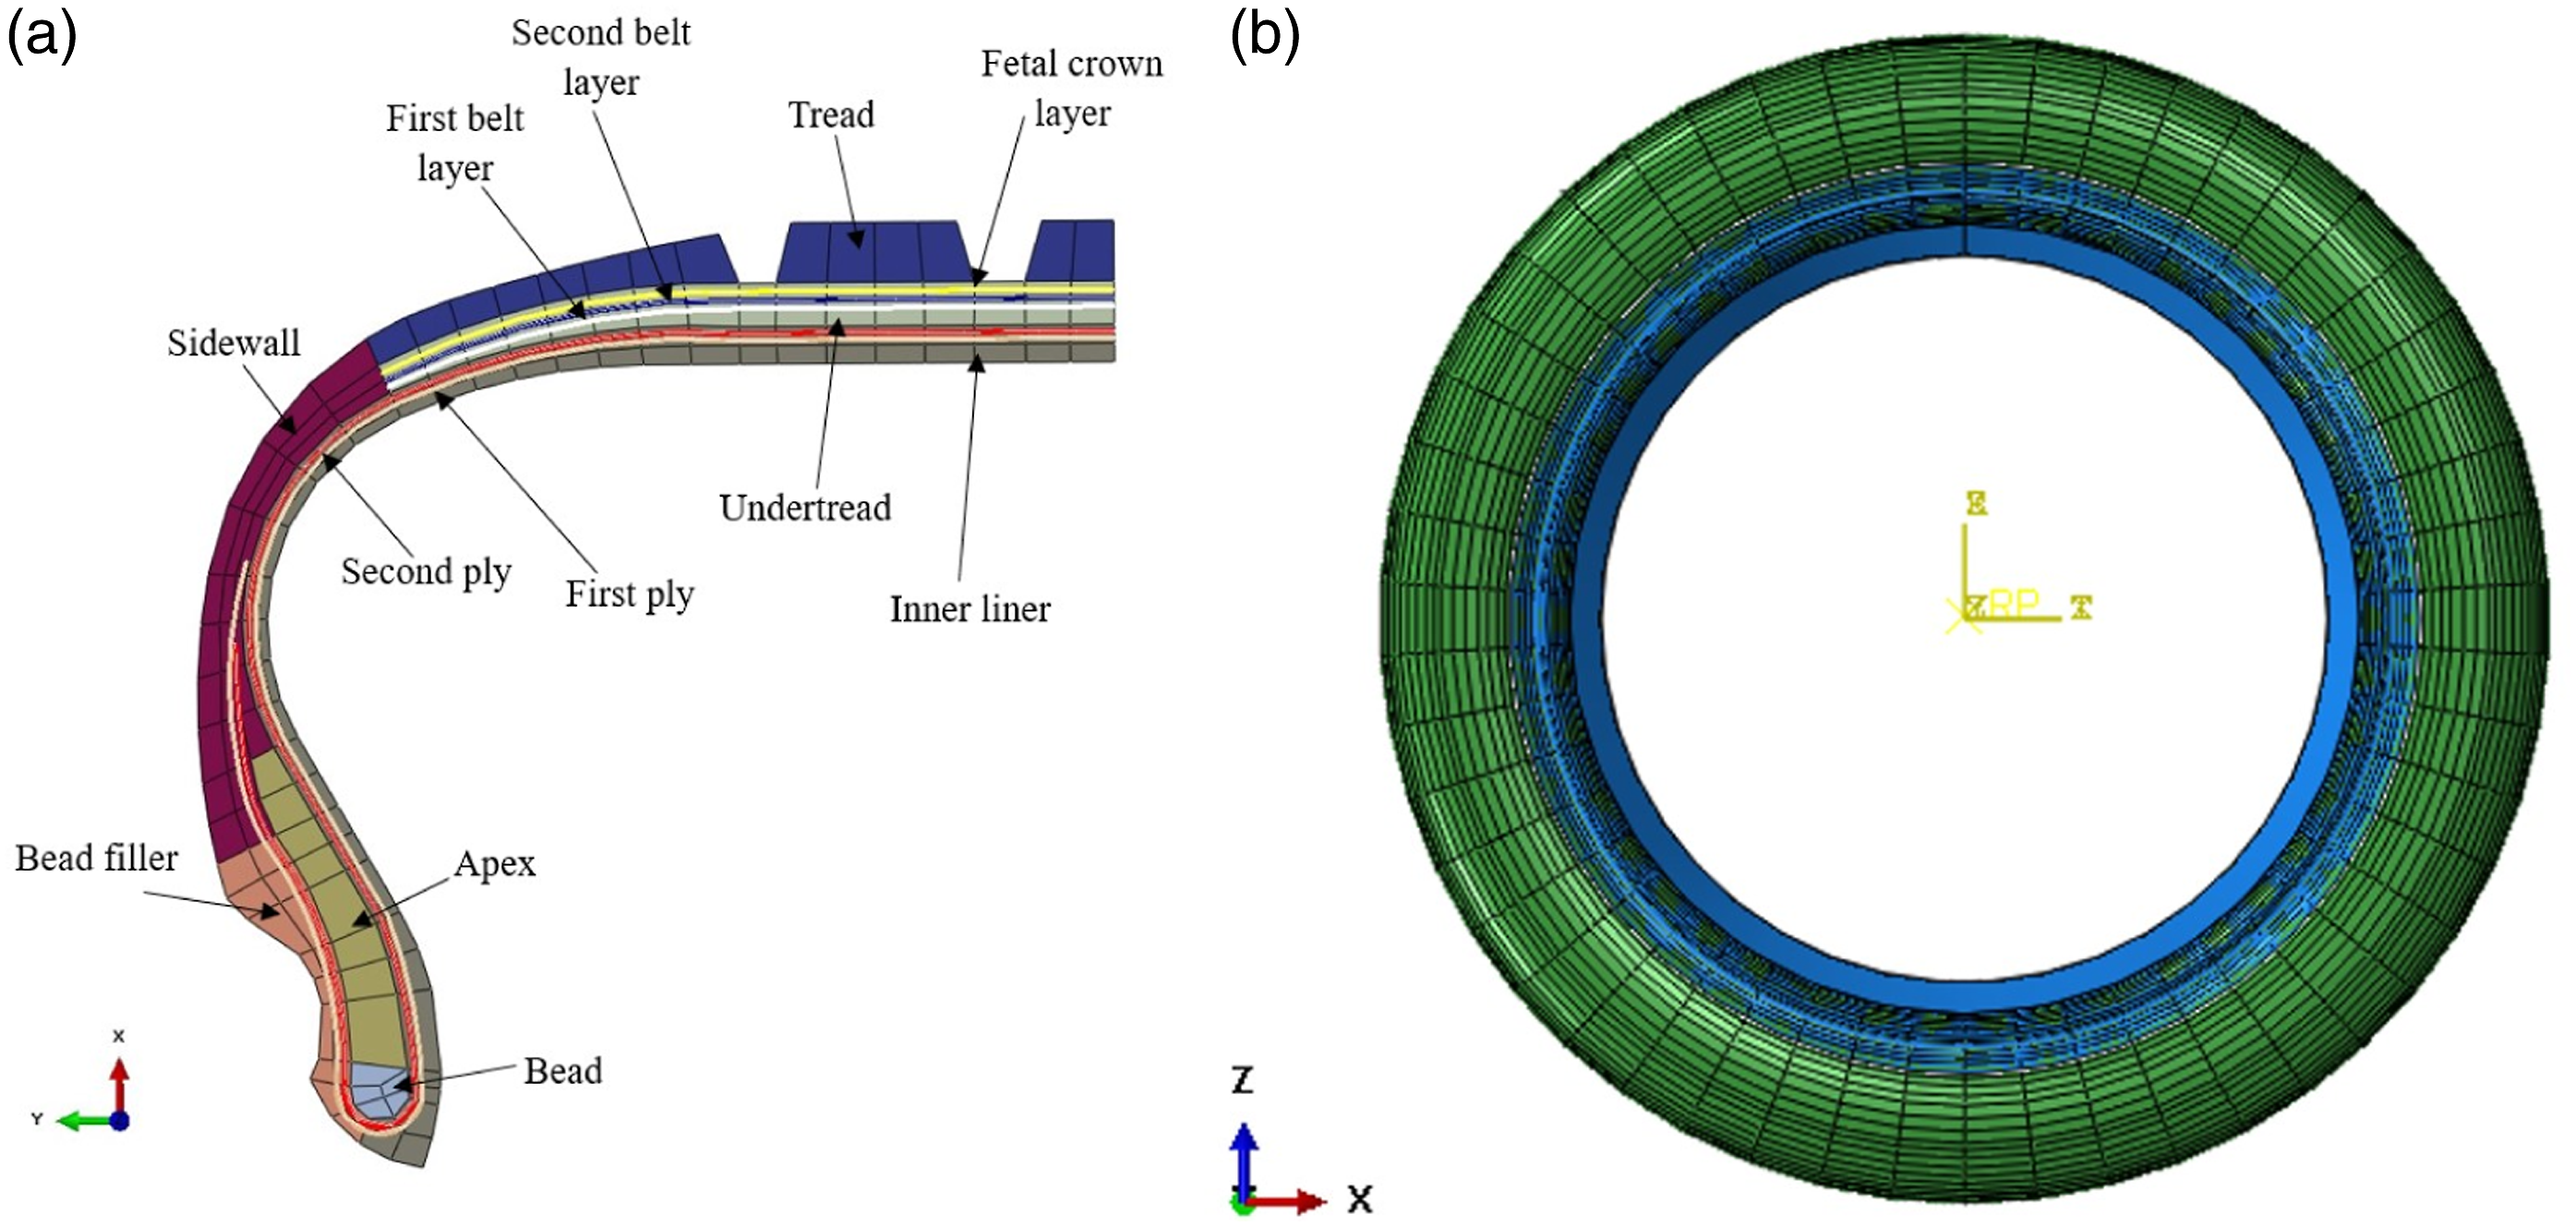
As shown in Figure 7(a), the cord of the first belt layer is at 67° to the meridian direction. The cord of the second belt layer is at −67° to the meridian direction. The cord of the fetal crown layer is 90° to the meridian direction. The cord of the first and second plies are both at 0° to the meridian direction. The cord of the bead steel wire layer is at a 90° to the meridian direction. The embedding method of all skeleton layers in the tire is shown in Figure 7(b). The layout of the cords in the model. (a) Schematic diagram of skeleton layer cord (b) Skeleton layer embedding method.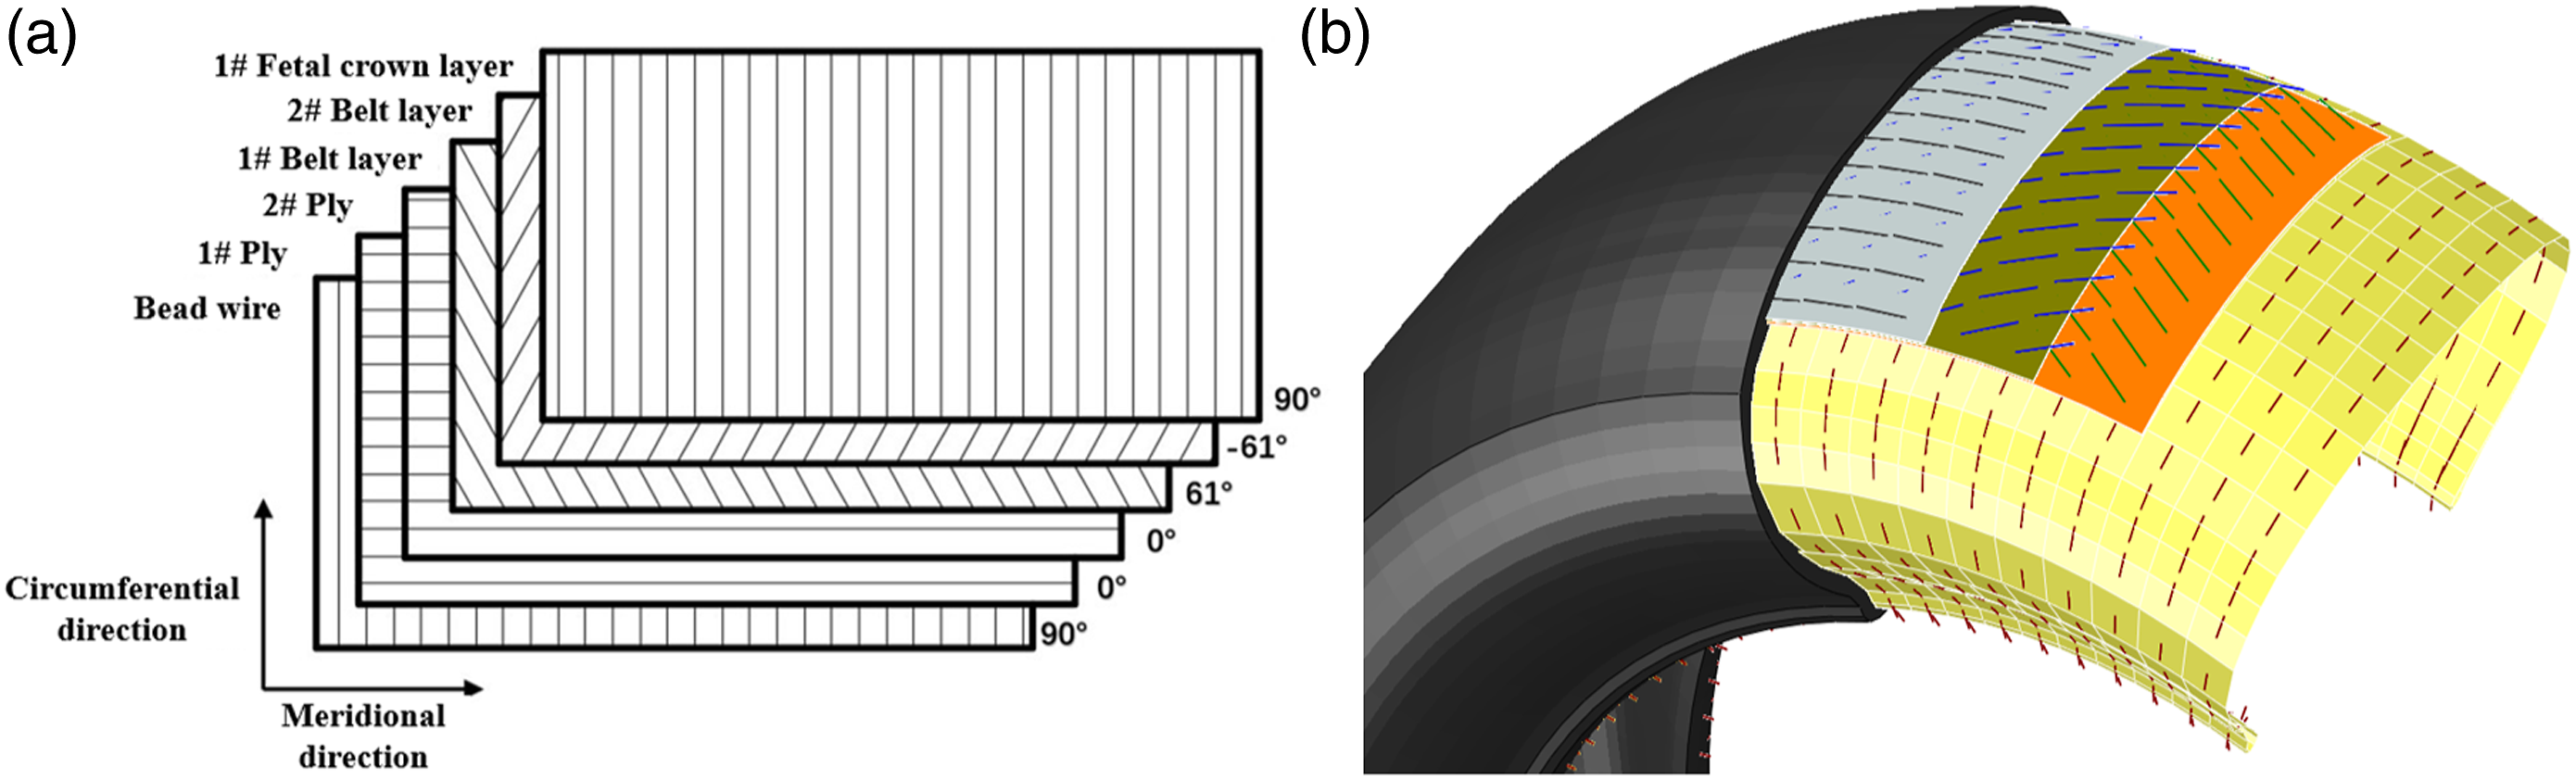
After establishing the tire finite element model, it was necessary to verify its inflation and radial stiffness. Figure 8(a) shows the tire grounding test, and Figure 8(b) shows the tire grounding simulation. The radial stiffness test was conducted on a tire comprehensive testing machine, which deformed the tire by applying radial loads. The simulation useed an analytical rigid body instead of the ground to simulate the process. The contact type between the tire tread and the ground model adopted surface to surface contact. When inflating a tire, fixed the center reference point of the tire to the ground reference point. When the tire was loaded, the load was applied in reverse to the ground reference point until the tire deformed. Throughout the entire process, the tire inflation pressure was maintained at 250 kPa, and the applied loads were 2337 N, 3936 N, 4920 N, and 6396 N. Test and simulation analysis diagram of tire. (a) Tire grounding test. (b) Tire grounding simulation. (c) Comparison diagram of experimental and simulation data.
Figure 8(c) shows the comparison of tire grounding test and simulation data, with the horizontal axis representing the subsidence displacement and the vertical axis representing the radial force. Through comparison, it was found that the error is within 10%. It indicated that the simulation model can analyze tires in mechanical tests.
Error formula:
Tire longitudinal slip test and longitudinal force analysis
Tire slip test
The tire slip test is part of the tire six-component force test. The tire speed and slip rate of the tire are controlled by a six-component force bench test instrument. The longitudinal force is then monitored by the force sensor. As shown in Figure 9, 215/55 R17 radial tire was selected for the test. First, the side slip angle of the tire was controlled to be kept at 0° by the side slip angle controller shown at two in Figure 9. Then, the roll angle of the tire was controlled to be kept at 0° by the roll angle controller shown at three in Figure 9. Placed the tire on the test bench spindle. A fixed rotational speed ω (rad/s) was given, and radial force was applied through the hydraulic rod. The tire was brought into contact with the steel belt shown at one in Figure 9. The angular velocity ω
0
(rad/s) of the steel belt relative to the center of the hub was provided by two large drums. The purpose is to cause a difference in rotational speed with the tire, which will cause it to slip. Tire six-component force bench test instrument.
Tire longitudinal slip simulation
Tire longitudinal slip simulation is a finite element analysis that simulates the longitudinal slip test conditions. The main purpose is to study the stress of tire carcass ply and belt layer through computer calculation. Identify the area where tire cords are concentrated during braking and driving, and increase the strength at that location. When the tire is in the rolling process, it is necessary to consider the viscoelasticity and damping of the tire material.
Described the viscoelastic material of the tire using the Prony series in material identification using Abaqus software. The shear modulus can be expressed as gi = 0.6. The bulk modulus can be expressed as ki = 0. Other relevant parameters are represented as tau-i = 0.1. The keyword expression of this parameter in Abaqus software is as follows: *VISCOELASTIC, TIME = PRONY **Viscoelastic parameters *06, 0.0, 0.1
The damping types of tires in the Abaqus software solver include material damping and numerical damping. Material damping is further divided into structural damping and Rayleigh damping. The mass damping (Alpha) and stiffness damping (Beta) used in this model are part of Rayleigh damping. Mass damping (Alpha) is used for implicit dynamics, and stiffness damping (Beta) is used for displaying dynamics. The rolling analysis in this article is used in tire display analysis, so stiffness damping (Beta) is chosen to represent the damping of the tire. The volume viscosity is represented by * BULK VISCOSITY, and the keyword expression of this parameter in Abaqus software is as follows: *DAMPING, BETA = 1E-7 **Damping parameters *BULK VISCOSITY **Volume viscosity *006, 1.2
The boundary conditions of the tire longitudinal slip simulation are carried out strictly according to the test procedure shown in Figure 9. The longitudinal sliding simulation is shown in Figure 10, and the simulation used the analytical rigid plate to simulate the ground. The simulation process was divided into four analysis steps: inflation, loading, rotation, and slip. The tire was rotated by applying a fixed angular velocity Tire slip simulation.
Longitudinal sliding test parameters without roll angle and yaw angle.

Tire longitudinal force analysis and model verification
Through the longitudinal slip test, the relationship between the slip rate and the longitudinal force of the tire under different speeds and load conditions was obtained. Then, the data were fitted by the PAC2002 model-related formulas such as formula (3-6). The slip rate-longitudinal force curve relationship shown in Figure 11 was obtained. It can be seen from Figure 11(a)–(c) that the tire longitudinal force will increase with the increase of the vertical load, and the change of speed has little effect on the tire longitudinal force. When the slip rate is −30% and 30%, the longitudinal force corresponding to the speed of 60 km/h is slightly lower. This shows that under the same slip rate, the longitudinal force of the tire will increase with the increase of speed and decrease with the increase of speed. In the figure, the negative slip rate is the tire braking phase, and the positive slip rate is the tire driving phase. By comparing the positive and negative slippage in the three figures, it is found that the peak longitudinal force of the tire during driving is greater than the peak longitudinal force during braking. This shows that the tire has a greater impact on the handling stability during the driving phase. Slip rate-longitudinal force relationship affected by vertical load at different speeds. (a) 40 km/h. (b) 60 km/h. (c) 80 km/h.
Through the analysis of Figure 11, it is found that the longitudinal force of the tire is positively correlated with the vertical load on the tire. It shows that the larger the load, the larger the error of the longitudinal force will be. Therefore, it is only necessary to compare the slip ratio-longitudinal force relationship corresponding to 6396 N at different speeds. As shown in Figure 12, the black curve is the experimental data after fitting, and the blue curve is the simulation data after noise reduction. Measure the maximum offset and calculate it. It is found that the error between the test and the simulation is within 10%, and the simulation can reflect the test process. Comparison of slip rate-longitudinal force relationship between simulation and test at different speeds. (a) 40 km/h. (b) 60 km/h. (c) 80 km/h.
Analysis of tire frame material
The tire carcass colloid and the cord and other skeleton materials are formed by mutual bonding, which causes the turn-up point of the skeleton layer such as the ply to easily cause the rubber to open and separate. This results in tire bulging and plastic deformation.
12
By simulating the longitudinal sliding process of the tire, the force analysis of the fetal crown ply, one# belt ply and one# ply in the tire frame material is carried out. As shown in Figure 13, the circumferential rebar force analysis is performed on the turn-up points of the three tire frame materials A, B, and C on the tire section. The belt layer is subjected to both circumferential rebar force analysis and axial rebar force analysis. The schematic diagram of the circumferential and axial directions of the belt layer is shown in Figure 14. Analysis points of the cord along the tire circumference. Schematic diagram of belt cord direction.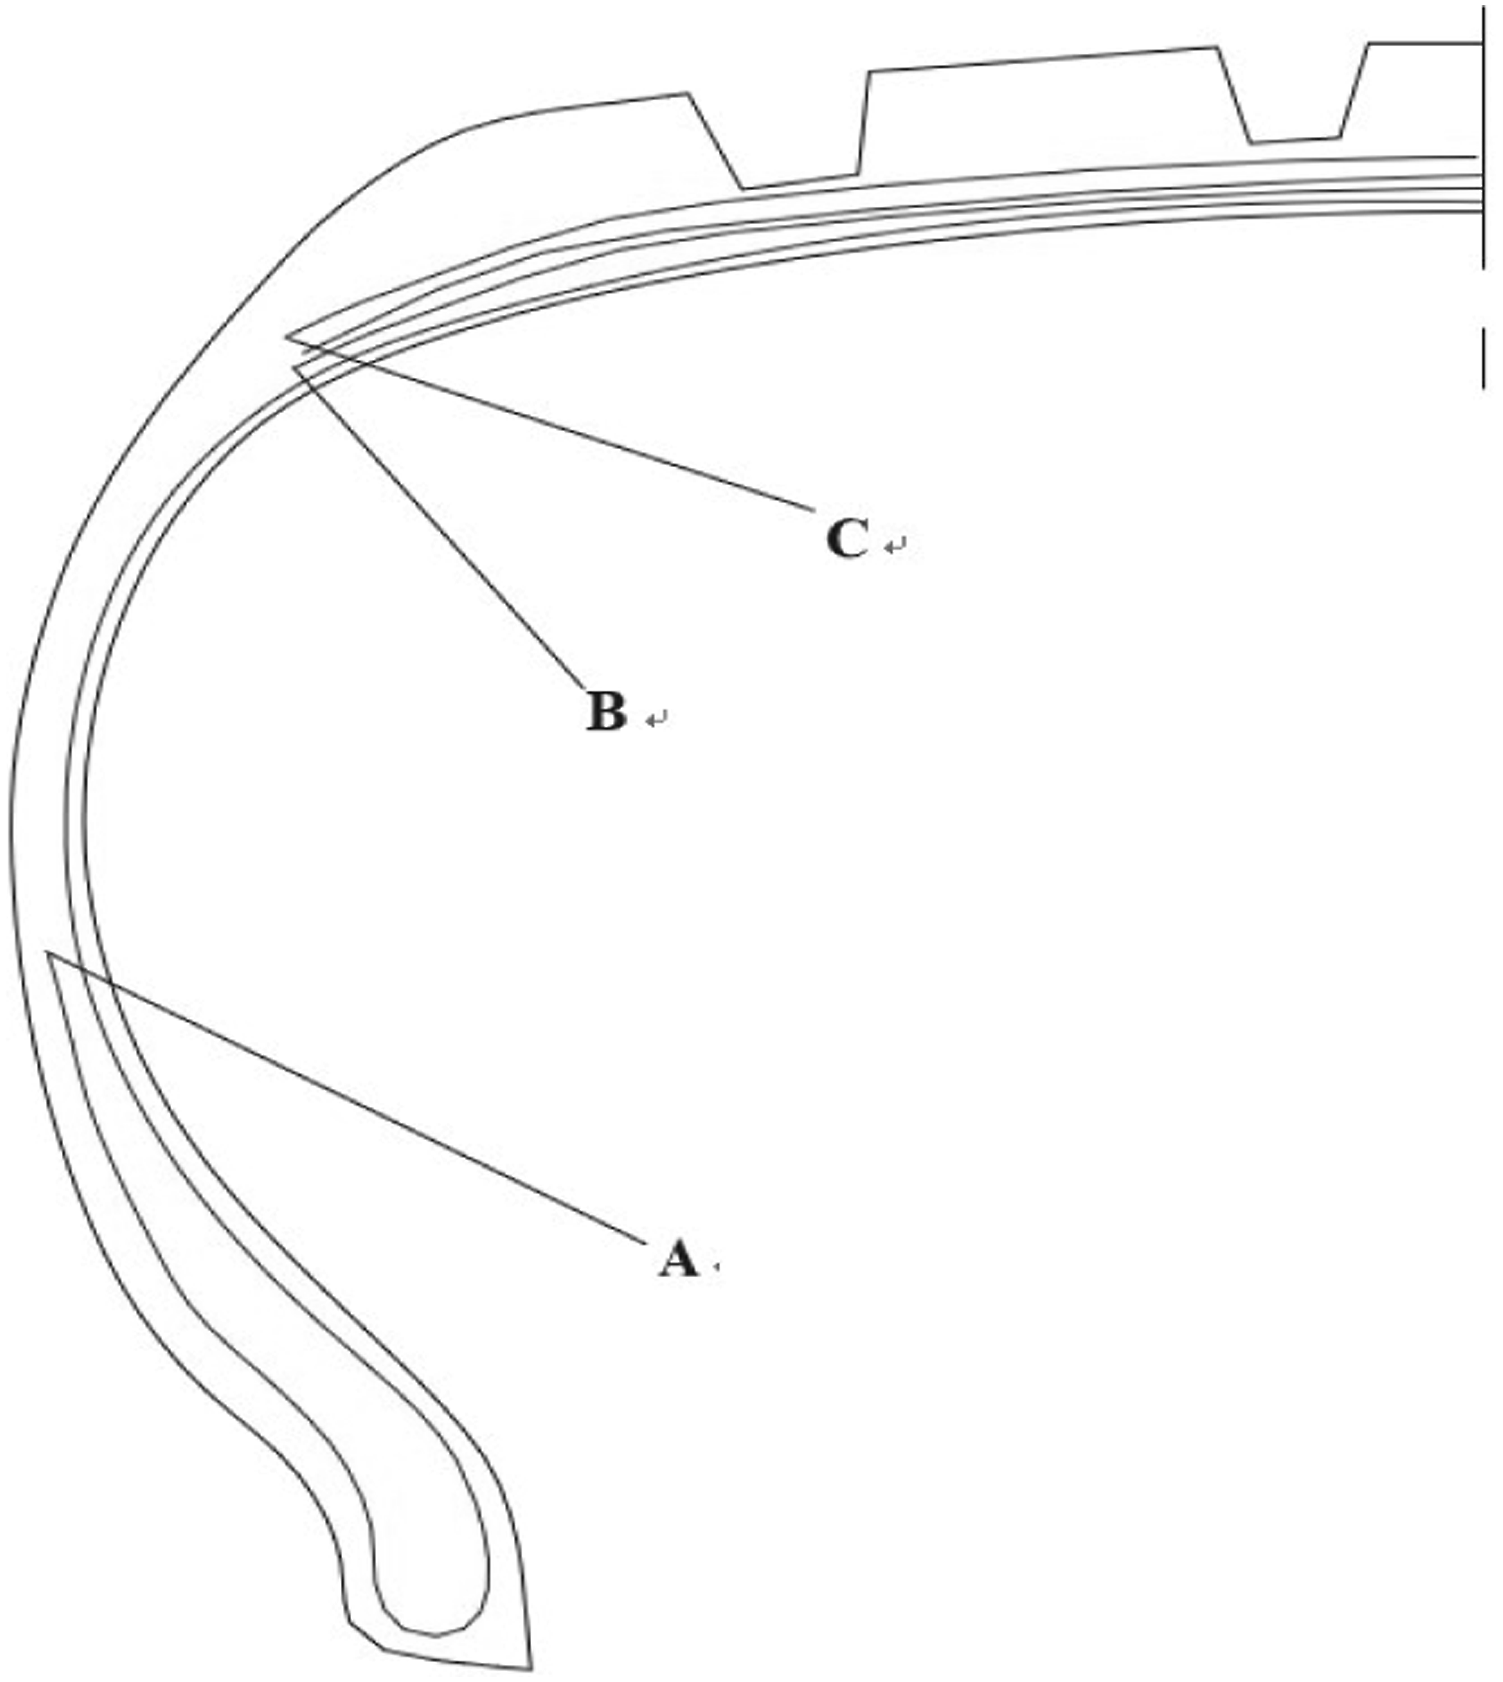

Axial force and asymmetry of belt layer
In order to observe the stress condition more clearly, the stress of the cord with a load of 6396N is selected for analysis. The rebar force of the tire's first belt ply cord is monitored by finite element. The stress conditions of the belt cord in the tire circumferential and axial directions at 0 km/h, 40 km/h, 60 km/h, and 80 km/h are plotted as shown in Figure 15. Analysis of Figure 15(a) shows that the belt layer exhibits a certain angle of rebar force distribution at the grounding position. Comparing with Figure 12, it can be seen that the angle of cord arrangement is consistent with that of the belt layer, which shows that the belt layer has obvious asymmetric phenomenon. At the same time, the stress area of the belt layer is mainly concentrated in the vicinity of 180° in the circumferential direction and 35 mm and 140 mm in the axial direction. Because this is the shoulder corner of the tire contact area, there will be significant stress changes. Analysis of Figure 15(b)–(d) shows that the belt cords show obvious fluctuations with the increase of speed. At the same time, the stress concentration point of the belt layer will also spread from the contact center to various positions in the circumferential direction. Comparing Figure 15(b)–(d) with Figure 15(a), it is found that the cord force with velocity will be significantly larger than the static cord force. However, as the speed increases, the maximum force on the cord does not change. On the whole, no matter whether the tire is stationary or moving, the force on the belt cord shows obvious asymmetry, and this phenomenon will become more obvious as the speed increases. Rebar force analysis of belt layers along the tire circumferential and axial directions at different speeds. (a) 0 km/h. (b) 40 km/h. (c) 60 km/h. (d) 80 km/h.
Circumferential force analysis at the frame material reversal point
In order to study the easily damaged position of the tire frame in the longitudinal sliding process and find out the limit value of the force of each reinforcement layer. The maximum value of the rebar force in the circumferential direction of the fetal crown ply, the first belt ply and the first ply at different loads and speeds was analyzed. Draw the Slip rate-Vertical load-rebar force curve as shown in Figures 16–18. From Figure 16, it is found that the rebar force of the fetal crown layer increases as the load increases. At the same time, from the comparison of the three graphs in Figure 16(a)–(c), it is found that when the slip rate of the fetal crown layer is 0, the force on the cord is the smallest. The rebar force of the fetal crown layer near the slip rate of 10% and −10% will be much larger than other times. This is consistent with the slip rate corresponding to the extreme longitudinal force of the tire. This shows that there is a positive correlation between the rebar force on the fetal crown layer and the longitudinal force of the tire. When the speed increases from 40 km/h to 80 km/h, the value range of rebar force becomes larger, and the fluctuation becomes more severe. Slip rate-Vertical load-rebar force curves of the reverse envelope point of the fetal crown layer at different speeds. (a) 40 km/h. (b) 60 km/h. (c) 80 km/h. Slip rate-Vertical load-rebar force curves of the reverse envelope point of the belt layer at different speeds. (a) 40 km/h. (b) 60 km/h, (c) 80 km/h. Slip rate-Vertical load-rebar force curves of the reverse envelope point of the ply layer at different speeds. (a) 40 km/h. (b) 60 km/h. (c) 80 km/h.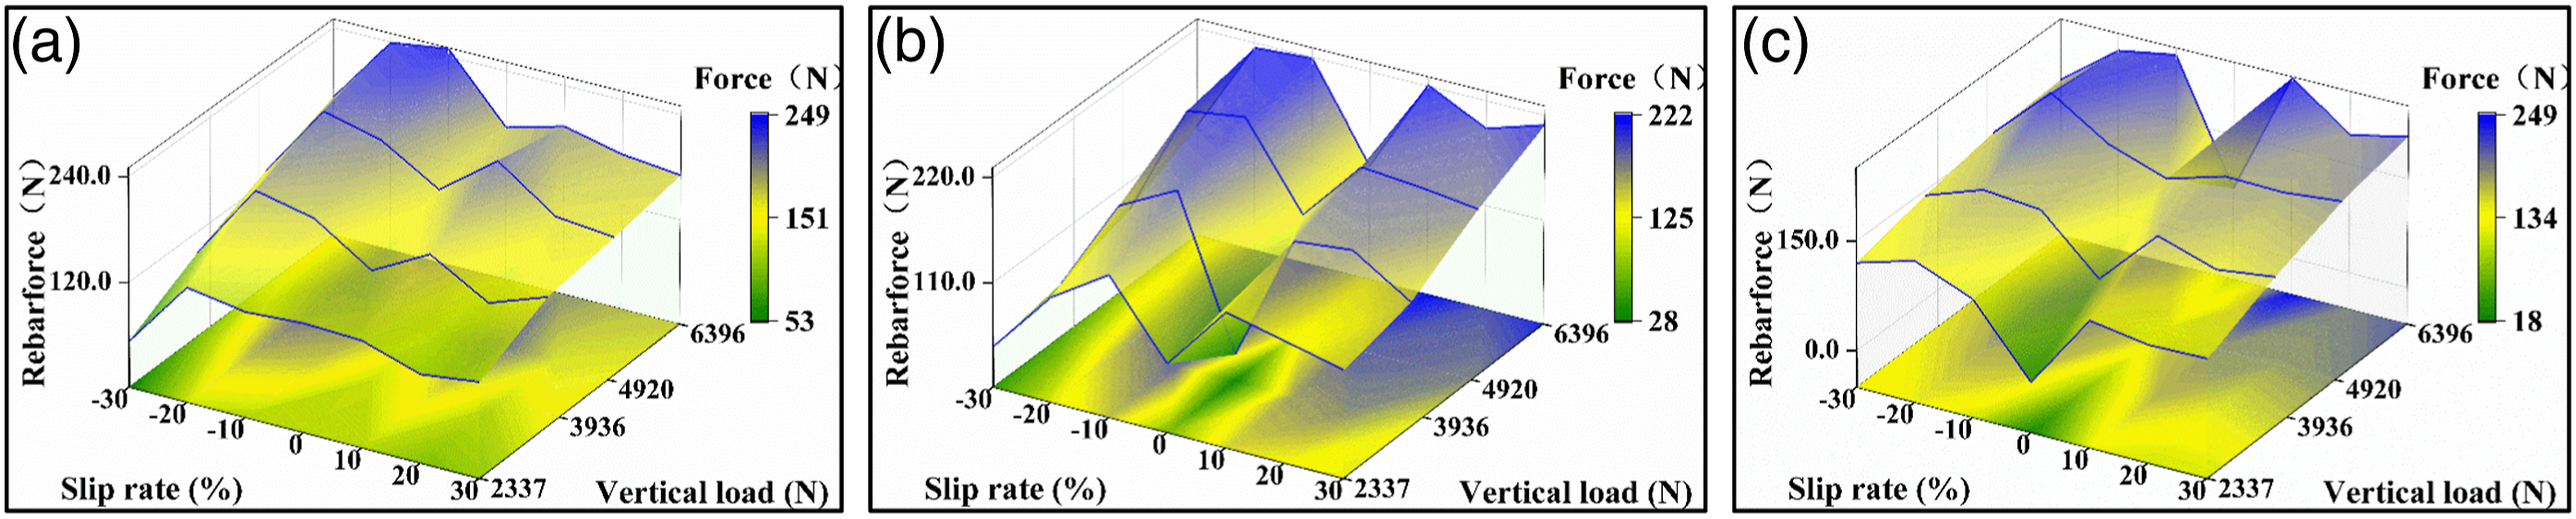

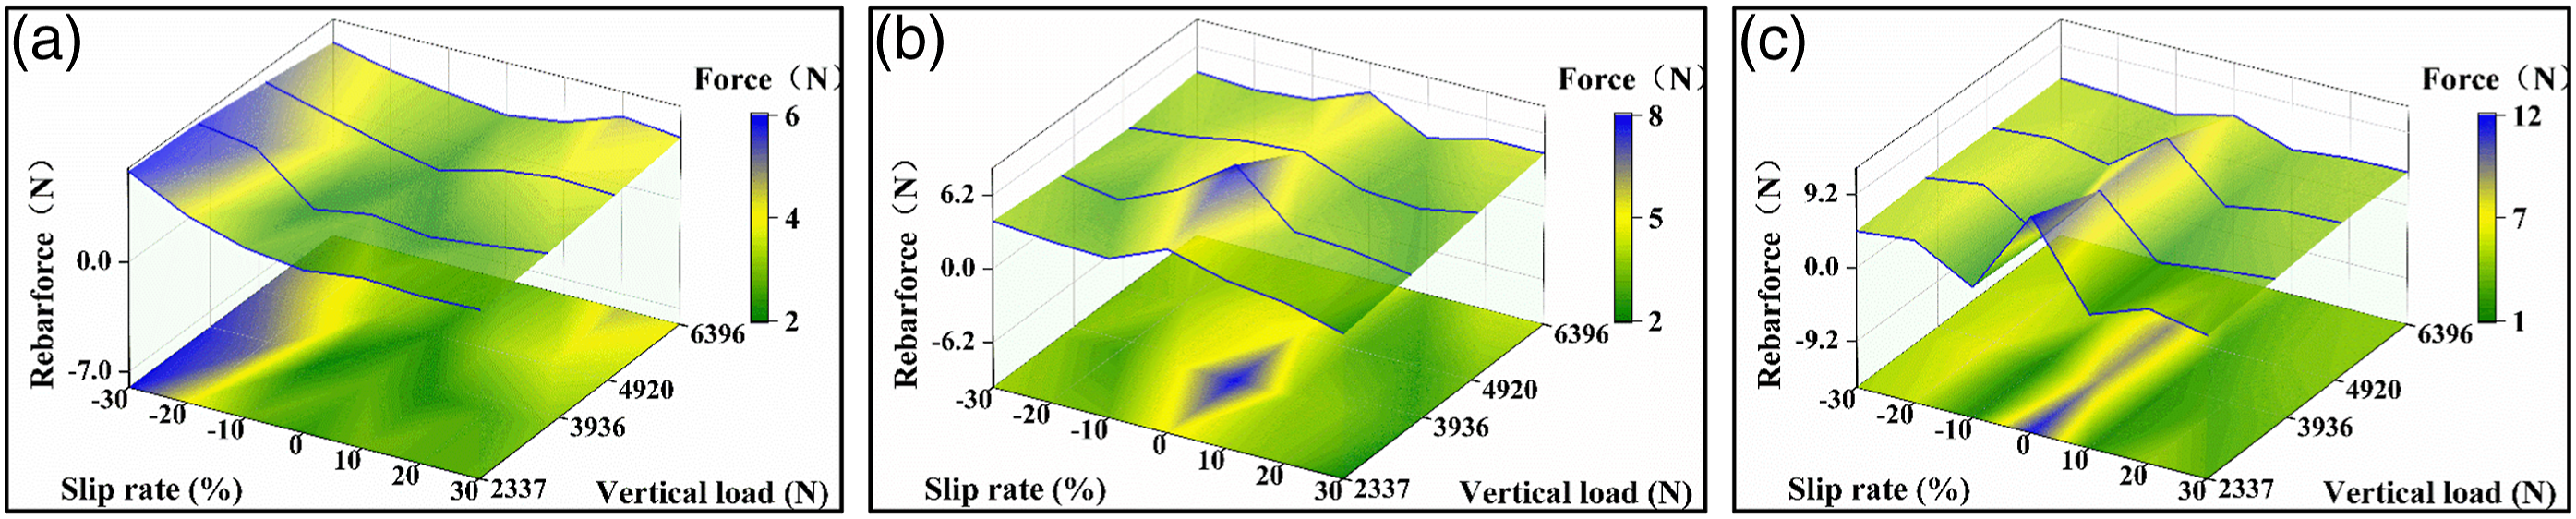
It can be seen from Figure 17 that the effect of slip ratio on belt rebar force is not too prominent. This is related to the arrangement angle of the cords of the belt layer, and a certain belt angle causes the rebar force to be dispersed along the circumference of the belt layer. From the stress gradient table in Figure 17(a)–(c), it is found that the maximum stress on the belt layer at 80 km/h is 49N, which is significantly larger than that at 40 km/h and 60 km/h. The maximum value and range of rebar force at 60 km/h are significantly smaller than those of the other two speeds. This shows that the tire pressure and loss caused by 60 km/h on the belt during the sliding process is the smallest.
The rebar force on the reverse wrapping point on the ply is shown in Figure 18. Analyzing Figure 18(a)–(c), it is found that as the speed increases, the maximum value of rebar force on the cord increases. Rebar force volatility has also become violent as the slip rate has changed. At 0 slippage, rebar force becomes maximum. As the load increases, the rebar force on the cord does not increase significantly, but reaches a maximum value near 2337 N.
By comparing Figures 16–18, the rebar force on the fetal crown ply is significantly larger than that of the belt ply and the ply. Rebar force also fluctuates more strongly with load and slip rate. The rebar force on the belt layer and the ply shows a decreasing trend in turn, which is related to the closer to the grounding position. With the change of velocity and slip rate, the rebar force on each skeleton layer shows a relatively strong vibration effect. Therefore, in the tire manufacturing process, the bonding strength of the turn-up point and the tire compound should be strengthened, especially the turn-up point of the fetal crown layer with a relatively large force.
Conclusions
This article firstly conducted material tests on tire rubber and skeleton materials such as cords, and determined the relevant parameters and mechanical properties of the constitutive model. Then used Abaqus software to establish a finite element model of the tire. In order to study the stress situation of fibers such as tire cords, the various skeleton layers were arranged according to a certain pattern and embedded into the interior of the tire using the * embedded command. This modeling method can intuitively observe the deformation and force of the cord fibers.
16
Subsequently, the feasibility of the model was verified through radial grounding experiments and simulations. The dynamic longitudinal slip test and simulation were conducted on the tire, and the feasibility of the model was once again verified through longitudinal force comparison with different slip rates. Finally, analyzed the internal skeleton cord structure of the tire model. The rebar force in the circumferential direction of the belt at different speeds was analyzed. And the circumferential rebar force extreme value on the fetal crown, belt and ply affected by load and slip rate at different speeds were analyzed. Through the analysis of these two angles, it is obvious to observe the stress situation of the cord fibers and to see the maximum stress concentration position. Conduct targeted enhancements to reduce the production cycle of tire fibers. This method adds sliding conditions such as braking and driving on the basis of Tian L and Sun P. It makes it more applicable. Through analysis, the following conclusions can be drawn: (1) The tire belt cord rebar force action area is consistent with the cord arrangement angle of 67° and there is asymmetry. The stress area of the belt layer is mainly concentrated in the vicinity of 180° in the circumferential direction and 35 mm and 140 mm in the axial direction. It is proved that the corner of the tire shoulder at the center of the ground contact will cause the concentration of the stress on the cord. With the increase of the speed, the belt cord stress will fluctuate obviously. The maximum stress did not change much and remained stable at around 46 N. Therefore, it indicates that the model can effectively reflect the stress situation of tire cords, and can provide reference for tire cord design. (2) The variation trend of the rebar force with the slip rate at the capping point is similar to the variation trend of the longitudinal force. When the slip ratio is 0, the stress on the cord is minimal. However, the maximum stress value occurs when the slip ratio is around −10% and 10%. Among them, the maximum stress values of 40 km/h and 80 km/h are larger, both of which are 249 N. The maximum stress value at 60 km/h is a minimum of 222 N. This indicates that the force acting on the cord at the enveloping point of the reverse coronal belt layer can reflect the sliding process to a certain extent, providing reference for the local reinforcement of the cord in the coronal belt layer. (3) The variation trend of the rebar force with the slip rate at the capping point is similar to the variation trend of the longitudinal force. When the slip ratio is 0, the stress on the cord is minimal. However, the maximum stress value occurs when the slip ratio is around −10% and 10%. Among them, the maximum stress values of 40 km/h and 80 km/h are larger, both of which are 249 N. The maximum stress value at 60 km/h is a minimum of 222 N. In order to better highlight the weak position of the belt cord during the sliding process, the analysis at 80 km/h is the best choice. (4) The fluctuation phenomenon of rebar force with slip rate at the reversal point of the ply layer is obviously more moderate than that of the fetal crown layer and the belt layer. The rebar force on the fetal crown and belt wrapping points increases with the increase of the load. The rebar force of the ply wrapping point is relatively gentle, but has an extreme value at 2337 N. It shows that the degree of damage to the ply is far less than that of the fetal crown layer and the belt layer. Therefore, when reinforcing tire cord fibers, priority should be given to the crown and belt layers.
Footnotes
Declaration of conflicting interests
The author(s) declared no potential conflicts of interest with respect to the research, authorship, and/or publication of this article.
Funding
The author(s) disclosed receipt of the following financial support for the research, authorship, and/or publication of this article: This work was supported by the Natural Science Foundation of Fujian Province (No. 2020J01276, No. 2023J011435) and Research Project of Xiamen University of Technology (No.YKJ22013 R, No. XPDKT20026). The Natural Science Foundation of Xiamen (No. 3502Z20227217)