
Abstract
Three different institutions combined their expertise in a joint R&D project to demonstrate the suitability of terahertz time-domain spectroscopy for thickness measurements of acrylate-based coatings on polyester fabric. First, we spectroscopically analyzed the materials involved using a high-precision terahertz spectrometer and determined optical properties such as the refractive index and loss coefficient. Raster scans were then performed across the sample, and terahertz images were created to identify material boundaries and thickness inhomogeneities. Finally, we applied a fast scanning terahertz time-domain spectrometer based on electronically controlled optical sampling and a customized reflection head for online thickness measurements in a coating line. The textile moved at a speed of 0.5 m/min, while the measurement system records terahertz pulses at a rate of 1600 traces/s. Coating thicknesses of between 63 µm and 99 µm were calculated in a post-processing step. To classify these non-contact and non-destructive measurements, these thicknesses were compared with the results of standard methods. Online and offline (62-83 µm) terahertz and SEM (66-75 µm) measurements delivered the best agreement for average coating thickness. In contrast, mechanical testing methods gave either too low or too high values for layer thickness, which were not comparable. Terahertz time-domain spectroscopy and imaging technology enable the first non-destructive quality control of acrylate-based textile coatings immediately following coating in the production line. Measurable variables are coating thicknesses and the detection of defects such as air inclusions.
Keywords
Introduction
Acrylic polymers are commonly used as a backing for upholstery fabrics and carpets, as an adhesive layer for laminates, and as a topcoat for tarpaulin due to their advantages in terms of clarity, high UV stability, extremely high resistance to water and various chemicals, and their good miscibility with polyvinyl chloride (PVC) and polyvinylidene chloride (PVDC). 1 The coating thickness is a relevant manufacturing parameter used to control the functionality of the layer and minimize the overall weight and material costs of the textiles. In a production line, the thickness of the applied coating is adjusted by changing the distance between the bottom of a coating knife and the top of the fabric (knife coating). However, measuring the thickness of textile coatings is a challenging matter because the material boundaries and, in particular, the interface between the fibers or filaments and the coating may not be well defined. Both the textile and the coating are flexible and compressible materials. In addition, the textile is well structured in the micrometer to submillimeter range, which allows the coating material to sink at least partially into the volume of the fabric. The current standards for testing coating thickness on textiles are offline and destructive techniques, as set forth in DIN EN 12127 2 and DIN EN ISO 5084. 3 According to the first of these two standards, the thickness of the coating is determined from the measured weight of a round and coated piece of fabric with an area of 100 cm2 and from the density values of the involved materials. The second standard describes the use of a constant-pressure thickness gauge, where the sample is clamped between a flat solid base and a contact point at constant pressure. Both techniques have their merits, such as ease of use and low instrumentation costs. The drawback, however, is that measurements need to be performed offline, they are destructive, and they require time-consuming sample preparation. Indirect online measurements are possible by determining the weight using X-ray instruments. However, X-ray techniques are subject to strict safety regulations to avoid hazards to humans during use. Thus, the industry currently lacks non-destructive and non-contact measurement techniques to determine the coating thickness directly on textiles, both inline and online.
In recent years, however, terahertz time-domain spectroscopy (THz-TDS) has reached a promising technology readiness level4,5 and has been shown to reliably measure layer thicknesses down to ∼10 µm. 6 THz-TDS systems generate and detect electromagnetic pulses of (sub-)picosecond duration, with each pulse comprising frequencies from about 100 GHz to several THz. 7 Similar to echo-location technology, THz pulses reflect at material boundaries. For coated textiles, the time-of-flight difference between the echoes reflected from the two air-coating and coating-textile interfaces is a measure of the thickness of the coating. THz-TDS can even resolve the thickness of multiple layers in a stack with sub-micrometer resolution. 8 It has long been known that many plastic materials are transparent to terahertz waves, 5 and hence, THz-TDS works well with optically opaque polymer materials. Due to their larger wavelength, THz waves are less sensitive to scattering than infrared waves. Furthermore, in contrast to eddy-current or ultra-sound techniques, no metallic substrate or contact medium is required. Textiles have already been the focus of previous THz studies. Their transmission properties have been of particular interest to remotely detect hazardous substances hidden behind clothing or to distinguish original fabric from counterfeit textiles. 9 In this paper, we present results of THz thickness gauging of acrylate-coated polyester knit fabric and compare them with results obtained using standard measurement techniques. To the best of our knowledge, these are the first non-destructive, non-contact, on- and inline THz measurements demonstrated to date for coated fabrics.
Sample properties
The investigated textile is a commercially available warp-knitted polyester fabric with an area weight of 123g/m2 (acc. to DIN EN 12127). Figure 1 (top) shows a cross-sectional image measured with a scanning electron microscopy (SEM), type TM1000 Tabletop Scanning Electron Microscope with Software Firm Vers.01-07-07, Hitachi Ltd., Tokyo, Japan, 2008. Multifilament yarns consist of about a hundred filaments with a diameter of ∼10 µm each. Through the process of knitting, the yarns form a fabric with a grid-like surface pattern, as seen in Figure 2(a) and (b). The periodicity of the grid pattern, i.e., the distance between stripe-like features, is 1.5 mm. Within the fabric, the diameter of each yarn is individually stretched or squeezed to a size of between ∼100 µm and ∼200 µm, leading to a waviness of the fabric’s surface in the same order. The thickness of the uncoated fabric, as measured with a pressure thickness gauge, is 290 µm. This value appears relatively constant across the fabric due to the limited lateral measurement resolution of this gauging instrument. Cross-sectional SEM image of the polyester fabric (top) and of the coated fabric (bottom). The image of the textile reveals an inhomogeneous thickness distribution of the coating and submillimeter surface waviness. Photographs of a 2 cm by 2 cm surface area of the investigated polyester textile. (a) Front side of the knitted fabric. The distance between the strip-like structures is 1.5 mm (b) The rear side of the knitted fabric. The “parallel” and “perpendicular” arrows denote the polarization of the THz beam relative to the fabric. (c) Fabric with an acrylate-based coating. The arrow indicates the direction in which the fabric moves through the coating line during production.

The coating material we use is an acrylate-based coating emulsion containing a binder, a crosslinker, and water as a solvent. The exact mixing ratio is not disclosed by the manufacturer. During the online coating process, the acrylate emulsion is applied to the textile using a knife. In a subsequent drying and fixing process, residual humidity is removed from the textile product, and the acrylic polymers are transformed into a non-water-soluble state.
Figure 1 (bottom) shows the SEM image, and Figure 2 (c) a top view photograph of the coated textile. Due to the structure of the textile, a fraction of the coating material is immersed deeply into the fabric, giving rise to both surface roughness and an inhomogeneous thickness distribution of the coating.
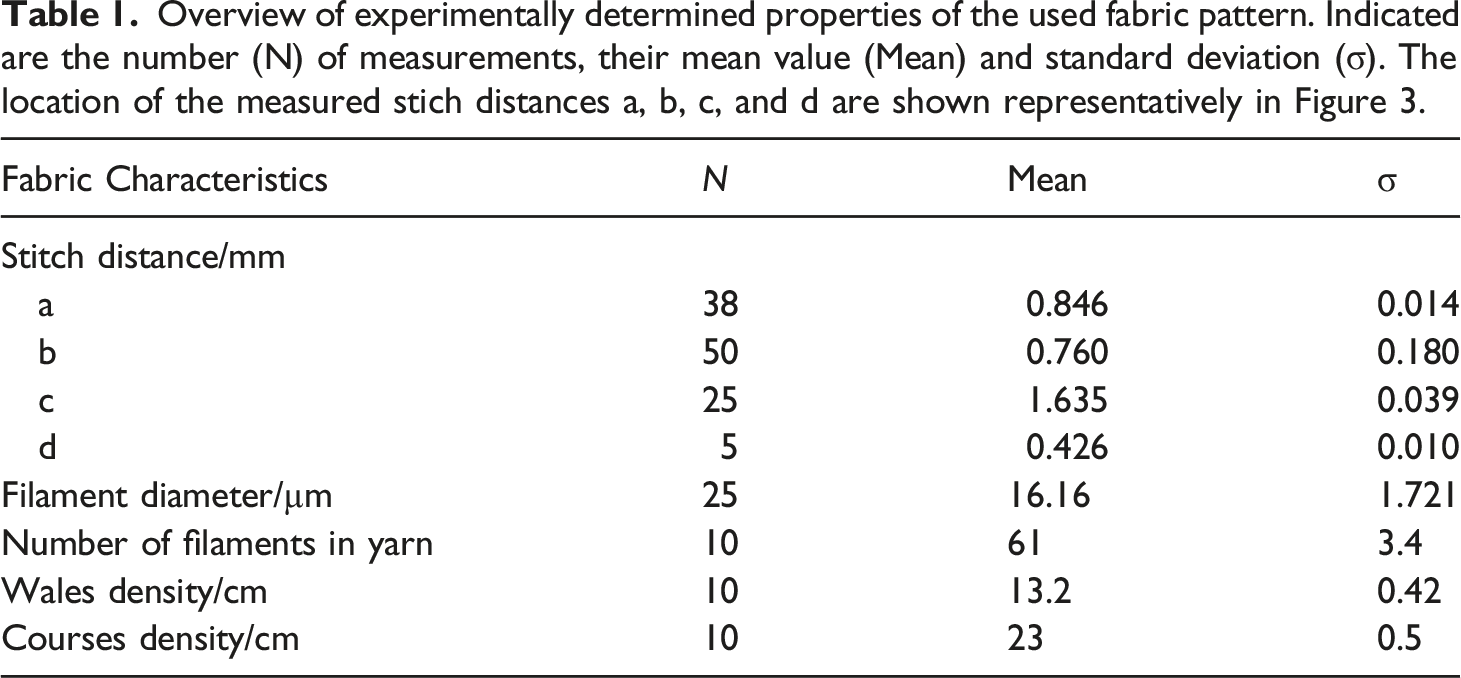
Details of the warp-knitted polyester fabric are revealed by the SEM micrographs of the front and back sides in Figure 3. The plotted markings of the different stitch spacings illustrate the different size scales. The corresponding measured numerical values are given in Table 1. SEM images of the fabric structure from front and rear side, with markings of different stitch distances (a, b, c and d), which are given in Table 1. Overview of experimentally determined properties of the used fabric pattern. Indicated are the number (N) of measurements, their mean value (Mean) and standard deviation (σ). The location of the measured stich distances a, b, c, and d are shown representatively in Figure 3.
Instrumentation
The samples are investigated offline and online using different THz-TDS systems and setups. For an initial offline spectroscopic analysis of the materials, we use a commercial table-top time-domain THz platform (TeraFlash pro, TOPTICA Photonics AG) as shown in the photograph in Figure 4 (a)).
10
Through advanced laser design and progress in photoconductive antennas, the system achieves a spectral peak dynamic range of 100 dB and a bandwidth of more than six THz averaged over 1000 terahertz pulses (see Figure 4 (b)).
7
Owing to a high-precision mechanical delay stage, the system acquires 60 traces/s @ 50 ps scan range, or 95 traces/s @ 20 ps. The system includes a pair of photoconductive antennas (emitter and receiver, respectively) and a set of four parabolic mirrors that guide the beam and create a focal spot with a diameter of about 1 mm at 1 THz at the sample position. Depending on the arrangement of the mirrors, the system enables THz imaging and spectroscopy in either transmission or reflection. (a) Table-top THz-TDS platform together with an “Imaging Extension” based on motorized linear stages that scan the sample through the THz beam, and (b) frequency spectrum of the THz signal showing a peak dynamic range (PDR) of >100 dB of the electric field amplitude and a spectral bandwidth (BW) of >6 THz.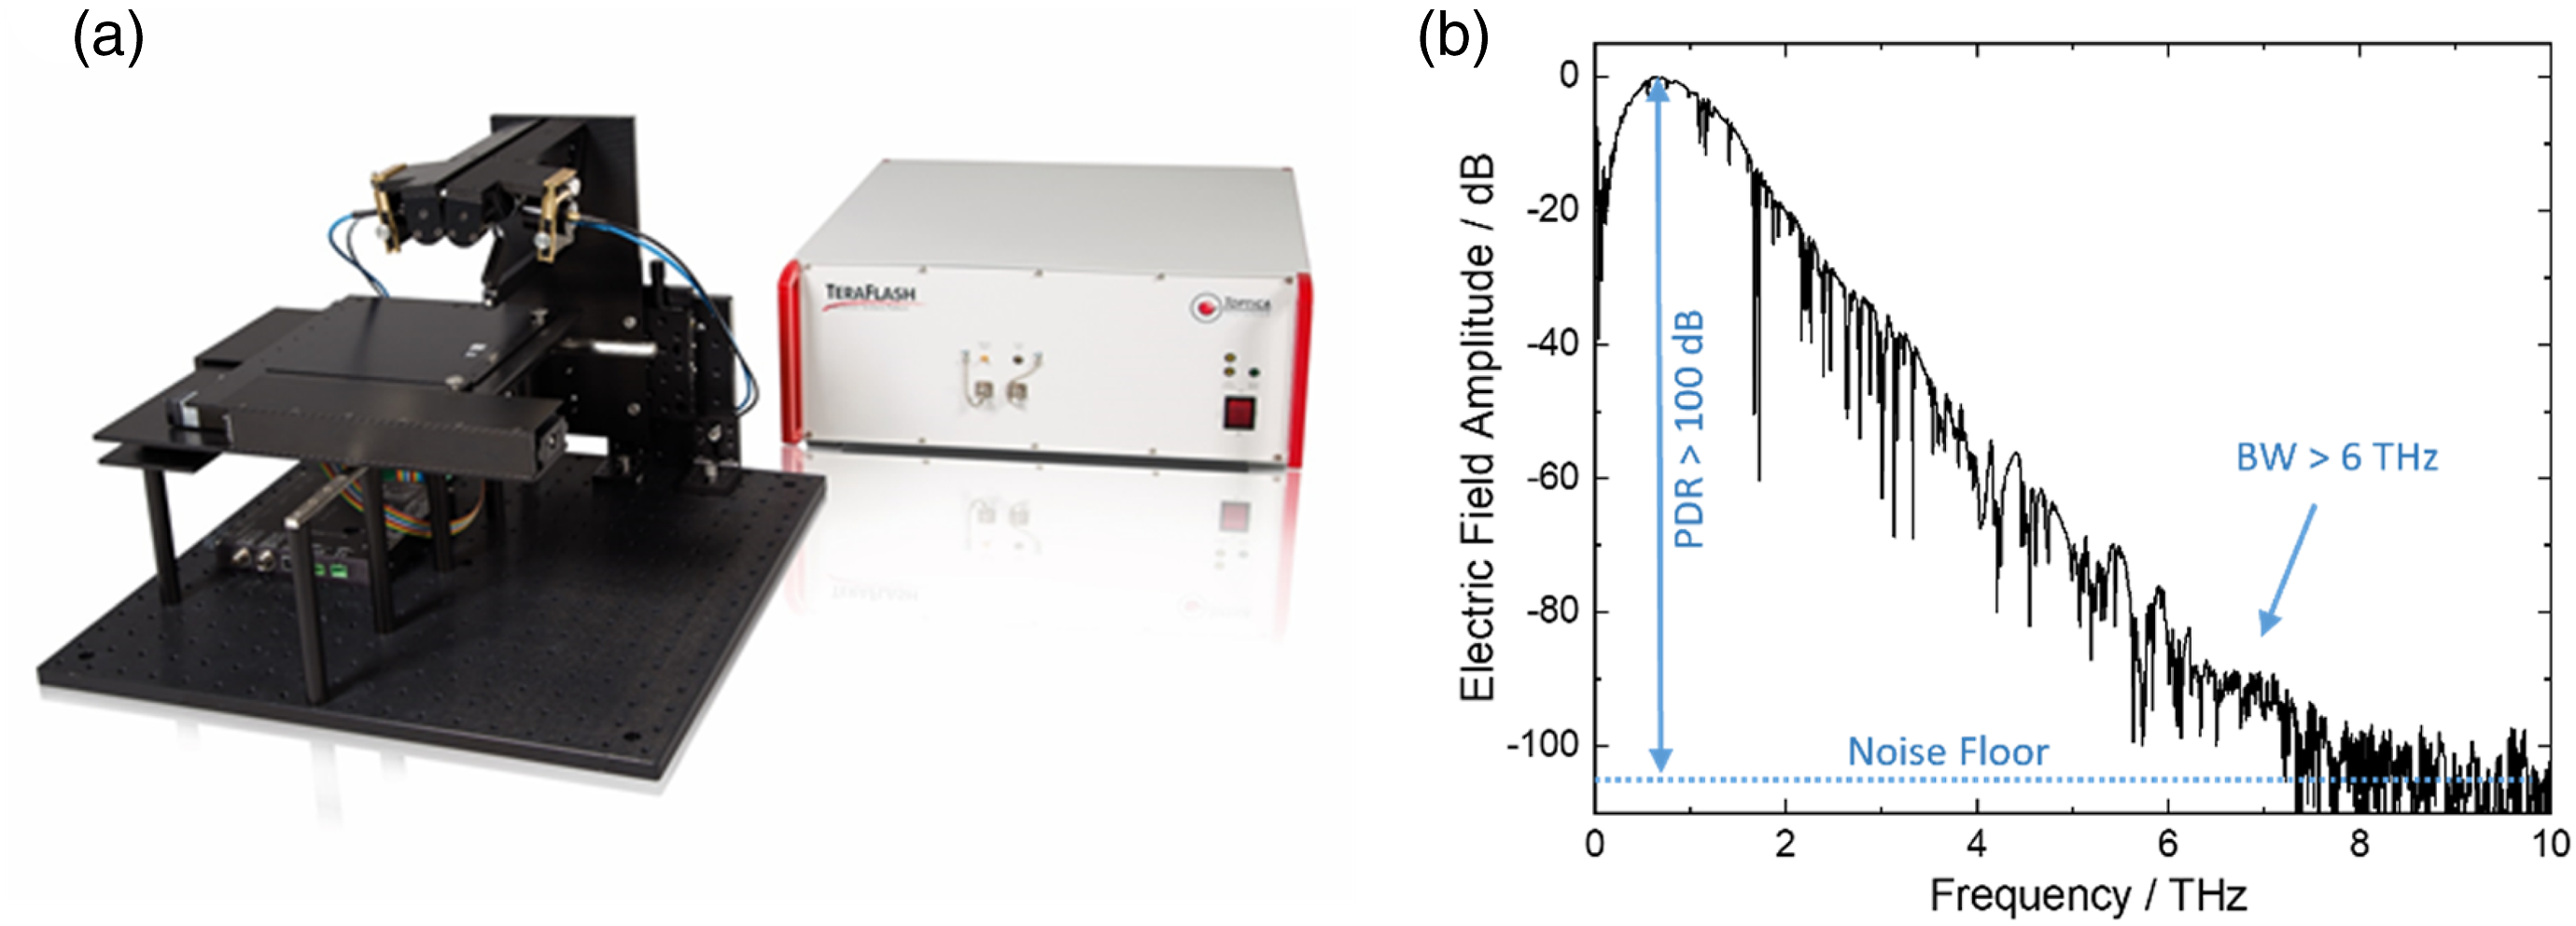
THz images were recorded at TOPTICA Photonics AG using the TeraFlash pro in combination with a dedicated optomechanical setup configured in reflection mode (see Figure 4 (a)). This “Imaging Extension” comprises two precise linear stages to scan a larger area of the textile sample through the focus of the THz beam. THz spectroscopic data was obtained in transmission mode using a setup with an automated sample positioner at the Physikalisch-Technische Bundesanstalt (PTB). The transmission setup, visible in the lower right corner of Figure 5, contains six off-axis parabolic mirrors to create a collimated beam at the sample holder position with a reduced beam waist of ∼5 mm. When placed in a collimated THz beam, even an optically thick sample only minimally changes the imaging of the THz beam onto the receiver. In this way, optical material parameters such as the refractive index and the absorption or loss coefficient of the sample can be determined precisely.
11
It is also important to minimize interfering water vapor absorption in the THz spectra. The spectrometer at PTB is therefore housed in an acrylic glass chamber that can be purged with dry air. Automated THz-TDS setup for transmission measurement in a focused beam (left) or in a collimated beam with reduced diameter (right) featuring the TeraFlash pro at Physikalisch-Technische Bundesanstalt. To reduce the amount of water vapor, both measurement chambers can be purged with dry air.
For online measurements, we employ a THz-TDS platform (TeraFlash smart, TOPTICA Photonics AG), which utilizes a proprietary scheme dubbed ECOPS (electronically controlled optical sampling).
12
The system shown in Figure 6 comprises two synchronized femtosecond lasers rather than just one, eliminating the need for a mechanical delay stage. This results in extremely high measurement rates: the TeraFlash smart acquires 1600 complete THz waveforms per second, enabling THz-based thickness gauging at unprecedented speed.
13
The system thus lends itself to measurements on rapidly moving samples, e.g., on conveyor belts, papermaking machines, or extrusion lines. Record speed time-domain terahertz platform (TeraFlash smart, TOPTICA Photonics AG). The system acquires 1600 complete THz waveforms per second and is ideally suited for an industrial setting.
Online measurements were performed at the Deutsche Institute für Textil-und Faserforschung (DITF) in Denkendorf. Figure 7 shows an industry-scale coating line at DITF together with a purpose-built THz reflection sensor head.
14
The fabric is guided through the line via steel rollers. The position of the sensor head is fixed and aligned such that the textile passes between a roller and the sensor. The roller thereby forms a fixed reference plane from which the THz pulse is reflected back into the sensor. The TeraFlash smart system is placed next to the coating line and connected to the sensor head via 10.5 m long umbilicals that transport the optical pulses and electric signals. Coating line with integrated THz reflection sensor at the DITF.
The customized sensor head is shown in Figure 8. It contains the THz emitter and receiver as well as four off-axis parabolic mirrors. The top cover is removed to allow adjustment of the emitter and receiver antennas. The arrangement ensures that the beam propagates from the emitter to the receiver in a single 2D plane, minimizing aberration effects and maintaining a linear polarization state of the THz radiation. All mirrors are two inches in diameter, with the first and last mirrors (M1 and M4 in Figure 8) and the second and third mirrors reflecting the beam at angles of 45 and 30°, respectively. This is advantageous compared to existing reflectance probes with 1-inch small 90° off-axis parabolic mirrors,
15
because imaging errors are more easily avoided and lower radiation losses are achieved due to the larger numerical aperture or smaller F-number. The mirrors create a focal spot with a diameter of about 3°mm at the sample position and an incident angle of 30°. Compared to normal incidence at 0°, an incident angle α results in a reduced optical path difference Δs of the reflected beams from the front and rear reflections of a layer of thickness d and refractive index n The compact THz reflection sensor head contains a THz emitter and receiver as well as four 2” off-axis parabolic mirrors, which guide the THz beam and create a ∼3 mm focal spot at the sample position. The beam path is marked by blue arrows, and descriptions M1 to M4 indicate the locations of the mirrors. The center of the cross on the white plastic material at the top of the image indicates the location of the reflection in front of the measuring head.

This equation is well known in optics for the interference of thin films,
16
here expressed by the angle of incidence α, which is related to the angle of propagation β within the layer by Snell’s law: 
In Figure 8, the direction of the THz beam is marked with blue arrows. The beam is linearly polarized, with the polarization oriented parallel to the production direction of the textile (see Figure 2). The black xy adjustment devices can be removed after an initial adjustment of the emitter and receiver positions. The housing of the reflection head has compact dimensions of approx. 130 x 90 x 340 mm3, as depicted in the photo in Figure 7.
Results
Offline spectroscopic measurements
Individual spectroscopic measurements of the involved materials are prerequisites to precisely determining the THz properties of the fabric and coating, such as the refractive index and the loss coefficient. The spectroscopic results first serve as input parameters for the algorithms used to extract the layer thickness from THz-TDS data. Secondly, they help us understand if thickness gauging by means of THz-TDS spectroscopy is possible at all. For example, the refractive indices of the coating and the textile need to have distinctly different values to produce a sufficient contrast between the two layers. For these initial offline measurements, 10 x 10 cm2 sized samples of uncoated polyester fabric and acrylate films were prepared. The acrylate was coated first on a transfer sheet made of Teflon with an automatic film applicator and then separated, dried, and fixed to create an individual film. Transmission measurements were taken with and without the sample placed in the collimated THz beam using the equipment depicted in Figure 5. In addition, measurements on the knitted fabric were taken for both parallel and perpendicular polarizations (see Figure 2(b)).
As an example, Figure 9 illustrates the raw data of a transmission measurement of the acrylate film, i.e., the time traces of the electric field strengths of both recorded THz pulses. The reference pulse of an empty measurement is shown in red and the sample pulse in blue. The temporal shift of the two pulses reveals information about the refractive index, while the decrease in amplitude tells us more about the absorption, i.e., the loss coefficient. In general, data measured in the time domain are converted to the frequency domain for evaluation by the mathematical procedure of a complex Fourier transform. The ratio of both real parts yields the transmission spectra of the sample, i.e., the acrylate film. The phase difference of the additionally obtained imaginary parts corresponds to the optical thickness, i.e., the refractive index times the thickness of the sample.
17
Raw measurement data of the acrylate-based film: the reference pulse (pulse with no sample in place) is shown in red while the sample pulse (with sample in place) is depicted in blue.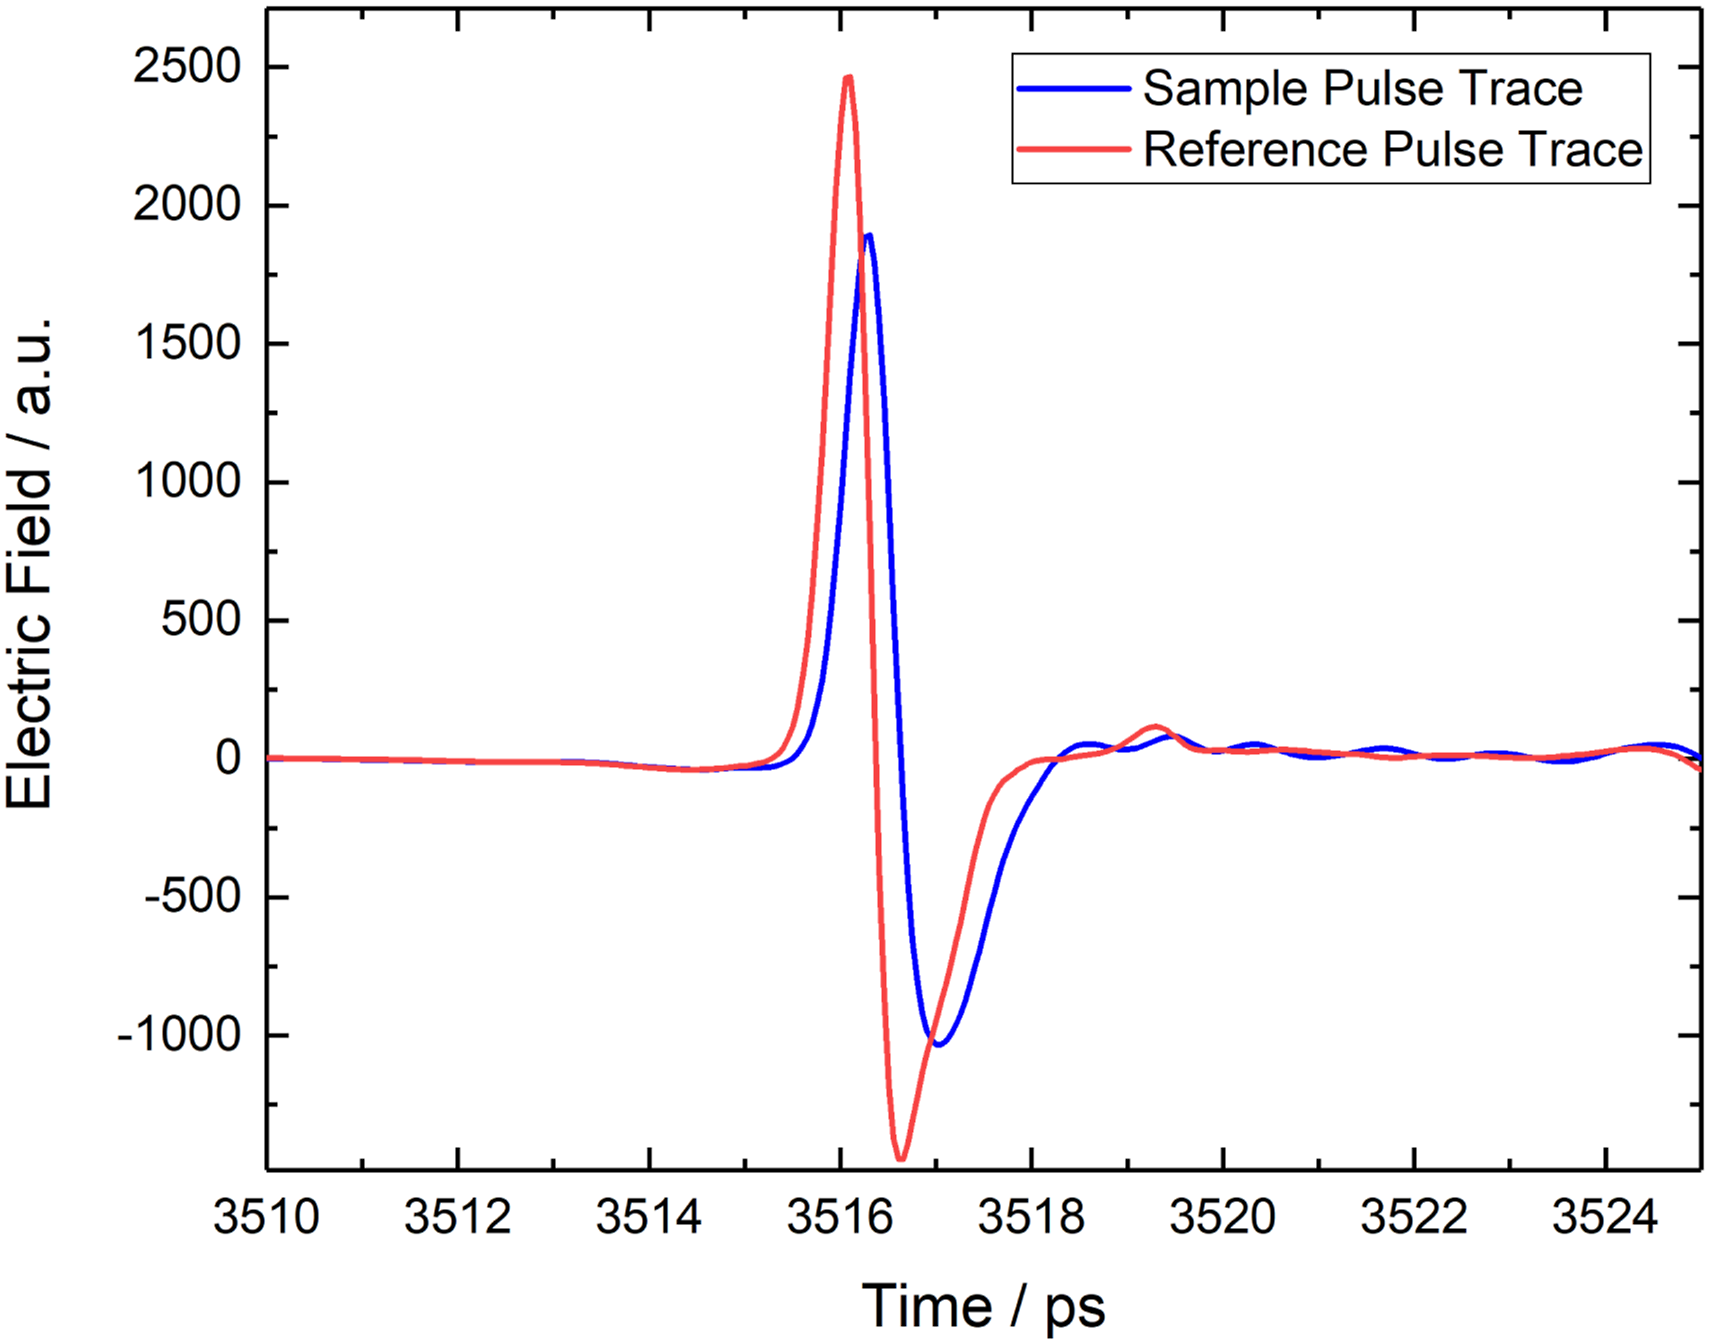
In our case, however, the frequency-dependent material parameters were derived directly from the raw data using the commercial software package Teralyzer (www.Lytera.com). 18 Here, the analysis of both the optical properties and the layer thickness is based on simplifications. The individual sample layers are treated as homogeneous, plane parallel slabs that are defined by an effective refractive index and a loss coefficient. As such, this spectroscopic analysis serves as a test of whether our samples, with their complex structure, can be represented with sufficient accuracy in this simplified model. The analysis routine of the commercial software was successful, and the quality-of-fit parameters indicate that the values determined for the refractive index and loss coefficient are reliable and reproducible for the samples.
Figure 10 (a) shows the results obtained for the frequency-dependent refractive indices, while Figure 10 (b) presents the loss coefficient results for the acrylate film and the uncoated polyester fabric. The refractive index of the acrylate film decreases with frequency, from approx. 1.67 at 0.5 THz to 1.55 at 3 THz. The loss coefficient, on the other hand, increases with frequency, from approx. 10 cm−1 at 0.5 THz to about 80 cm−1 at 2.5 THz. An in-depth interpretation of the data is difficult as the exact chemical composition of the acrylate coating was not disclosed by the manufacturer. The material parameters do, however, align with the values of typical polar polymers.
19
(a) Refractive-index spectra of the acrylate film (black solid line), and of the uncoated polyester fabric with parallel (gray dotted line) and perpendicular (gray solid line) polarization. (b) Loss coefficient versus frequency.
Polyesters generally exhibit a slowly decreasing THz refractive index and a monotonically increasing absorption coefficient without distinct features. 19 The corresponding curves for the polyester fabric, however, additionally feature several distinct signatures between ∼0.5 THz and ∼1 THz, which we attribute to the internal structure of the fabric. For example, a frequency of 1 THz corresponds to a wavelength of ∼300 µm in air, which is about the same order of magnitude as the knitted textile structure. Additionally, the refractive-index spectra of the polyester textile differ significantly for parallel and perpendicular polarization, deviating by 0.05 at 0.5 THz and 0.1 at 3.0 THz. This is attributed to shape birefringence, caused by the asymmetric structure of the knitted textile and must be considered in the layer thickness analysis. Because of the air volume within the fabric, the refractive indices of the polyester fabric for both polarizations are lower than those known for solid polyester. 19 Yet they still lie well between the values for solid polyester and air. Overall, our findings are in good agreement with previous studies, where scattering, diffraction and dichroic effects are attributed to the structure of the textiles. 5
In summary, the spectroscopic investigations yield reliable and reproducible results. The material parameters of all materials can be extracted from the measurements. Even the structured textile can be treated as a single-layer component. Furthermore, the difference in refractive indices between the coating and the textile is sufficient to generate separate echoes in the time trace and hence enable individual layer measurements, as we will show in the following sections.
Offline imaging
The next step was to perform raster-scan imaging of the acrylate-coated polyester fabric in reflection mode to prove the feasibility of thickness gauging of individual layers and to investigate the influence of the sample structure and the coating process. To better visualize the individual layers for this initial investigation, a relatively thick coating layer was applied to a piece of fabric on a laboratory coating table where the knife is moved manually. The result is a nearly 380 µm thick coating on the polyester fabric. The measurement setup used is the TeraFlash pro combined with the “Imaging Extension” (Figure 4 (a)). Here, the sample is moved across the THz beam in 0.2 mm steps to record an image with 50 by 50 pixels. A complete terahertz pulse trace is acquired for each pixel, enabling image processing in both the time and frequency domains with a dedicated analysis software (THz Map, TOPTICA Photonics).
Figure 11 shows a 2D plot of a 10 x 10 mm2 section of the coated fabric. This image was taken with the sample mounted on a metal plate that served as a reference mirror. For each pixel, only the amplitude of the THz pulse reflected from the mirror is displayed in false colors. After passing twice through the sample, the THz pulse amplitude image resembles, albeit with lower spatial resolution, the knitted structure as seen in the photograph of Figure 2 (a)). Blue and red shades, respectively, indicate areas of higher and lower losses where the measured THz pulse amplitude is approximately 15% lower or higher. These areas correspond to optically thicker and thinner parts of the textile sample. 2D scan of a 10x10 mm2 section of the acrylate-coated polyester fabric. The coating is approx. 400 µm thick. The THz image reveals the fabric structure with lower spatial resolution as seen through the coating.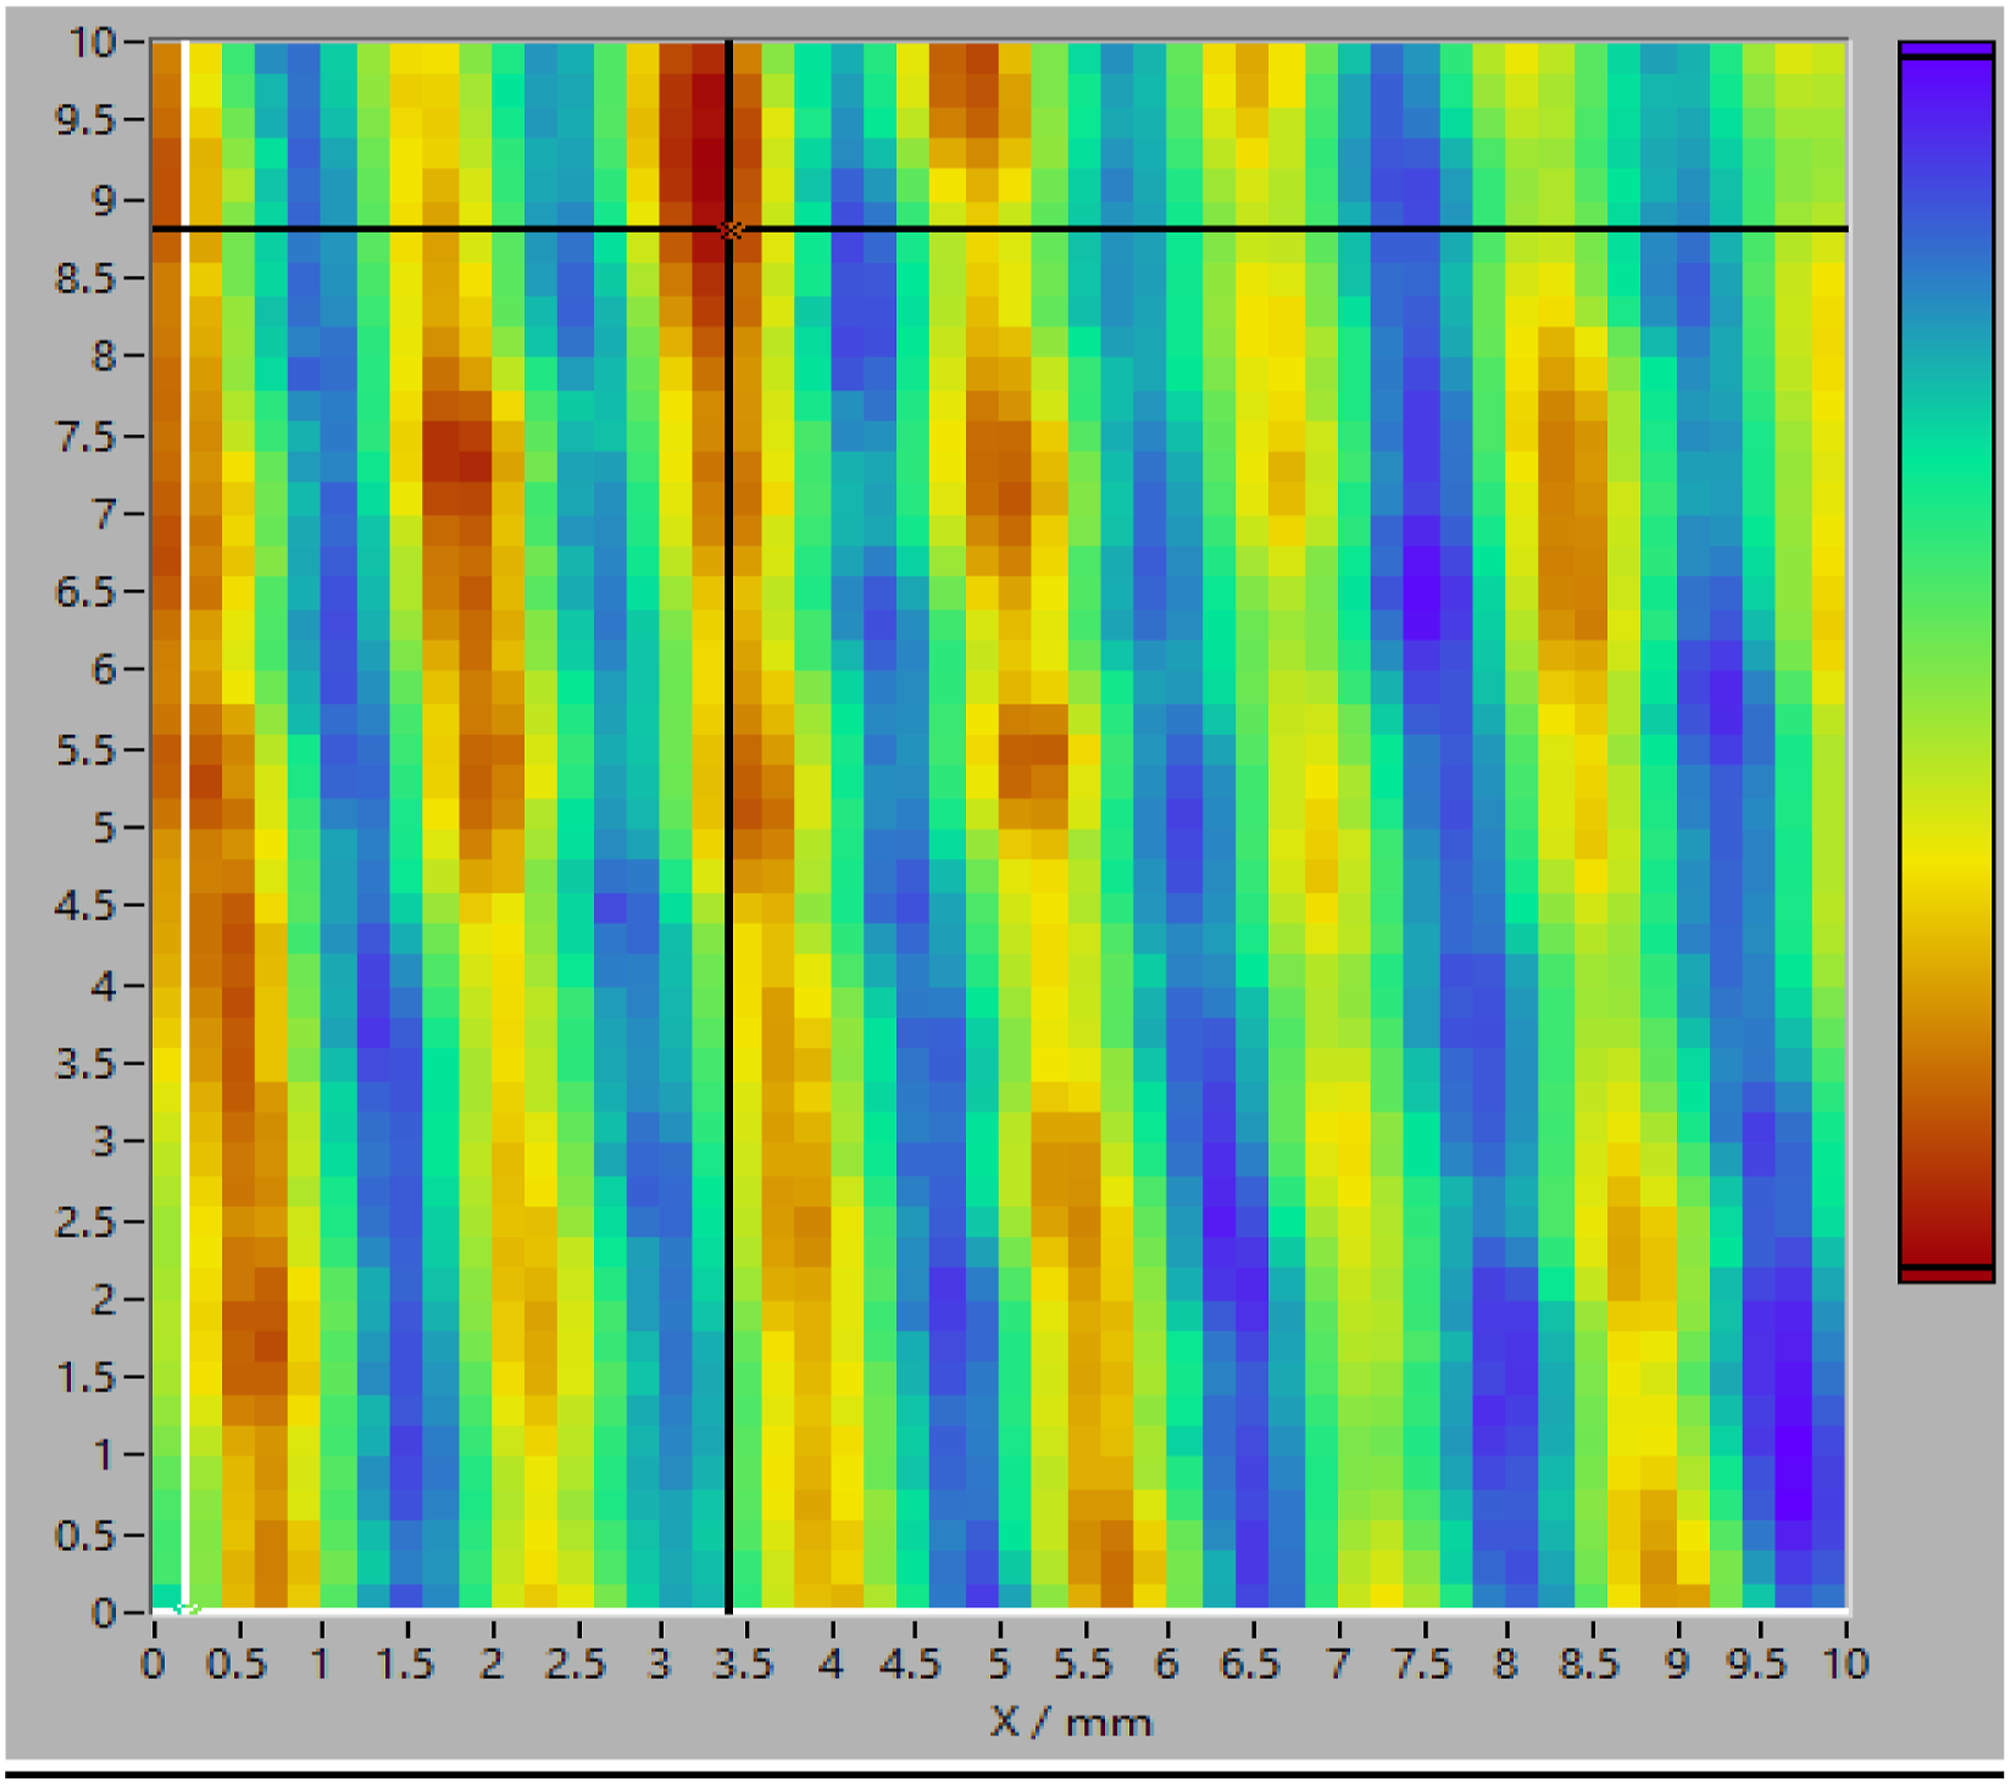
Figure 12 shows a cross section of the same sample now obtained from a measurement without a metal plate behind it. To allow visibility of the interfaces within the sample, we applied a simple deconvolution technique to each temporal pulse trace. Specifically, we transformed the pulse into the frequency domain, divided the spectra by a reference measurement from a metal plate, and transformed the results back into the time-domain. In this way, even weak reflections became visible as separate echoes in the time trace. In general, the echo from a textile-metal interface is significantly stronger than the echo from a textile-air interface. To better visualize the comparatively weak interface between the coating and the textile, the graph in Figure 12 was obtained from a line scan along the horizontal black line in Figure 11, this time with the sample free-floating, i.e., without a metal support. The deconvoluted time signal reveals three distinct features, shown in green in the false-color image, namely the top and bottom surfaces of the sample and the interface between the fabric and the coating. The dash-dotted black lines serve as a guide for the eye. The time of flight of the echoes depends on both the refractive index and the thickness of each layer. In this case, both the thickness and the refractive index of the acrylate coating layer were larger than those of the textile. This is why in Figure 12 the distance between the top and middle interfaces is approximately twice as large as the distance between the middle and the bottom interface. Horizontal scan along a 10 mm cross section of the sample indicated by the black line in Figure 11. This measurement was taken with the sample free floating. The color scale refers to the amplitude in arbitrary units of the deconvolved THz signals. The green features correspond to the top and bottom surfaces of the sample and to the interface between the textile and its underlying coating. The vertical time axis indicates several ps difference of the time of flight of echoes from top, middle, and bottom interfaces.
To precisely determine the layer thickness, we selected individual pixels from seven different but adjacent positions of the 2D scan with the metal plate as a reference mirror (Figure 11) and compared the measured data to simulated THz time traces. The underlying algorithm assumes two homogeneous, plane-parallel layers, each with a given refractive index and loss coefficient. Our software models the reflected and several ps-long signal from the two-layer sample of coating and fabric. To do so, the software uses an additional measurement from a reference surface and applies a transfer matrix approach. 20 The layers’ thickness parameters are varied until the simulated pulses match the measured traces as closely as possible.
As an example, Figure 13 shows one of the measured pulses together with a simulated pulse for perpendicular polarization (see Figure 2(b)) of the THz beam. For simplicity, we use frequency-independent but complex values of the refractive indices, namely Simulated and measured THz pulse. The fit algorithm yields stable and reproducible results for the coating and the textile thickness. The numbers 1 to 3 indicate the temporal position of the interfaces, where 1 corresponds to the transition from air to coating and 2 from coating to textile. The second large peak (3) comes from the reflection of the underlying metal plate. Thicknesses of the acrylate coating and the textile at seven adjacent positions of the sample as determined from THz-TDS measurements.

Online thickness measurements
Online measurements were performed in a coating line as described in the Instrumentation section (see Figure 7) to demonstrate the validity of the measurement method in an industrial environment. The THz pulse traces were measured directly after the drying and fixing process. During the production run, the distance from the coating knife to the textile varied successively from 0.03 mm to 0.04 mm, 0.06 mm and finally 0.08 mm. Since the textile was open-pored, the coating compound was pressed through the textile during application, and a small amount even settled on a guide roller between the coating unit and the dryer. Contrary to expectations, this effect led to coating thicknesses without correlation to the distance between the coating knife and the textile.
Thicknesses of coating and textile determined from online and offline THz-TDS measurements. The results of the four measured samples B3, B4, B6 and B8 are given as mean (Mean) and standard deviation (σ) in µm.
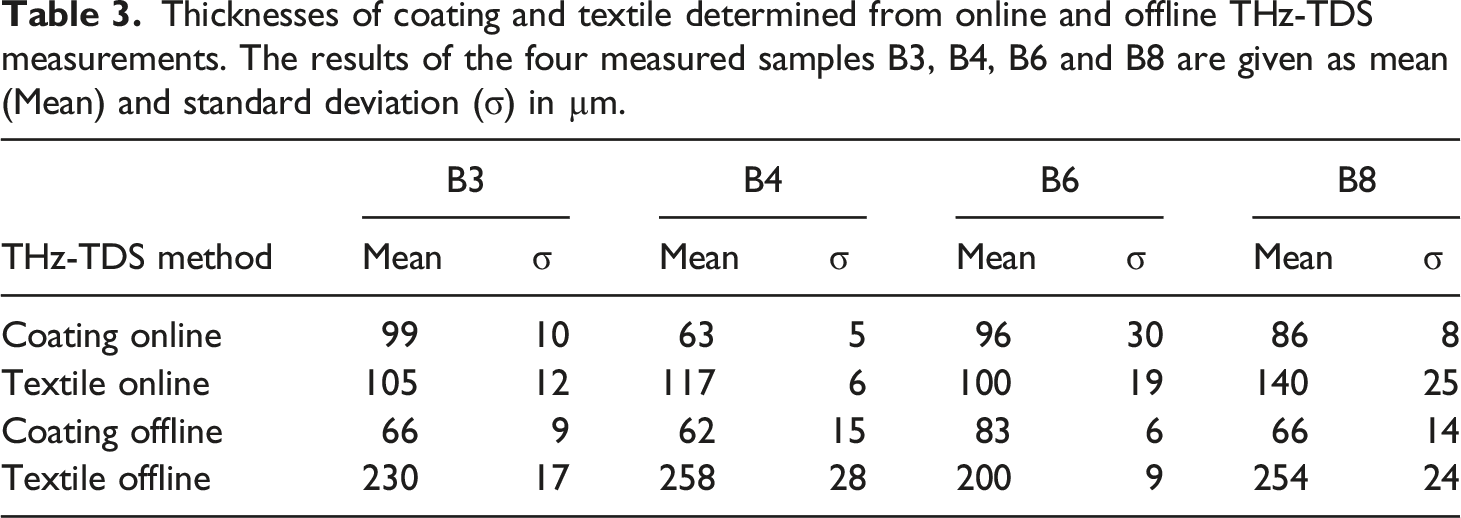
The sections on the fabric sheet are named B3 (30 µm), B4 (40 µm), B6 (60 µm) and B8 (80 µm) according to the different knife-textile distances. The coating thicknesses were determined to be between 63 µm and 99 µm. The standard deviations range between 5 µm and 30 µm and are a measure of the variability of the thickness at different measuring points of the moving sample. It is further of note that the textile thickness was determined to be 116 µm on average, half that of the previous offline measurement (see Table 2). This result is attributed to the fact that at the measurement position, the coated textile was pushed against a metal winding roller. While the thickness of the coating remains unaffected, the textile was compressed because the air within the fabric was pushed out.
To check the results of the online measurement, the same fabric sheet was measured offline using the setup described in section 4.2. From each section of the fabric sheet, we cut out representative round samples with a diameter of approx. 10 cm. We carried out 20 measurements for each of the four samples (B3, B4, B6 and B8). As an example, Figure 14 shows one measured pulse trace from sample B3 together with a fitted simulation. For the fit, we assume a three-layer sample consisting of the coating, the textile, and an intermediate layer of an air-textile mixture between the textile and the metallic sample holder with corresponding refractive indices Normalized measured pulse trace (black) and fitted simulation (red). The first peak corresponds to the reflection at the surface of the sample and the large peak to the reflection at the metallic reference plane underneath the sample. The numbers indicate the temporal position of the reflection at the four interfaces, as described in the text above.
Due to the only punctual contact of the wavy textile with its flat metal base and the areas close contact with an air layer in between (cf. Figure 1), an intermediate layer is required for a successful fitting of the data (Figure 4). Indeed, the measurement is an area-wide integration that yields an average distance represented by this intermediate layer. This illustrates another advantage of the THz measurement technique: In the same way, air bubbles between coating and textile can be detected, i.e., corresponding coating defects can be localized.
For each sample, we determined the mean thickness and the standard deviation, as shown in Table 3. As expected, the offline measurements yielded larger values for the textile thickness compared to the online values, but similar values compared to the previous offline values in Table 2. The difference in textile thickness between offline and online measurements is attributed to the pressure from the winding roller to which the textile is exposed during the online measurement. The determined coating thicknesses range between 62 µm and 83 µm. Within the confidence interval, these values are comparable with the previous online measurements, except for sample B3, where a larger value is observed for the online measurement. We attribute this deviation to the fact that, on the one hand, there are strong local variations of thickness on each sample and, on the other, measurements were taken at different positions on the sample. Hence, online and offline measurements are not directly comparable. The local thickness variations of the coating also manifest themselves in varying standard deviations ranging from 9 µm to 15 µm.
Thicknesses of the textile and its coatings as determined with different measuring methods. The mean value (Mean) and the standard deviation (s) in µm are listed.
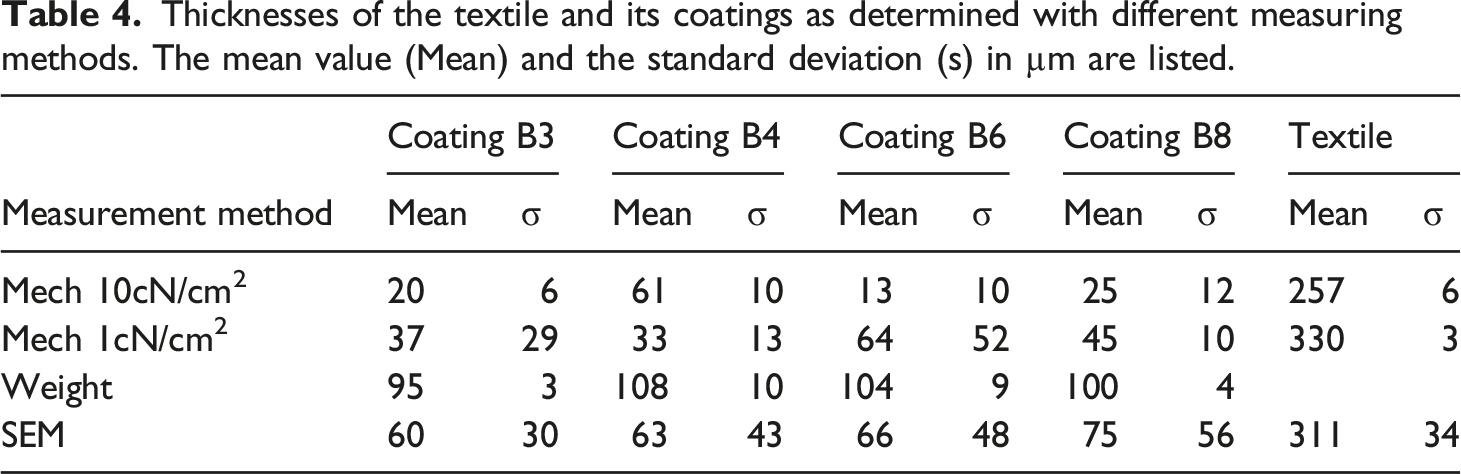
Furthermore, the mean thicknesses and standard deviations of the coating material for all samples were deduced using the area-weight method according to DIN EN 12127. The results are presented in Table 4. The coating thickness is determined using the known density of the coating material together with the area weight of the coating, with the latter calculated by subtracting the measured area weight of the pure textile from the measured area weight of the coated textile.
Finally, high-resolution thickness measurements for all layers were performed using SEM imaging (see Figure 1) of cross sections of the fabric. Thickness readings from thinner and thicker parts were averaged to determine the mean thickness and the standard deviation. The results are summarized in Table 4.
A comparison of the various techniques in Table 4 reveals significant differences across all samples in both the mean thickness and standard deviation values and underlines the difficulties of thickness measurements on direct-coated warp-knitted textiles. One explanation is that thickness readings from the online THz and the offline techniques stem from different sample positions, and a direct comparison is problematic because of the elastic and compressible nature of the warp-knitted textile sample. Furthermore, the thickness varies across the lateral dimensions of the sample. Inhomogeneities appear both on the scale of the knitted textile structure (100 µm - 1 mm, cf. Figure 1) and on the order of several centimeters to meters due to imperfections in the coating process.
The constant-pressure thickness gauge yields thickness values of the coatings (Mech in Table 4) that are smaller by a factor of three to four than the values obtained with all other methods. This can be attributed to the compressibility of the coating compound and the textile. The even smaller values at higher pressure settings (10 cN/cm2) on the same sample support this approach. In contrast, the area-weight method yields the largest thickness values (Weight in Table 4). Here, the total weight of the applied coating mass, including the material absorbed by the fibers and sunken into the fabric or into the fiber interstices, is considered and incorrectly regarded as the thickness of the coating layer on the fabric surface. The problem presented by these established measurement methods supports the need for a new measurement technique that can eliminate these measurement errors. The coating thickness values obtained from SEM and THz measurements lie between the measurements yielded by the mechanical techniques. However, the SEM method reveals large thickness variations across the sample, which leads to standard deviations of between 30 and 56 µm. This is due, on the one hand, to the micrometer-precise spatial resolution and, on the other hand, to the thick and thin spots at the selected measuring point on the textile, depending on whether measurements are taken on a wale (stitch column) or between two wales. In contrast, the THz thickness readings represent mean values for a surface area on the order of the spot size of the THz beam (>3 mm) and thus show smaller thickness fluctuations with standard deviations between 5 µm and 30 µm.
Considering all these aspects, the flexible and structured nature of the coated textile significantly complicates the definition of the “thickness” and its measurement. Variations on the order of at least 10 µm are hence to be expected for all techniques. While the mechanical test methods yield coating thickness values that are either too low or too high, it is noteworthy that the best agreement for mean thickness is found in the results from offline and online THz and SEM measurements. However, its capability for non-destructive, non-contact, and online measurement and for detecting intermediate air layers renders the THz technique superior.
Conclusion
In this work, we successfully performed the first online THz reflection measurements on acrylate-based coatings in an industrial textile coating line. These measurements could be done at a rate of 1600 traces/s to determine the thickness of coatings applied to polyester warp knitted textiles. Although the coatings were predominantly characterized by inhomogeneity, it was possible to determine the coating thickness with an average standard deviation of just 10 µm. The materials were first investigated offline using THz time-domain spectroscopy and imaging. Despite the structured form of the coated textiles, the material boundaries of the coatings were clearly identified, rendering THz-TDS suitable for the non-destructive quality control of coated fabrics. Secondly, the non-contact measurements were taken inline immediately following the coating process, i.e., on a deflection roller before the final winding of the coated textile. The results were compared to THz offline measurements and to standard destructive techniques. This demonstrated the suitability of THz-TDS for determining layer thickness of acrylate-based coatings on textiles. Future work will focus on the improvement of the layer thickness calculation using speed-optimized algorithms and faster computer hardware. Additionally, the method's ability to simultaneously detect air bubbles in textile will be examined.
Footnotes
Acknowledgments
The authors acknowledge funding from the German Federal Ministry for Economic Affairs and Climate Action (BMWK). The results shown in this paper were obtained in the scope of project TeraMeTex: Terahertz-Messsystem für Textilbeschichtungen within the ZIM funding program. “ZIM” stands for “Zentrales Innovationsprogramm Mittelstand”, which means “Central Innovation Program for small and medium-sized enterprises (SMEs)”. The authors thank B. Röben and R. Dunham at PTB for their careful proofreading of the manuscript.
Declaration of conflicting interests
The author(s) declared no potential conflicts of interest with respect to the research, authorship, and/or publication of this article.
Funding
The author(s) disclosed receipt of the following financial support for the research, authorship, and/or publication of this article: This work was supported by the German Ministry for Economic Affairs and Climate Action (ZF4232903AB8) and German Federal Ministry for Economic Affaires and Climate Action (ZF4104113AB8).