
Abstract
Transverse compression-induced cross-sectional deformation of parallel fiber bundles usually acts as the fundamental structural mechanism for bundle-based materials. In the present article, a meso-scale insight into the cross-sectional responses of parallel fiber bundle under transverse compression was made. A novel algorithm was proposed to design and model the bundle cross-sectional meso-structure with randomly distributed fibers. The transverse compression induced bundle cross-sectional responses (including cross-sectional perimeter, area and filling factor) were simulated and analyzed based on the finite element method, and were verified experimentally for the bundle with 91 fibers. Results showed that the load began to increase significantly when the perimeter growth rate of the bundle cross-section was larger than 0.8, and the load gradually reached the peak value when the perimeter growth rate was about 1.5. The Mises stress distribution of the bundle gradually neared to the Gaussian distribution when load sharply increased. The results presented in the current paper can provide a novel method to generate randomly distributed fibers and a theoretical guidance for the mechanical properties prediction of bundle-based materials by analyzing the bundle cross-sectional deformation in transverse compression.
Keywords
Introduction
Due to the high flexibility and deformability, fiber/yarn-based materials have attracted enormous attentions.1–3 Although staple yarns and filament yarns are the main yarn forms in yarn-based materials, 4 filament yarns with great continuity and stability5,6 are more popular and have been widely used in various fields. Parallel fiber bundles which are composed of long fibers (filaments) have been applied in rope, 7 composites,8,9 flexible sensors,10–12 etc. During the preparation and use of bundle-based materials in various applied situations, a common and typical type of load applied to the bundle is the transverse compression, which leads to the bundle cross-sectional deformation directly. The cross-sectional deformation of the bundle in transverse compression has important influence on the structural, mechanical and functional responses and performances of bundle-based materials, 13 which even results in the final failure.
Establishing fiber bundle model is an effective method to study bundle cross-sectional performances in transverse compression. Although circular, 14 octagon, 15 hexagon, 16 etc. have been assumed as the cross-sectional shape of yarns, the fixed geometry could not reflect the cross-sectional responses. Researches showed that the cross-sectional shape of yarns has varied.17–19 Building the yarn model with deformable cross-section is necessary. Yarn models established on the basis of experiments were only suitable for the specific structure and limited situation.20–22 A yarn micro-compaction model was established in woven fabric 23 when the fiber volume fraction was assumed to be higher in the central region of the cross-section. It showed that the bundle cross-sectional parameters in transverse compression can be used to characterize the mechanical performances of the bundle and woven fabric. To investigate the transverse compression mechanisms in meso-scale, the synchrotron X-ray micro-computed tomography (CT) has been used to in-situ observe the cross-sectional deformation caused by the variation of fibers distribution in the fiber bundle cross-section.24,25 The bundle cross-sectional parameters which include cross-sectional area, perimeter, filling factor, etc. can be calculated on the basis of the fibers distribution within the bundle cross-section. Although the bundle model with closely distributed fibers has been established to study transverse compressive strains of Kevlar KM2 fibers,26,27 the scanning electron microscope (SEM) images 28 indicated that fibers were stochastically distributed in the bundle cross-section. The comparison between the randomly distributed fibers and the ideal hexagonal periodic arrangement showed that the microstructure of fibers distribution has a great effect on the properties of fiber reinforced composites.29,30 Thus, it is necessary to build fiber bundle model with randomly distributed fibers to intensively investigate bundle cross-sectional responses in transverse compression.
Many researches for generating randomly distributed fibers have been conducted based on proposed algorithms. Overlapped fibers were not allowed when randomly distributed fibers were sequentially generated,31–34 which resulted in the poor space utilization and the limitation of attainable fiber volume fraction. To overcome the limitation on fiber volume fraction, overlapped random fibers were allowed to satisfy the required volume fraction, and then fibers were rearranged to realize the non-overlap pattern,35,36 whereas the computational time was much longer. Another algorithm was to randomly remove fibers from the packed distributed fibers until it reached the aimed volume fraction, and then sequential random perturbation process was conducted to realize fibers random distribution. 37 Nevertheless, the randomly removed fibers might cause large blank area in the cross-section. Therefore, fiber volume fraction and pore distribution in the bundle cross-section should be both considered while designing algorithms to establish fiber bundle model with randomly distributed fibers.
In the current work, a novel algorithm was proposed to generate randomly distributed fibers within the parallel fiber bundle. Based on the established randomly distributed fiber bundle model, the bundle cross-sectional responses in transverse compression was analyzed in simulation and verified by experiments. Moreover, the variation of Mises distribution of the bundle cross-section in transverse compression was discussed. The new algorithm proposed in the current paper provides a new method to generate randomly distributed fibers. The investigation of the relationship between bundle cross-sectional parameters and mechanical responses in transverse compression can provide a guidance for the mechanical properties prediction based on the bundle cross-sectional deformation.
Algorithm to generate randomly distributed fibers within the bundle
To simulate fibers random distribution within a bundle, a novel algorithm was developed using C++. The cross-section of the bundle was assumed as circular in initial state (Figure 1(a)), and single fibers in the bundle had a circular and constant cross-section. Fibers distribution within the bundle: (a) close distribution, (b) diffuse distribution, and (c) random distribution.
The process to generate randomly distributed fibers in the bundle was conducted by three steps, as shown in Figure 1. (1) Initially, a specific number of fibers were distributed closely within the bundle (Figure 1(a)) on the basis of the open packing theory proposed by Schwarz, which could reach its maximum fiber volume fraction. (2) Next, to realize a target fiber filling factor
The filling factor

The cross-sectional area of the bundle after out-diffusion in Figure 1(b) can be further expressed as

Hence, the diffuse distance (3) Finally, the randomly distributed fibers (Figure 1(c)) were generated, according to the detailed procedures in the following algorithm (Figure 2): (i) The coordinates of each fiber gotten from the diffuse distribution (Figure 1(b)) were input, and the distance (ii) Movement parameters (iii) An array of the distance (iv) The above processes (i) ∼ (iii) for all fibers were repeated from (v) For the purpose to calculate the bundle cross-sectional area and control its filling factor, it is necessary to identify the contour fibers within the bundle. As shown in Figure 3, local coordinate system was established where the objective fiber (vi) On account of the identified contour fibers, the cross-sectional area of the bundle was divided into three parts (Figure 4): the interior triangle area, the contour rectangular area and the contour sectorial area. The bundle cross-sectional area can be calculated as: (vii) Considering the computer hardware and computation time, the variation of filling factor was constrained with a fluctuation factor Flowchart of the algorithm to generate randomly distributed fibers. The difference between the contour fiber and the interior fiber: (a) fiber A is a contour fiber, and (b) fiber B is an interior fiber. Area partitions of the bundle cross-section: (a) the interior triangle area, (b) the contour rectangular area, and (c) the contour sectorial area.


Eventually, the randomly distributed fibers within the bundle were generated.
Methods
Finite element modelling
The coordinates of randomly distributed fibers obtained in Algorithm to Generate Randomly Distributed Fibers Within the Bundle section were input into Catia® to build the fiber bundle model (Figure 5(a)), with a filling factor of 0.65 and fiber number of 91. As shown in Figure 5(b), glass fibers in the specimen were parallel without twist, which indicated that the bundle model was consistent with the sample. The bundle model (a), and the specimen (b).
Material properties of E-glass fiber.

In transverse compression tests, the fiber bundle was unconstrained in the lateral direction, as shown in Figure 6, and the compressive speed was 0.1 mm/s. Bundle cross-sectional variation under transverse compression: (a) initial state, and (b) during compression test.
Experiment
Transverse compression tests were conducted on the bundle of E-glass fibers (Taishan Glass Fiber Co., Ltd. China) using a KES-G5 compressor (KATO TEKKO, Japan), with a compression speed of 0.1 mm/s. The bundle cross-sectional responses were recorded in real time with a JT-H6 camera (Shenzhen Jingtuo Youcheng Technology Co., Ltd. China) (Figure 7). The cross-section of the E-glass fiber bundle in Figure 7(b) was nearly close to a circular, and that is why the initial shape of the bundle cross-section was assumed as a circular. Compression test: (a) experiment apparatus, and (b) cross-section of the E-glass fiber bundle.
Results and discussion
Fibers motion in transverse compression process
Figure 8 showed the load-time curves in simulation and experiment, and the Spearman’s correlation coefficient was calculated by equation (5) to evaluate the fitting effect between simulation and experiment. Load-time curves in simulation and experiment.

A pretty good consistency between simulation and experiment results can be concluded as the Spearman’s correlation coefficient was 99.66%. Figure 8 indicated that the load did not increase rapidly until the time was about 1.75 s. Since the fibers motion in the bundle led to the load variation, it is necessary to observe the fibers movement during the test.
Variation of fibers position and bundle shape are the most observable behaviors in transverse compression, as presented in Figure 9. Initially, when the upper compression plate contacted and compressed the bundle, fibers on and around the bundle top boundary moved downwards at ease, making the bundle closer and tighter at 0.6 s. With the increase of time, adjacent fibers began to contact with each other. No limitation on the lateral direction made fibers move along lateral direction when the bundle closeness was higher due to the increasing number of closely contacted fibers at 1.19 s. Fibers around the left and rights sides were pushed outwards, making the near-compact stack of fibers within the bundle collapse and loosen at 1.48 s. As the test went on, the newly generated inter-fiber gaps were filled with fibers which continued moving downwards and outwards at 1.77 s. The bundle cross-section was widened so much that most fibers started to bear the load from the upper compression plate and it needed to overcome more inter-fiber friction for fibers to move outwards left and right. Again, fibers stack collapsed and loosened at 1.87 s when the bundle resisted higher load. Fibers motion in simulation (Insets: contour fibers) and experiment during the transverse compression.
The final shape difference at 1.87 s between simulation and experiments might be caused by the coating on glass fibers in experiments before the sale.
Bundle performances
The bundle parameters including bundle cross-sectional perimeter, area and filling factor were directly affected by fibers motion in tests. The variations of bundle parameters both in simulation and experiment during transverse compression tests were demonstrated in Figure 10. According to the equation of filling factor (equation (1)), it was a negative correlation between the variation trends of bundle filling factor and cross-sectional area in tests. Variations of bundle cross-sectional parameters in tests: (a, c, e) filling factor, area and perimeter in simulation, respectively, and (b, d, f) filling factor, area and perimeter in experiment, respectively.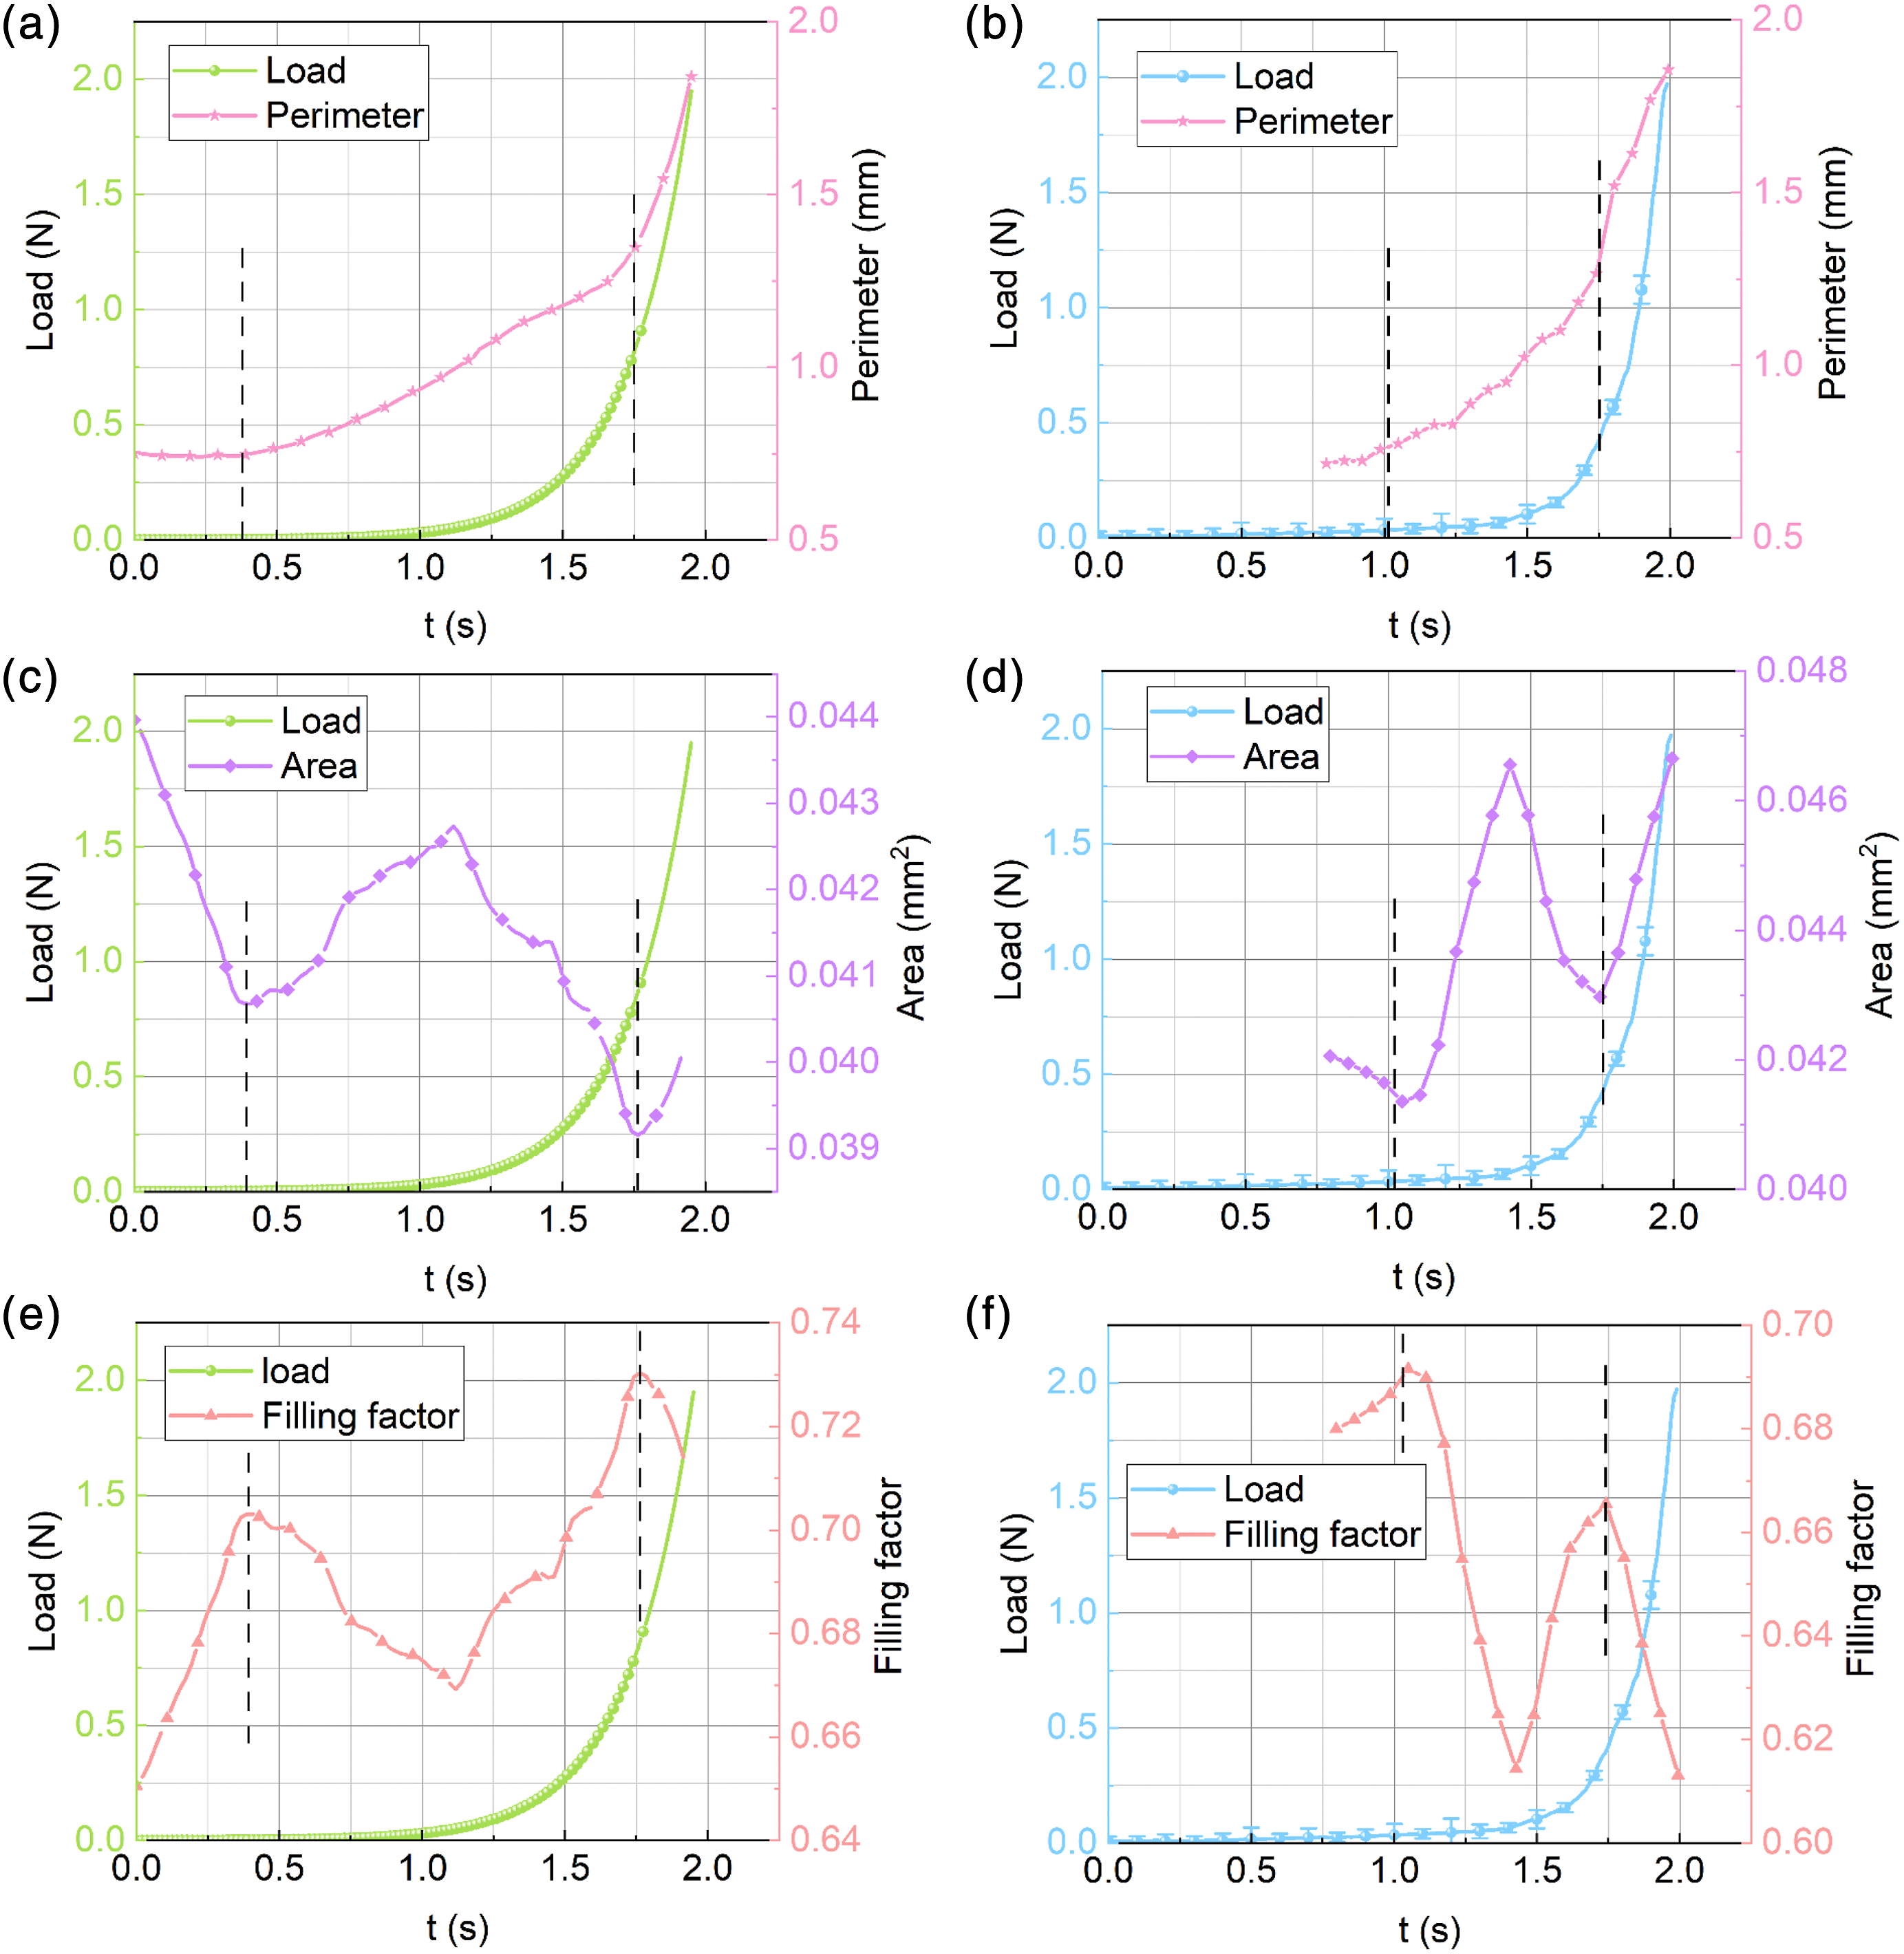
In the initial stage, the stable perimeter in Figure 10(a) and (b) and decreased area in Figure 10(c) and (d) demonstrated that the contact between fibers has become closer in the bundle, 39 which resulted in the increase of filling factor in Figure 10(e) and (f). After the area reaching the first local minimum value, the perimeter began to increase linearly accompanied by the fluctuated change of the area. At this stage, the bundle filling factor decreased and then increased in Figure 10(e) and (f) because its value was only related to the area. Then the load began to rise significantly when the perimeter rapidly increased and the area reached the local minimum value again as well as the filling factor arrived at the second local maximum value. This revealed that most fibers have sustained the load when the bundle was greatly compacted. Although the bundle filling factor can reflect the contact status of fibers in the bundle, the filing factor with larger fluctuation in tests could not be used to evaluate the load variation. In contrast, the bundle cross-sectional perimeter which varied monotonically in tests can be used to assess the load variation.
The perimeter growth rate was used to make quantitative analysis of the relationship between perimeter and load. The perimeter growth rate can be calculated as:
The variation trend of the bundle cross-sectional perimeter growth rate displayed in Figure 11 Variations of perimeter growth rate in tests: (a) in simulation, and (b) in experiment.
The different behaviors of the bundle cross-sectional parameters revealed that the bundle cross-sectional state is closely related to the load. Thus, the mechanical properties of bundle-based materials in transverse compression can be predicted by judging and analyzing fiber bundle states.
Mises stress distribution of the bundle
To further study the mechanical response of the bundle during transverse compression tests, the Mises stress of each fiber in the bundle can be computed by equation (7).
The Mises stresses of all fibers in the bundle can be plotted based on the FEM simulation results while the location of the selected cross-section of the bundle was at 95% along the bundle length direction. Figure 12 showed the Mises stress distribution of the bundle at different time during the transverse compression test when the time was larger than 1.75 s. As the test proceeded, the Mises stress distribution gradually presented as Gaussian distribution from Figure 12(b) to (d) while fibers in the middle region bore higher stress especially under high compression load. Mises stress distribution of the bundle in the transverse compression test: (a∼d): Mises stress distribution at different loading time.
While using the Gaussian distribution function to fit the Mises stress distribution of the bundle, the coefficient of determination (COD) was calculated to evaluate the fitting effect, and expressed as
Four cross-sectional locations along the bundle length were selected to compare the fitting effect, which were indicated as L_5%, L_35%, L_65% and L_95% (where ‘L’ represented the bundle length). The variation of COD showed in Figure 13 demonstrated that the Mises stress distribution of the bundle increasingly followed the Gaussian distribution with the increase of load. COD variation in tests for different cross-sectional locations along the bundle length direction.
The results analyzed above indicated that the Mises stresses of single fibers at distinct positions within the bundle differed much. Thus, the precise distribution of fibers within bundle cross-section needs to be considered, especially when two or more types of fibers are involved in hybrid bundles which are often adopted in stress-based functional applications.
Conclusion
In the present study, a novel algorithm to generate randomly distributed fibers within the bundle has been proposed. The cross-sectional response of the bundle in transverse compression tests including bundle cross-sectional perimeter, area, filling factor and Mises stress distribution has been studied in experiments and simulation. Results showed that the cross-sectional perimeter increased monotonically during transverse compression tests. In the transverse compression test, the load began to increase rapidly when the perimeter growth rate was larger than 0.8 and reached the peak value when the perimeter growth rate was about 1.5 for the bundle with 91 fibers. Besides, the Mises stresses of single fibers at different locations in the bundle cross-section were different and the Mises stress distribution of the bundle followed the Gaussian distribution when the load reached the peak value. The results presented in the current work provide a novel method to generate randomly distributed fibers and a guidance for the structural design of fiber bundles as well as a possibility to predict the mechanical properties of bundle-based materials by analyzing bundle cross-sectional responses in transverse compression.
Footnotes
Declaration of conflicting interests
The author(s) declared no potential conflicts of interest with respect to the research, authorship, and/or publication of this article.
Funding
The author(s) disclosed receipt of the following financial support for the research, authorship, and/or publication of this article: This work was supported by the Fundamental Research Funds for the Central Universities (2232023G-01, 2232021G-02 and 2232020D-15), the grant from the National Natural Science Foundation of China (12202100), the grant from the Natural Science Foundation of Shanghai (23ZR1401900), the Open Fund of Shanghai Key Laboratory of Lightweight Composite (2232020A4-01), the Young Elite Scientists Sponsorship Program by CAST, and the Fund of National Engineering and Research Center for Commercial Aircraft Manufacturing (F-CXKT-0301C, COMAC-SFGS-2021-667) to Prof. Zhenzhen Quan, and the Fundamental Research Funds for the Central Universities and Graduate Student Innovation Fund of Donghua University (CUSF-DH-D-2019059) to Ms. Qiujin Gu.