
Abstract
High-distance woven spacer fabrics have been developed into a variety of special textile products for a wide range of applications. As a type of sandwich structure, their applications are heavily dependent on their compressive properties. In this study, the compressive properties of high-distance woven spacer flexible inflatable composites (HDWSFICs) have been evaluated by varying the indenter diameter, initial inflation pressure, and spacer yarn density. The experimental results showed that the compression process can be divided into three stages, including the Contact Stage, the Stress Transition Stage and the Densification Stage. In the Stress Transition Stage, the HDWSFICs can transform compressive load into tension stress, and especially local stress into integral stress, which can be considered a “Stress Transformer”. The existence of the spacer yarns allows the inflatable composites to bear more than three times the compressive load of the inflatable membrane material itself. The compressive modulus increases with spacer yarn density and initial inflation pressure, thus the stiffness of HDWSFICs can be designed. The findings of this study may provide ideas for the design of a “Stress Transformer” and theoretical references for the development of high-distance woven spacer inflatable composites with excellent mechanical properties.
Keywords
Introduction
Inflatable structures made of membrane materials have been widely applied in many fields, such as construction, protection, aerospace, and the automotive industries.1–6 The compressive performance of the inflatable membrane material is determined by the cooperation of the membrane body and the internal air pressure.7–10 At present, the membrane body is usually made of polyvinyl chloride (PVC) membrane or PVC-coated two-dimensional fabric material.11,12 Although traditional inflatable membrane materials have good energy absorption capacity, they still have some limitations on the shape stability and rigidity of the structure. 13 Because of their excellent characteristics such as lightweight, high strength, designability, and portability, high-distance spacer fabric flexible inflatable composites, which are prepared by compounding fabric (generally refers to a spacer fabric with spacer filaments more than 50 mm) 14 with PVC, are widely used in inflatable building, tents, aircraft wings, boats, and other consumer industries.1–17
In contrast with conventional spacer fabrics, the spacer yarns’ main role in the high-distance fabric is to serve as a connecting pile in the fabric and allow the fabrication of inflatable composites with more complex cross-sectional geometries.18–20 Therefore, the high-distance spacer fabric flexible inflatable composites can bear the loading by stabilizing the shape and rigidity of the structure. 21 Since the last few decades, some efforts have already been made to investigate the physical properties of high-distance spacer fabric flexible inflatable composites. In an investigation on the bending performance of high-distance woven spacer flexible inflatable composites (HDWSFICs) by Davids et al., 22 the experimental assessment and nonlinear finite-element analysis results showed that the bending stiffness increases by increasing the inflation pressure. Apedo et al.23,24 modeled the free vibration of inflatable orthotropic woven fabric beams by using the dynamic stiffness method, the study results showed that the influence of the inflation pressure on the natural frequencies depends strongly on the mechanical properties of the fabric. Yang et al. 25 studied the low-velocity impact resistance of the lattice warp-knitted spacer flexible inflatable composites (LWSFICs). They demonstrated that the LWSFICs have excellent energy absorption characteristics, and their threshold load could be delayed by decreasing inner air pressure in its use to give them more space for deformation during impact loading (up to 90%). According to Ref 26, the differences in mechanical properties between the membrane surfaces of inflatable composites with woven structure and knitted structure fabric applied as reinforcement were systematically studied. The experimental results showed that the inflatable composites reinforced with woven spacer fabric have the characteristics of lighter weight and higher strength, which also means that the HDWSFICs could have better compressive strength than knitted ones. However, the compressive property of the HDWSFICs has rarely been studied. Moreover, in practical application, the size of the compression interaction surface between inflatable composites and components is different. Therefore, it is necessary to investigate the local compression behavior of HDWSFICs for better design and optimization of this material.
In order to reveal the results of circular plate compression of HDWSFICs resulting from different contacting surface areas of components, this paper aimed to conduct circular plate compression of HDWSFICs compressed by a circular indenter with variable diameters. The stress transformation behavior of HDWSFICs was revealed by a local compression test. It also discussed the effects of the density of the spacer yarn and the inflation pressure on the circular compressive properties of HDWSFICs. The findings may provide ideas for the design of “Stress Transformer”, theoretical references, and an accumulation of experimental data for the development of flexible composites represented by HDWSFICs.
Materials and experiments
Materials
High-distance woven spacer fabrics (HWSFs) are provided by Zhejiang Deruite Home Textile Technology Co., Ltd. PVC transparent film and plastic glue were supplied by Haining Zhelong Cloth Co., Ltd.
Mechanical parameters of the fibers.

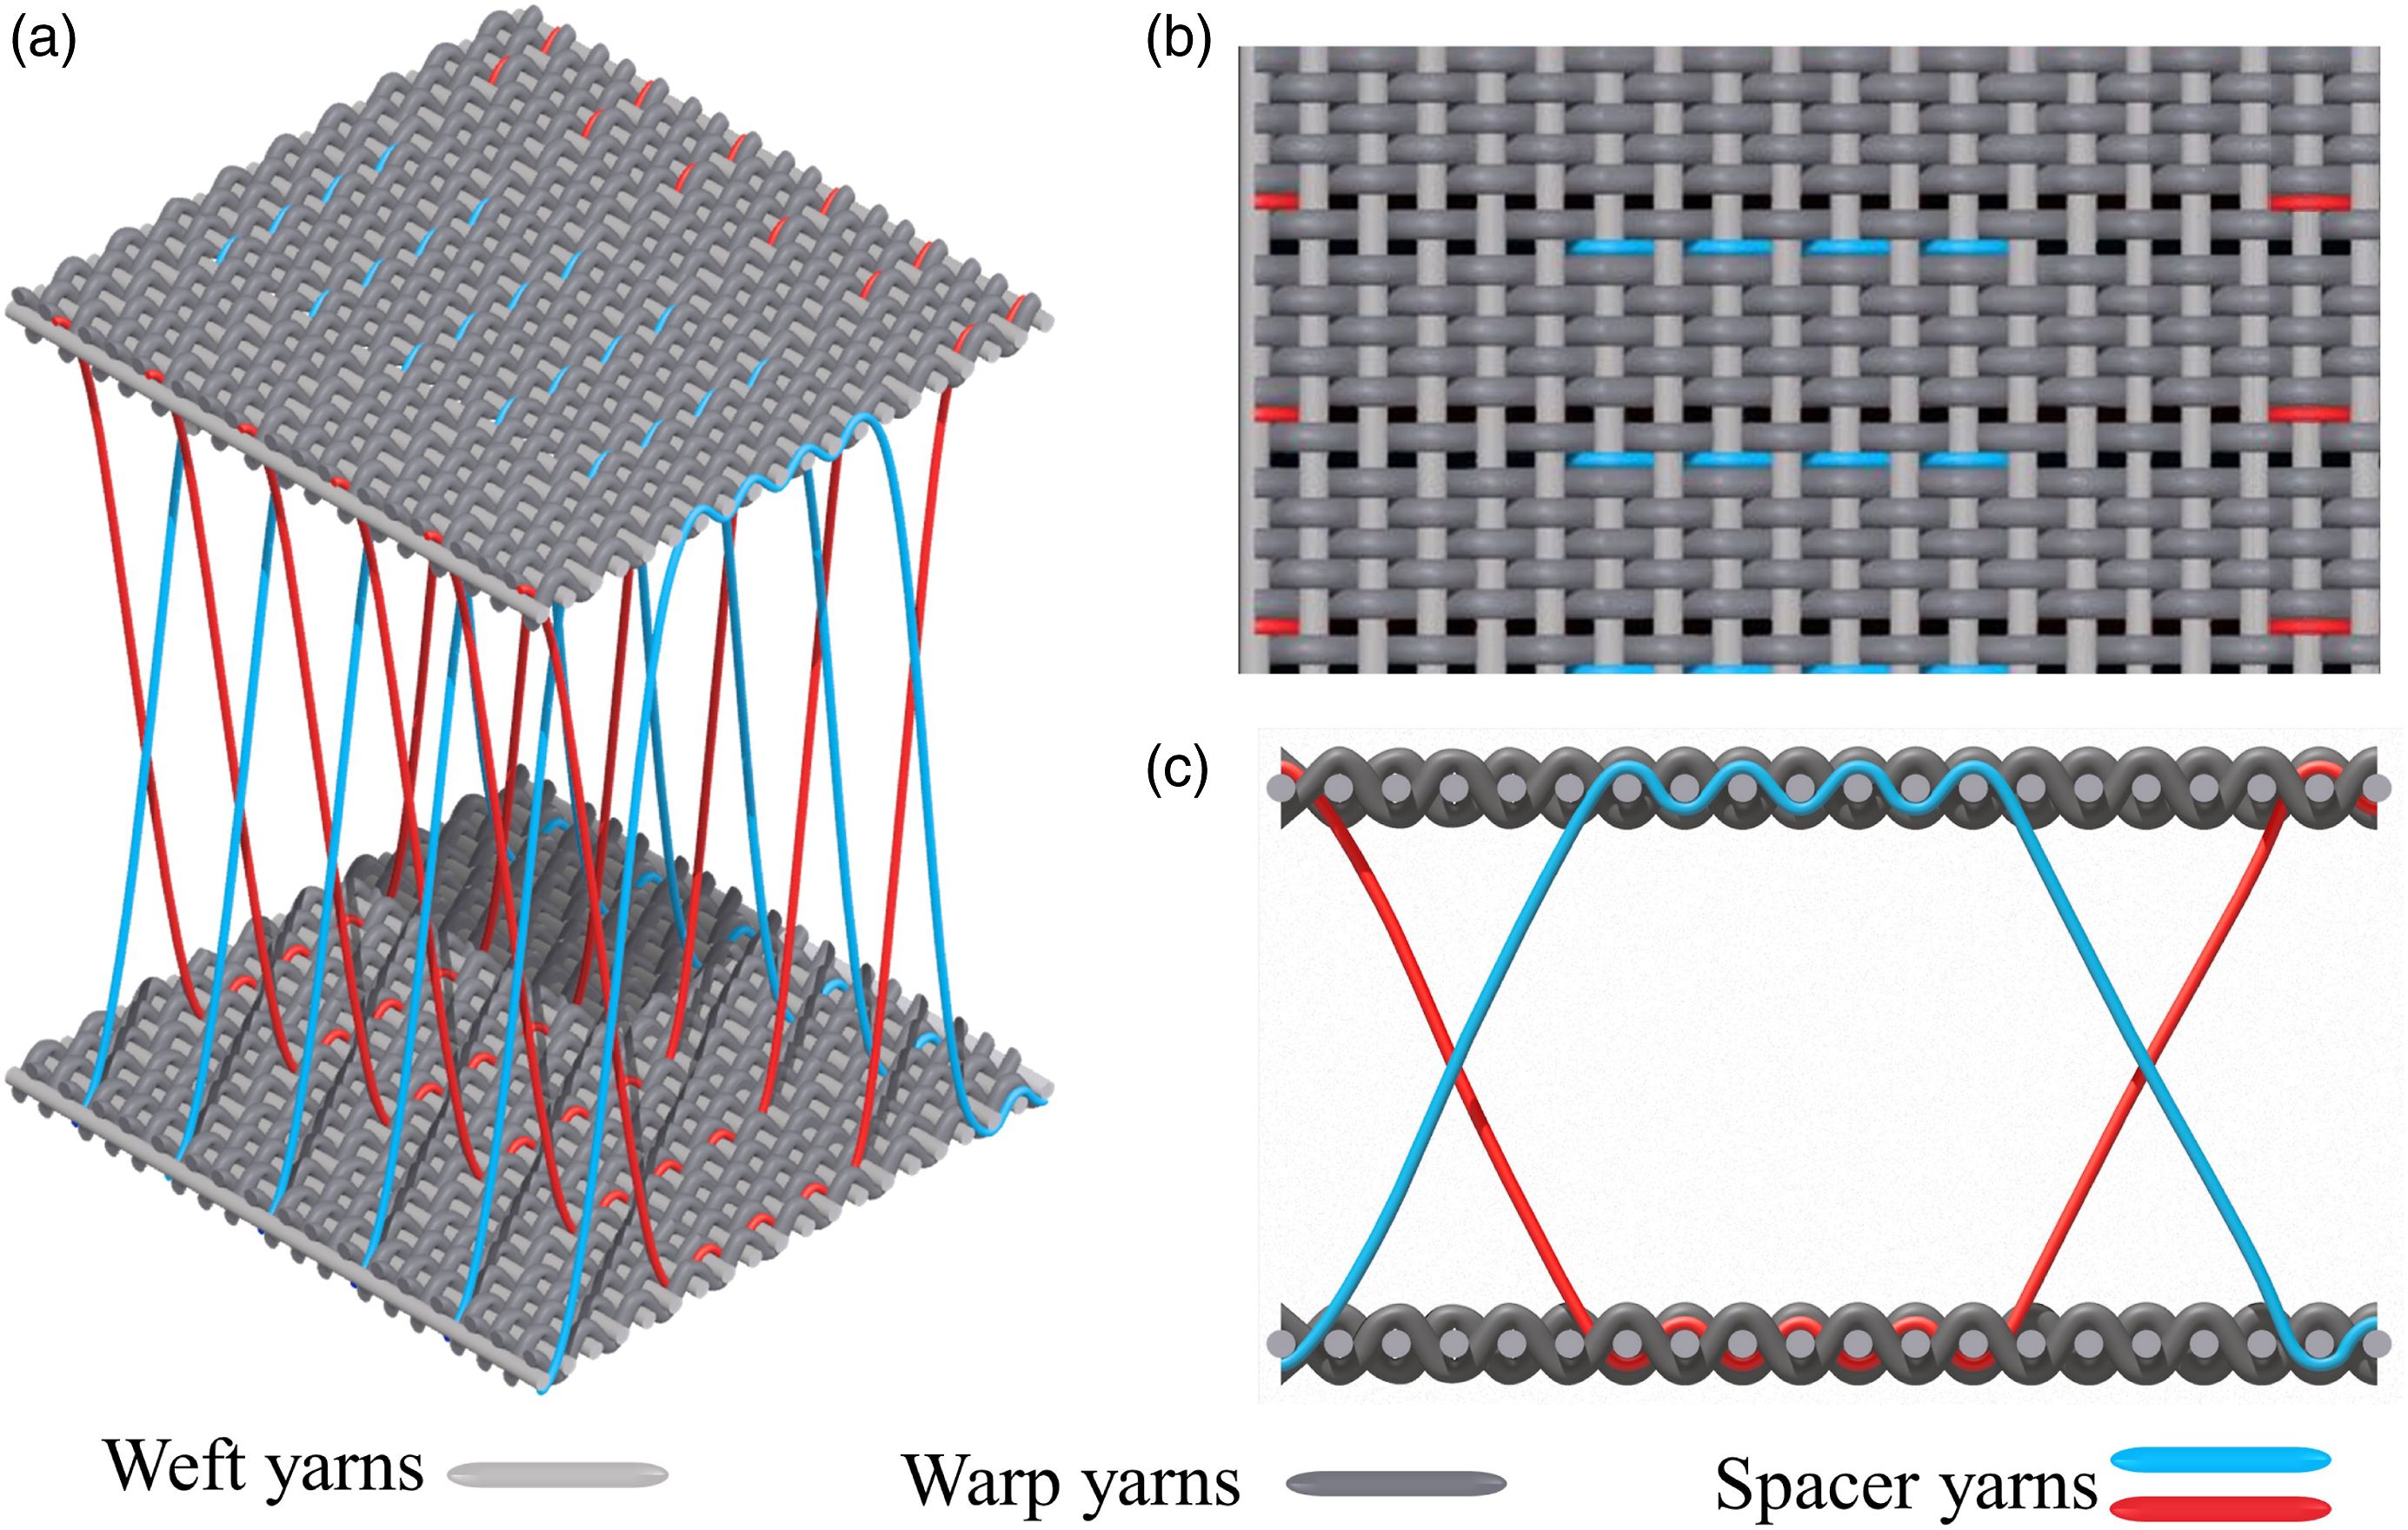
The structure of HWSFs: (a) The overall view of HWSFs; (b) The vertical view of HWSFs; (c) The side view of HWSFs.
Fabrication
The manufacturing process of the “Stress Transformer” is shown in Figure 2. The cleaned HWSFs and PVC resin are rolled to form a laminated composite material, which was then sequentially dried. Then align the PVC-coated high-distance woven spacer fabric up and down through the position where the spacer yarn is connected, cut it into a circle with a diameter of 20 cm, and then cut the PVC transparent film according to the size specifications required by the 5 cm-thick sample. The plastic glue is applied to the edges of the transparent PVC film and the coated spacer fabric, then a certain pressure is applied to bond the upper and lower surface edges of the fabric to the transparent PVC film at room temperature, thus achieving the purpose of sealing the edge. The air tag will then be installed after a small opening is made on the upper surface layer that is 5 cm from the circle’s center, which can be connected to an electric air pump to inflate and measure the real-time air pressure. Since the “Stress Transformer” is a gas-filled material, airtightness is particularly important for the performance of this sample. Before the compression test, the sample is inflated to a certain air pressure and then put into water, and a certain pressure is applied to make the whole sample immersed in water. If there are bubbles around the sample, then it is a leaking sample. If none, the sample has good air tightness; therefore, the effect of gas leakage could be ignored. The illustration of “Stress Transformer” manufacturing process.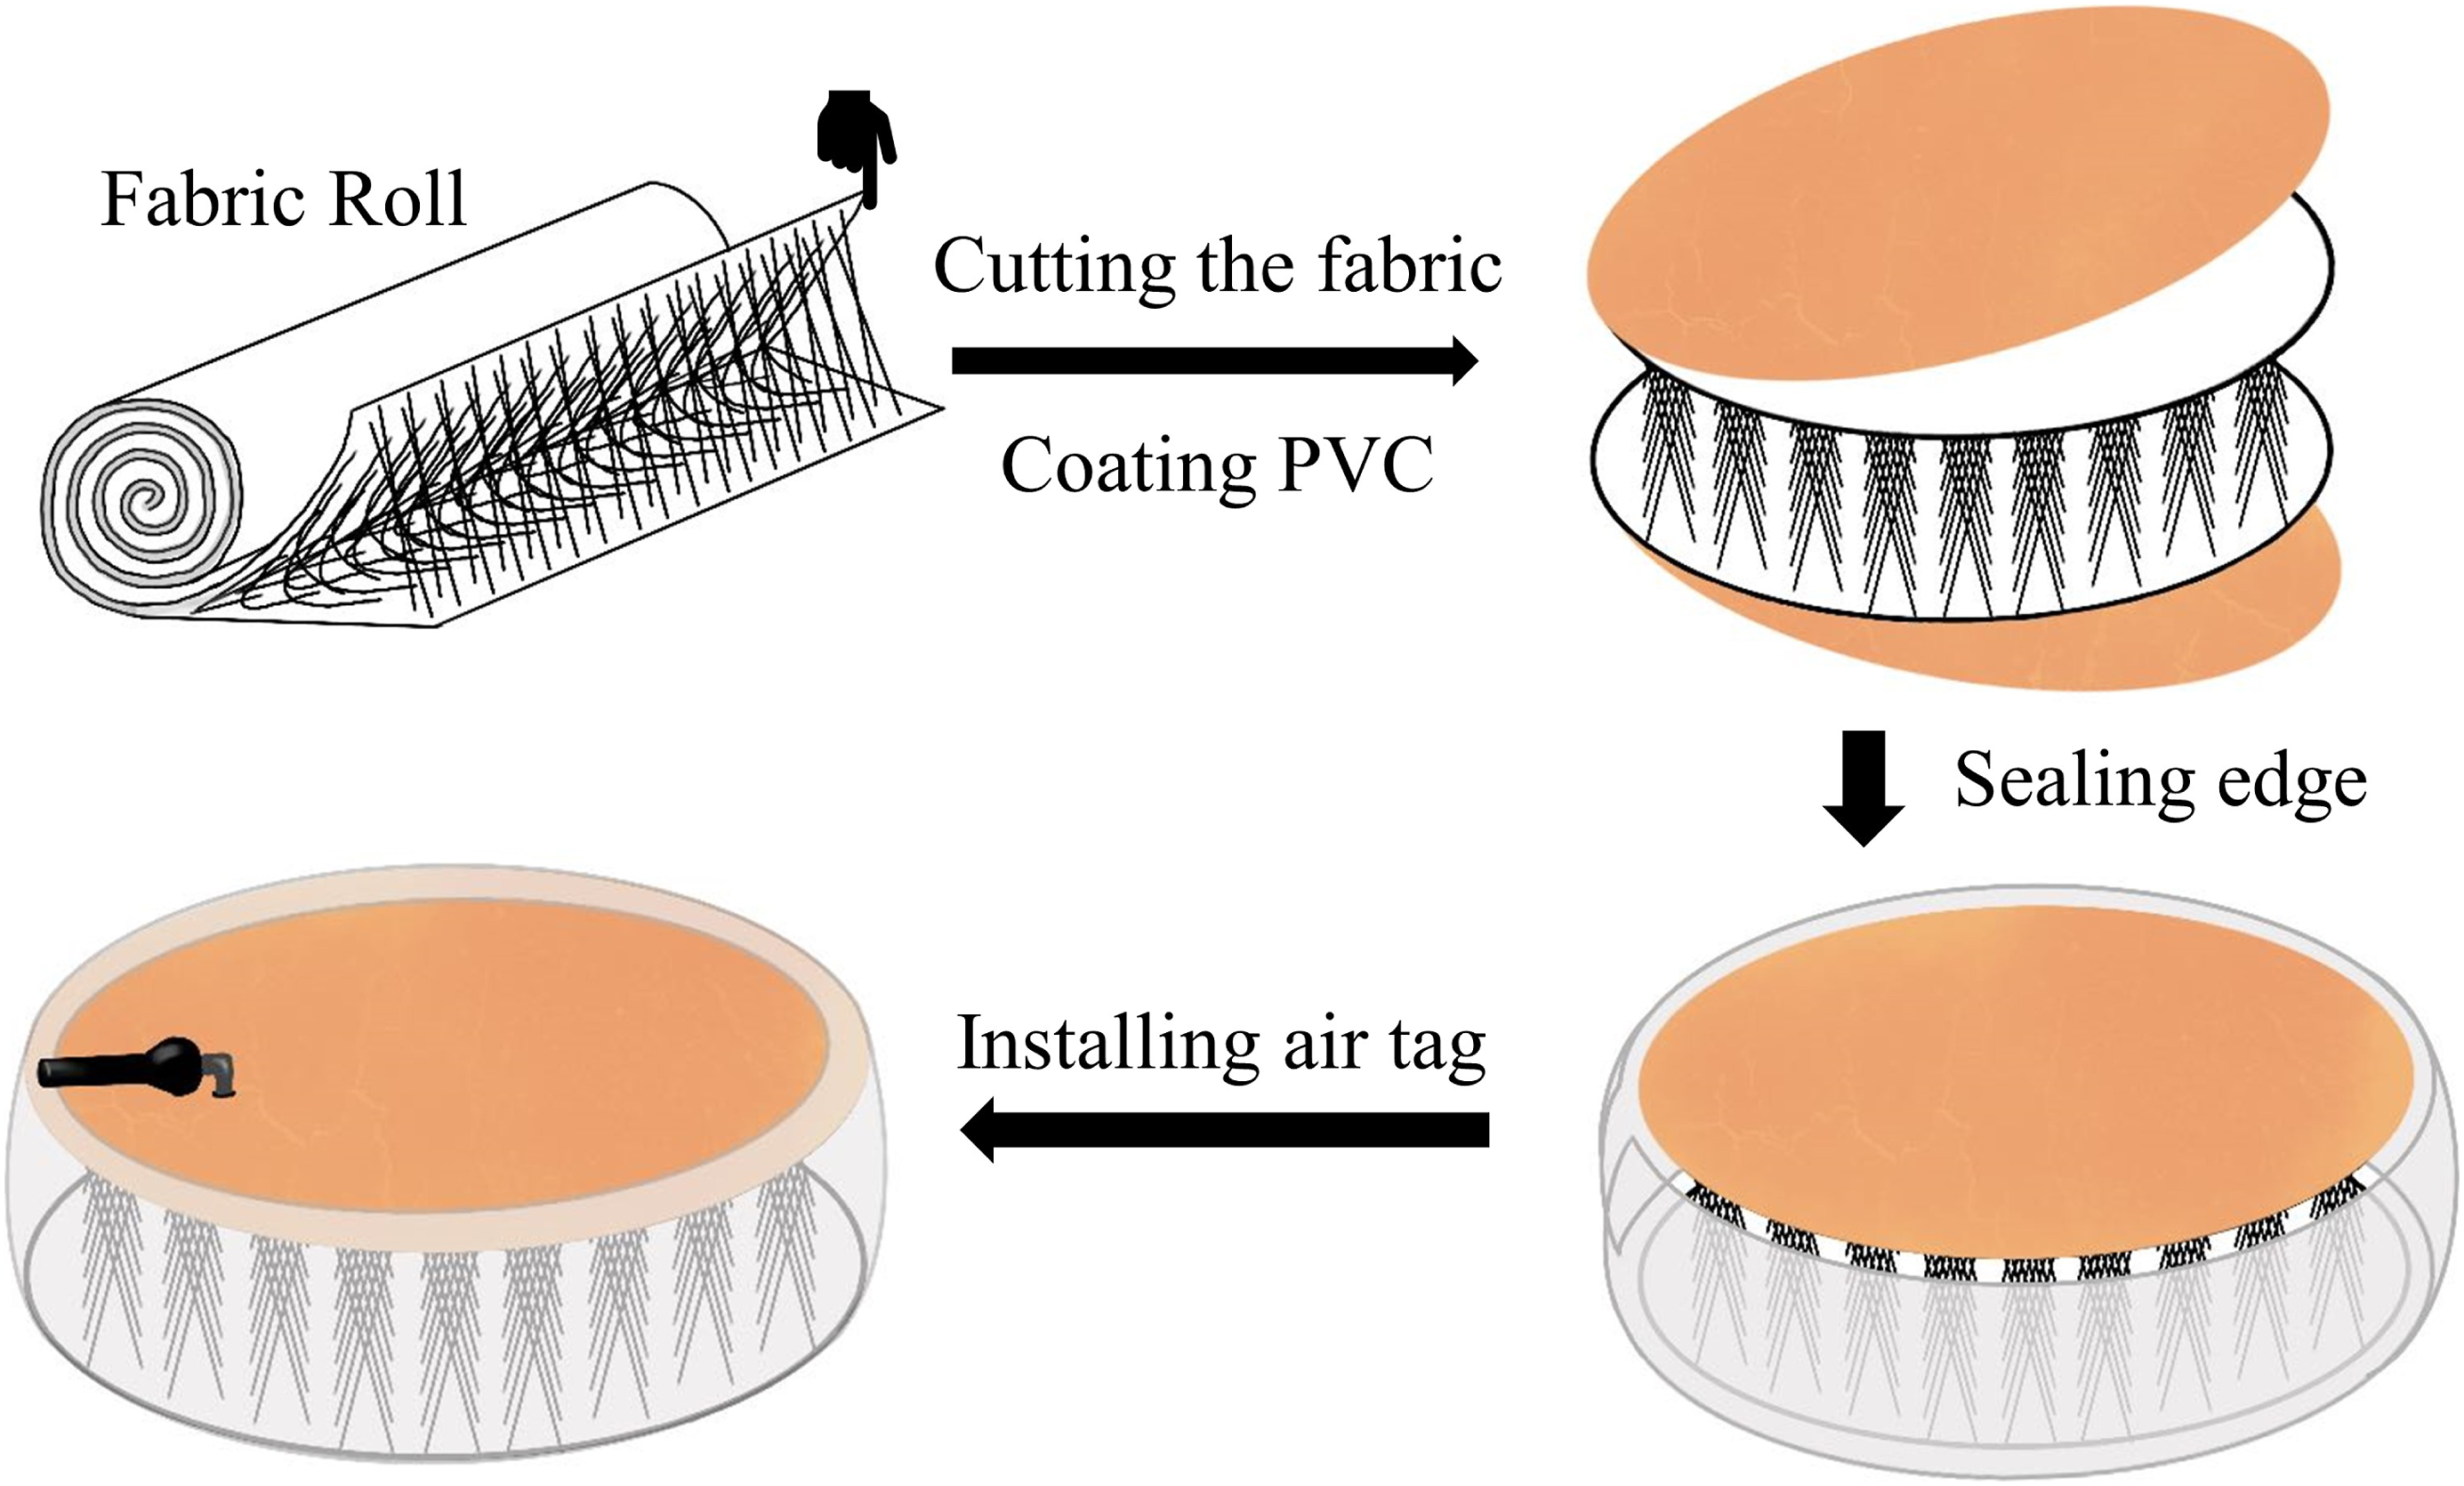
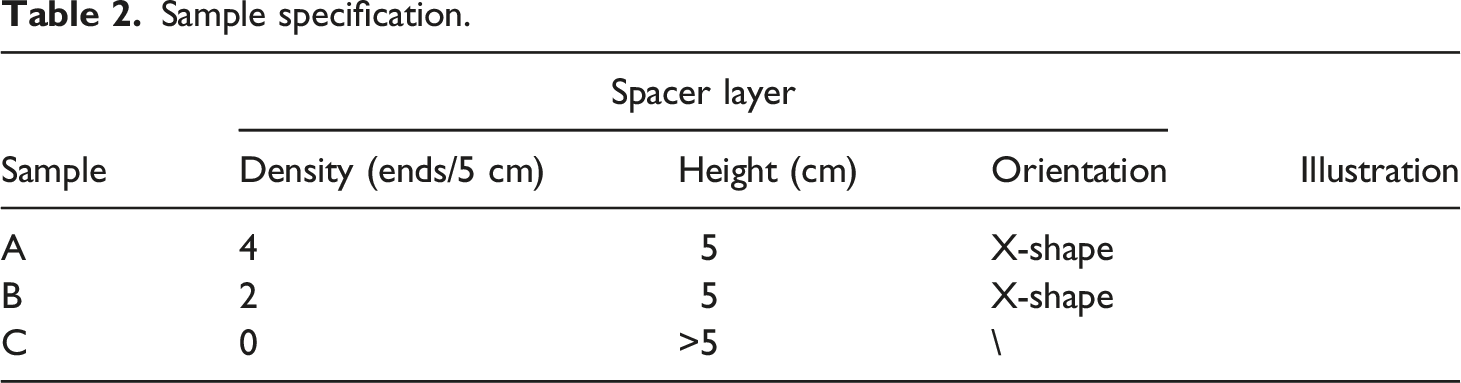
Figure 3(a) shows the “Stress Transformer” before inflation, and the internal spacer yarn is in a curved shape. The upper and lower surfaces are smooth and flat. Figure 3(b) displays the “Stress Transformer” after inflation. It can be seen that the internal spacer yarn is in a straightened state, and the position of the spacer yarn on the upper and lower surfaces is in the shape of a concave point. Given the effect of different spacer yarn densities on the compressive performance, three samples were thus set up. The basic parameters of the samples are shown in Table 2. Sample C is an air-filled membrane material without spacer yarn. Sample images of “Stress Transformer” before and after inflating: (a) Before inflating; (b) After inflating. Sample specification.
Working principle
The “Stress Transformer” is inflated through the air tag until the spacer yarns are in a tensioned state. As shown in Figure 4, when the inflated “Stress Transformer” is subjected to an external compression force (F1), the spacer yarns in the “Stress Transformer” are visibly stretched, but the overall shape of the “Stress Transformer” changes very little. It is obviously visible that under this condition, because the volume is almost unchanged, the internal pressure is almost unchanged, and the spacer yarns are visibly stretched, the external force (F1) is transformed into the tension force exerted on the spacer yarns. Because the spacer yarns penetrate the upper and lower surfaces of the fabric and are arranged in an X-shape in the spacer layer, the spacer yarns will generate transverse tension parallel to the upper and lower surfaces when they are elongated, thus driving the textile membrane to form membrane tension ( Stress state of “Stress Transformer”: (a) Physical schematic diagram; (b) Force analysis diagram.
Compression test
Tapping into the Shimadzu AG-250KNE universal material testing machine, the local compressive performance of HDWSFICs and inflatable membrane materials was characterized with reference to standard the ASTM C365/C365M-11a, as shown in sample Figure 5. Good airtightness samples were used in the compression test. The lower compression platform is a square platform measuring 20 cm × 20 cm. Considering the influence of different compression areas on the compressive performance, three wooden compression indenters of S, M, and L sizes are set up and placed between the metal compression platform and the sample, with a diameter of 4 cm, 6 cm, and 8 cm and a height of 4 cm. All samples were circular in shape and 20 cm in diameter. All experiments were performed at 23°C and 65% relative humidity. In order to explore the effect of the initial inflation pressure in the material on the compressive performance, three initial air pressures were set up: 55 kPa, 85 kPa, and 110 kPa. After the sample is inflated to the desired initial air pressure value, it is placed between the upper and lower compression platforms. The upper compression platform presses the sample to a deformation of 65% of the initial thickness at a load speed of 3 mm/min. The sensor on the universal material testing machine Load and displacement values were recorded in real time, and a load-displacement curve was drawn. When the compression test is carried out, the air tag is connected to an external air pressure indicator, which can dynamically detect the difference between the internal air pressure and the atmospheric pressure in the compression process and draw the air pressure-displacement curve according to the changes in the displacement and the pressure difference. Sample compression test.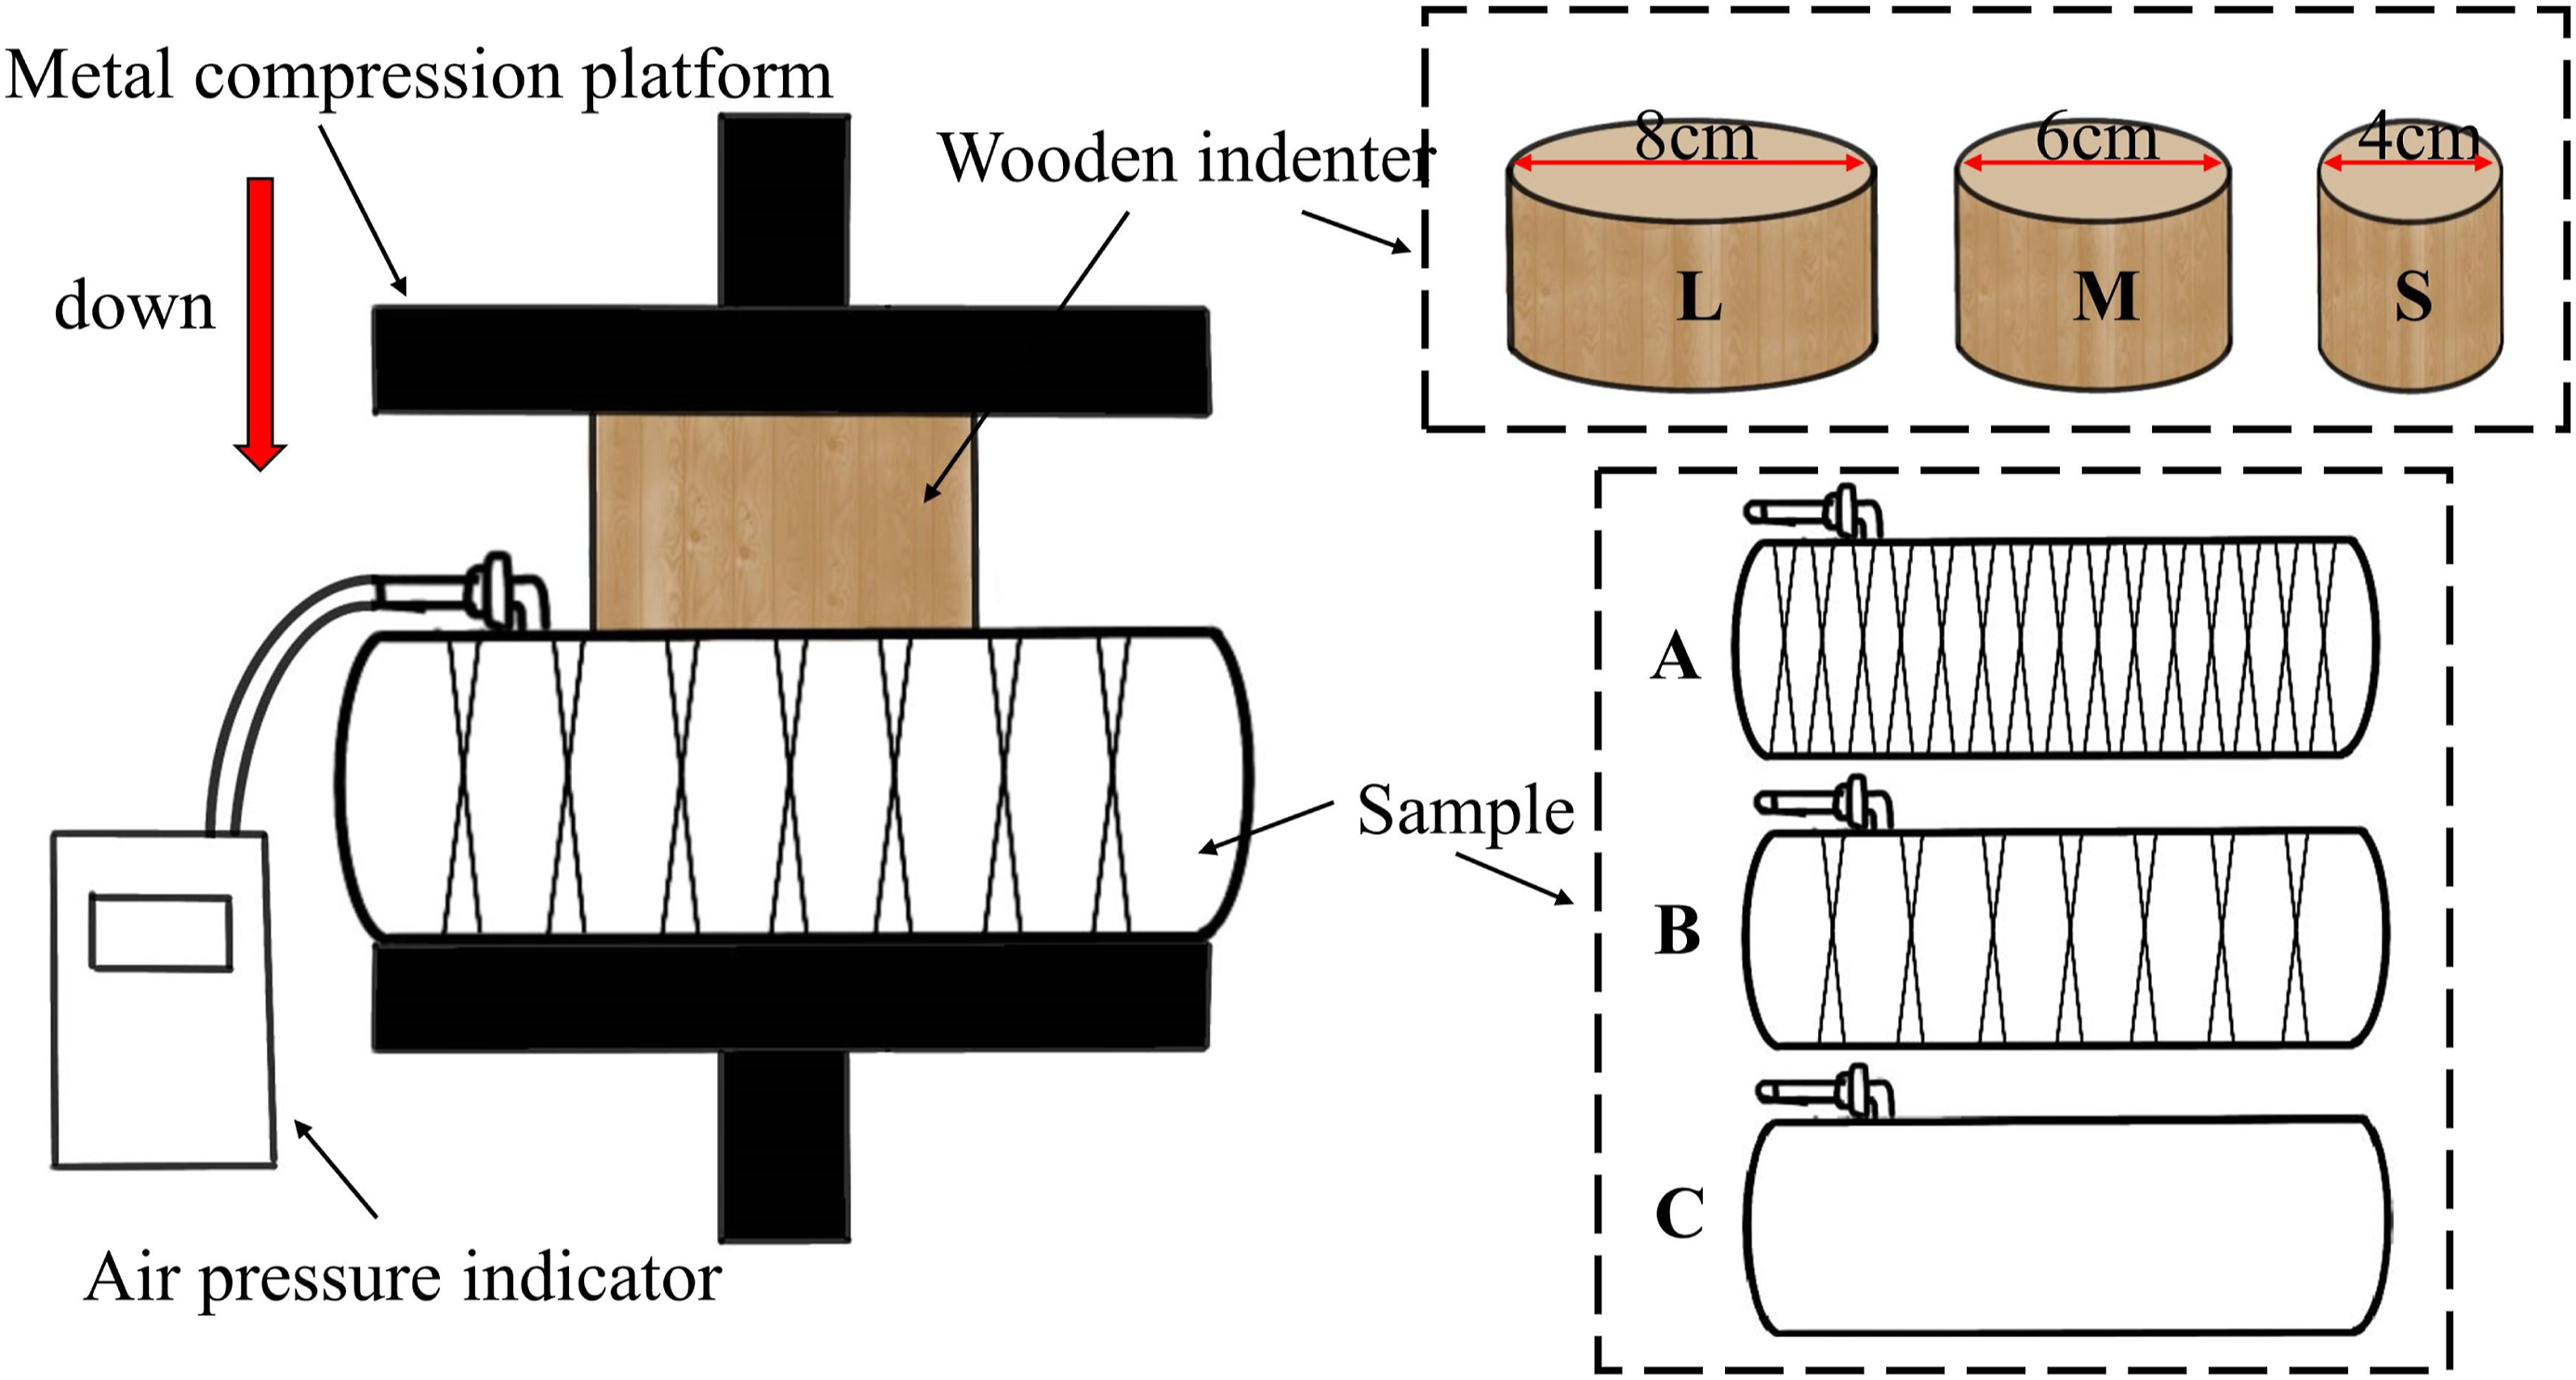
Results and discussion
Stress transformation mechanism of HDWSFICs
Figure 6(a) shows the typical local compressive load-displacement curve and pressure-displacement curve of the HDWSFICs. This curve utilizes the data from the compression experiment on the A sample with an initial pressure difference of 110 kpa under the L-size wooden indenter. It can be observed that the compressive behavior of the HDWSFICs is nonlinear, and the compression process is divided into three stages according to the change in the slope of the curve. They are the initial contact stage (stage I), the stress transition stage (stage II), and the densification stage (stage III). Figure 6(b) is the pressure analysis diagram of the three stages, and Figure 6(c) shows the whole process of the compression test. The compression process diagram: (a) Real-time load, pressure and displacement curves; (b) Three-stage force analysis; (c) Photos of the compression process.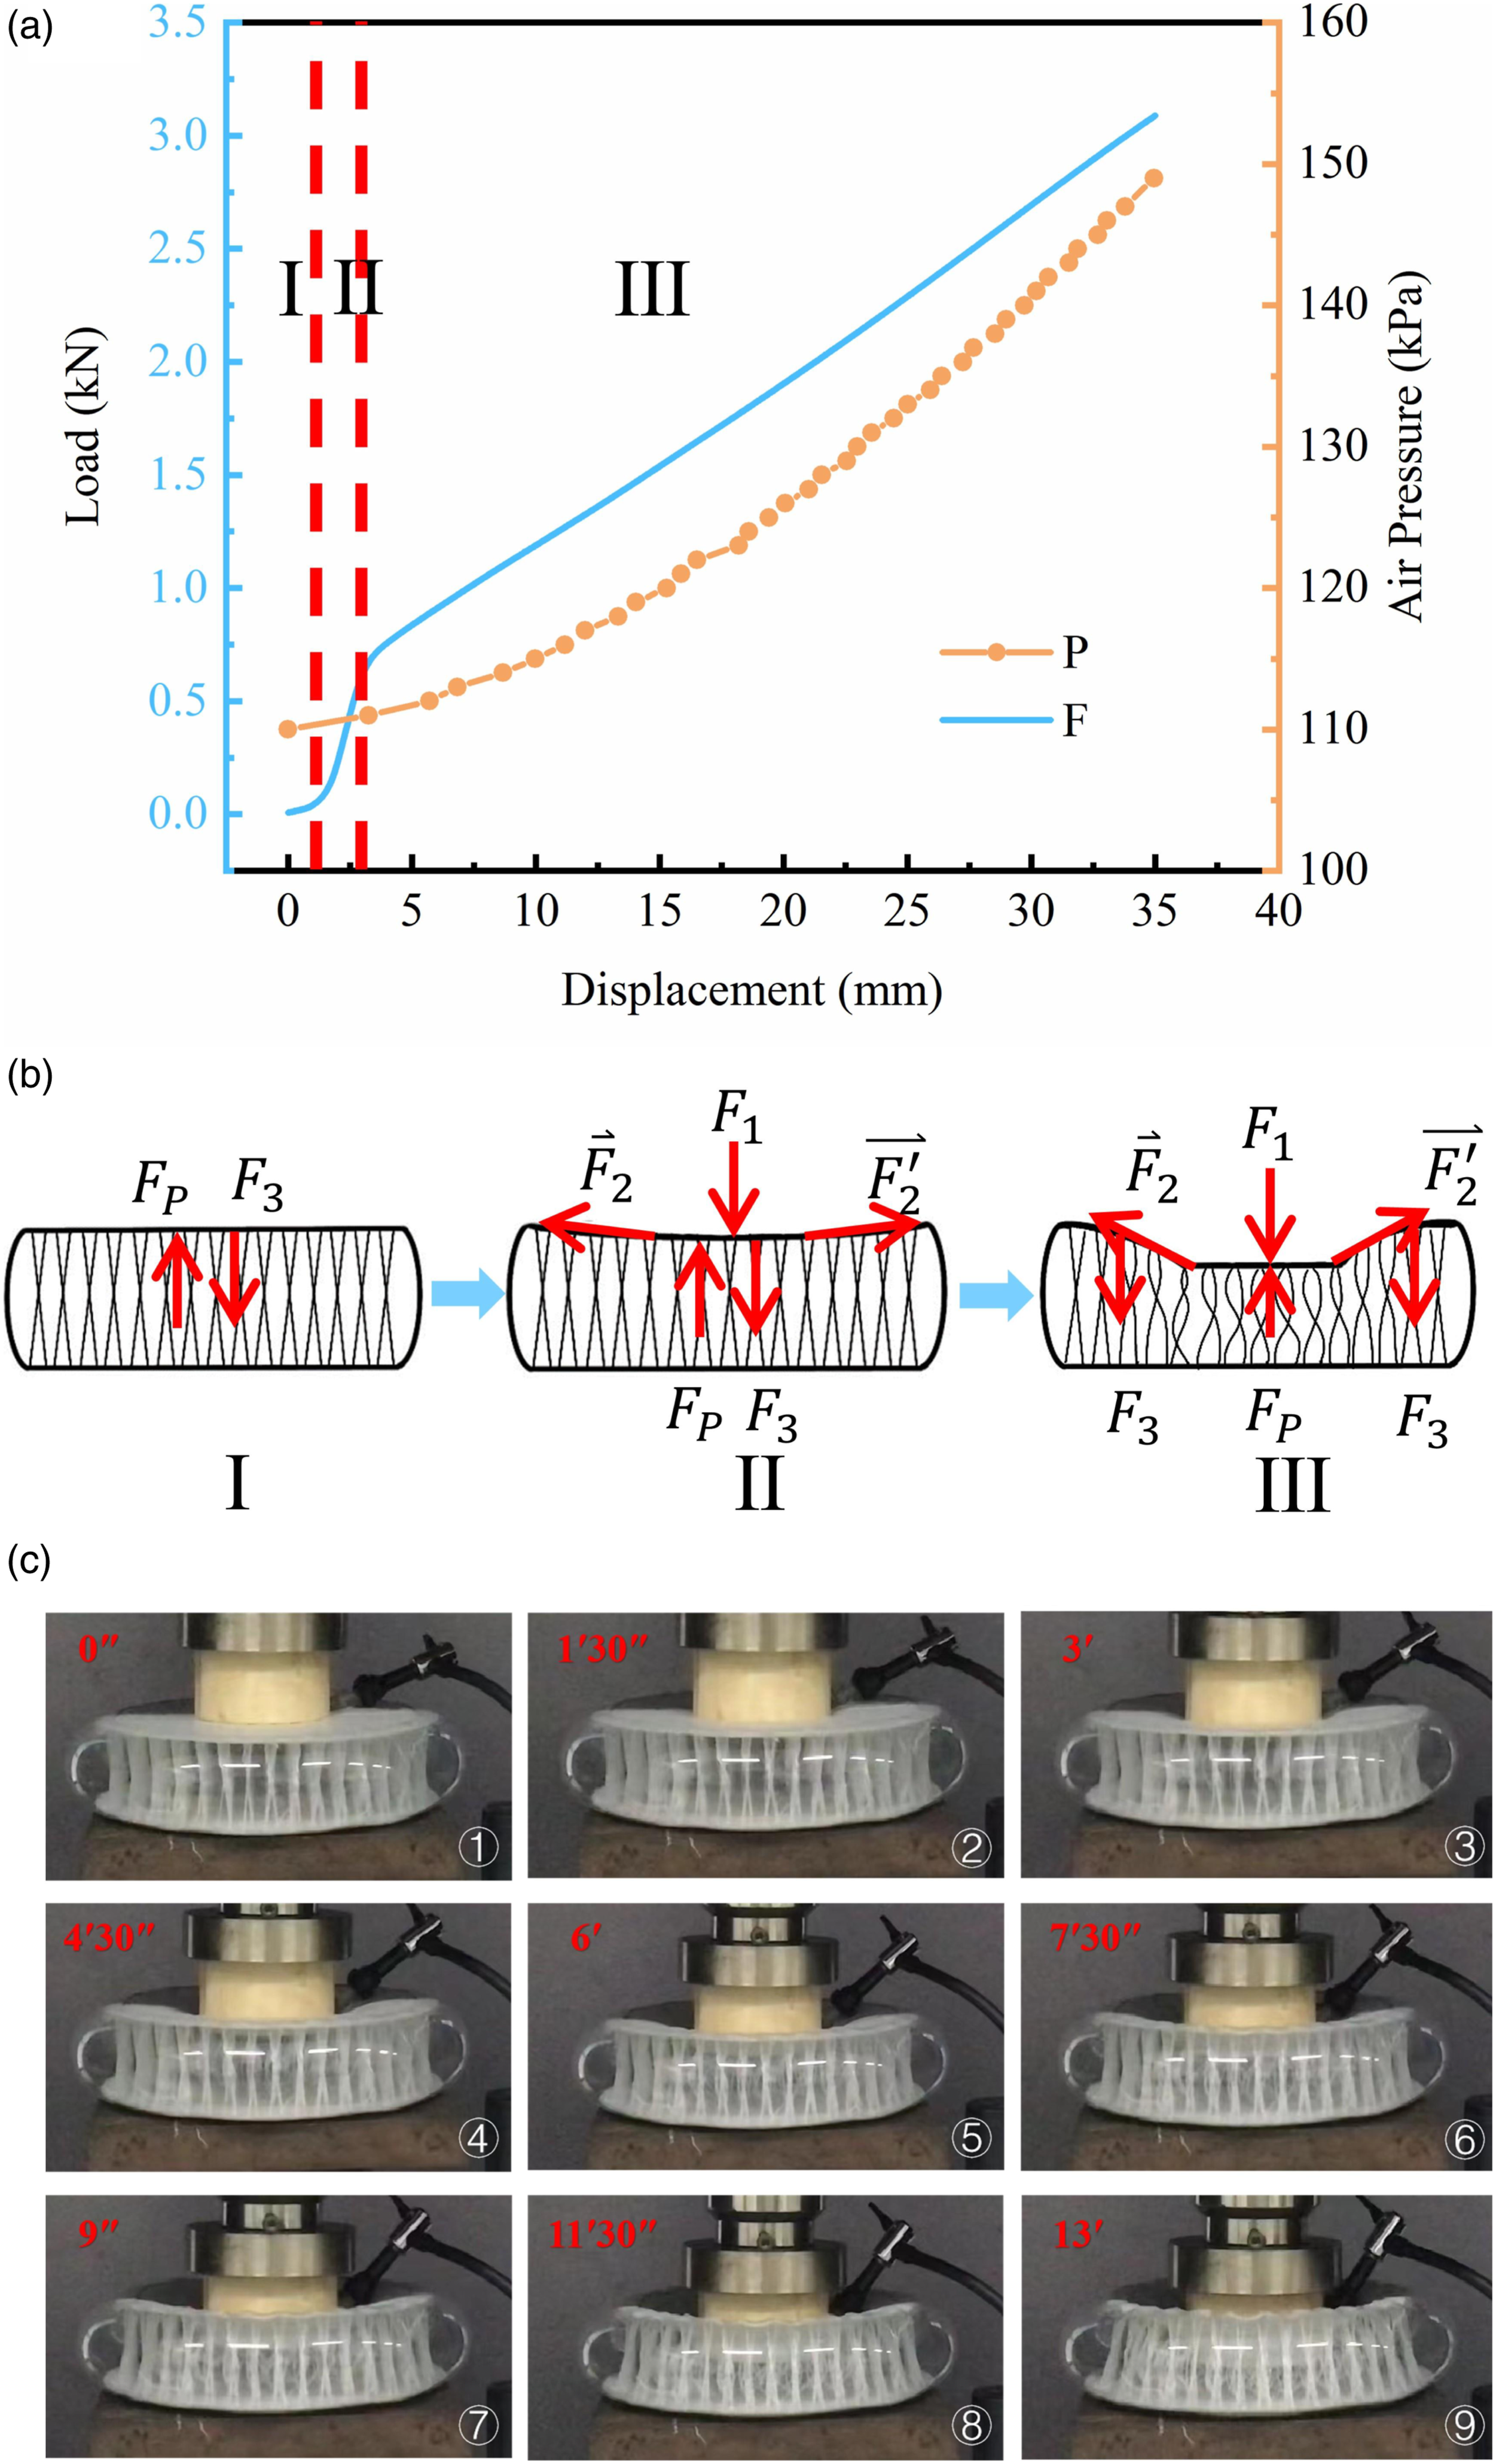
In Figure 6(a), the initial contact stage (stage I) corresponds to ① to ② in Figure 6(c). The upper surface starts to contact the wooden indenter, and the HDWSFICs hardly changes. Due to the short displacement range and the fact that the top surface has only just started to experience local pressure, the load in Figure 6(a) grows extremely slowly with displacement. The air within the HDWSFICs is sealed, compressed, and the internal pressure rises. The HDWSFICs is subject to an opposing force (FP) from the gas. The transparent PVC side film enlarges and the HDWSFICs’ volume rises, causing the pressure to swiftly return to its starting level. As a result, the real-time pressure changes little, and the slope of the load-displacement curve similarly changes little. At this time, as shown in Figure 6(b) I, due to the initial air pressure, the spacer yarns are in the elongation state, so the tension (F3) of the spacer yarns on the vertical direction of the upper surface is balanced with the pressure (FP) of the gas on the upper surface, and the formula (1) is as follows:
The stress transition stage (stage II) in Figure 6(a) corresponds to ② to ③ in Figure 6(c). It can be observed that the overall shape of the HDWSFICs changes very little, the local compression part is slightly sunken, the spacer yarns under the compression part have a straight state and begin to lodge, and the spacer yarns outside the compression part are in a straightened state. As displayed in Figure 6(a), the load increases rapidly, and the real-time air pressure starts to rise. This is due to the reaction force (FP) of the gas when the compression continues, so that the upper and lower layers and the side transparent PVC film have a tendency to expand outwards. The spacer yarn of the 3D woven spacer fabric connects the upper and lower woven surface layers and restrains the upper and lower surfaces to produce outward expansion deformation. Therefore, as shown in Figure 6(b) II, the stress generated by the compression will be transferred to the spacer yarn. The tensile force (F3) generated by the yarn restraining the upper and lower surfaces expanding outwards will be transmitted to the upper and lower surface layers and converted into the tension (
The HDWSFICs transforms the local compressive stress (F1) into the tension of the spacer yarn (F3) and the tension of the upper and lower layers (
The densification stage (stage III) in Figure 6(a) corresponds to the pictures after ③ in Figure 6(c). Due to the increase in compression displacement, the local compression part is badly dented, the spacer yarn around the compression part also begins to fall, and radial patterns appear around the local compression part on the upper surface. With the increase of the downward pressure (F1) displacement, more and more spacer yarns are lying down, and the folds are gradually deepened, which means that the number of spacer yarns that bear the tensile force (F3) is gradually decreasing, and the compressive stress is mainly borne by the gas layer. Therefore, in Figure 6(a), the load increases linearly with the displacement, but the slope of the curve is smaller than in the second stage, and the air pressure also increases rapidly with the displacement. As shown in Figure 6(b) III, the force balance formula (3) of the upper surface is the same as that of the II stage:
Effects of spacer layer density on compressive properties
As shown in Figure 7(a), samples A and B are HDWSFICs, while sample C is an inflatable membrane material. In the compressive load-displacement curve, it is found that the curve shapes of samples with different spacing yarn densities are quite different. The compressive load-displacement curves of samples A and B are consistent with the typical load-displacement curves of the “Stress Transformer”. According to the change in the slope of the curve, it is divided into three stages. The initial contact stage (stage I) curve is relatively flat, and the curve of the transition stage (stage II) rises sharply, and the slope of this stage is the largest; the curve of the densification stage (stage III) rises steadily, and the slope is smaller than that of the stress transition stage (stage II). However, the slope of the compressive load-displacement curve of sample C changed little, and the load maintained a stable upward trend with displacement while the trend was consistent throughout the process. The above examples demonstrate that the spacer yarn is the main factor that makes the inflatable membrane material become the “Stress Transformer”. By observing the shape of the load-displacement curve of the A and B samples and the load-displacement curve of the C sample, it is found that starting from the stress transition stage (stage II), under the same displacement, the load of the A and B samples appears to be significantly larger than that of the C sample, indicating that the presence of the spacer yarn allows the material to withstand higher compressive loads, the HDWSFICs are much more compressive than the gas-filled membrane materials, and the stiffness is significantly improved. Compression data graphs of different spacer yarn densities: (a) Compressive load-displacement curves; (b) Internal air pressure-displacement curve; (c) Compressive modulus values for different samples.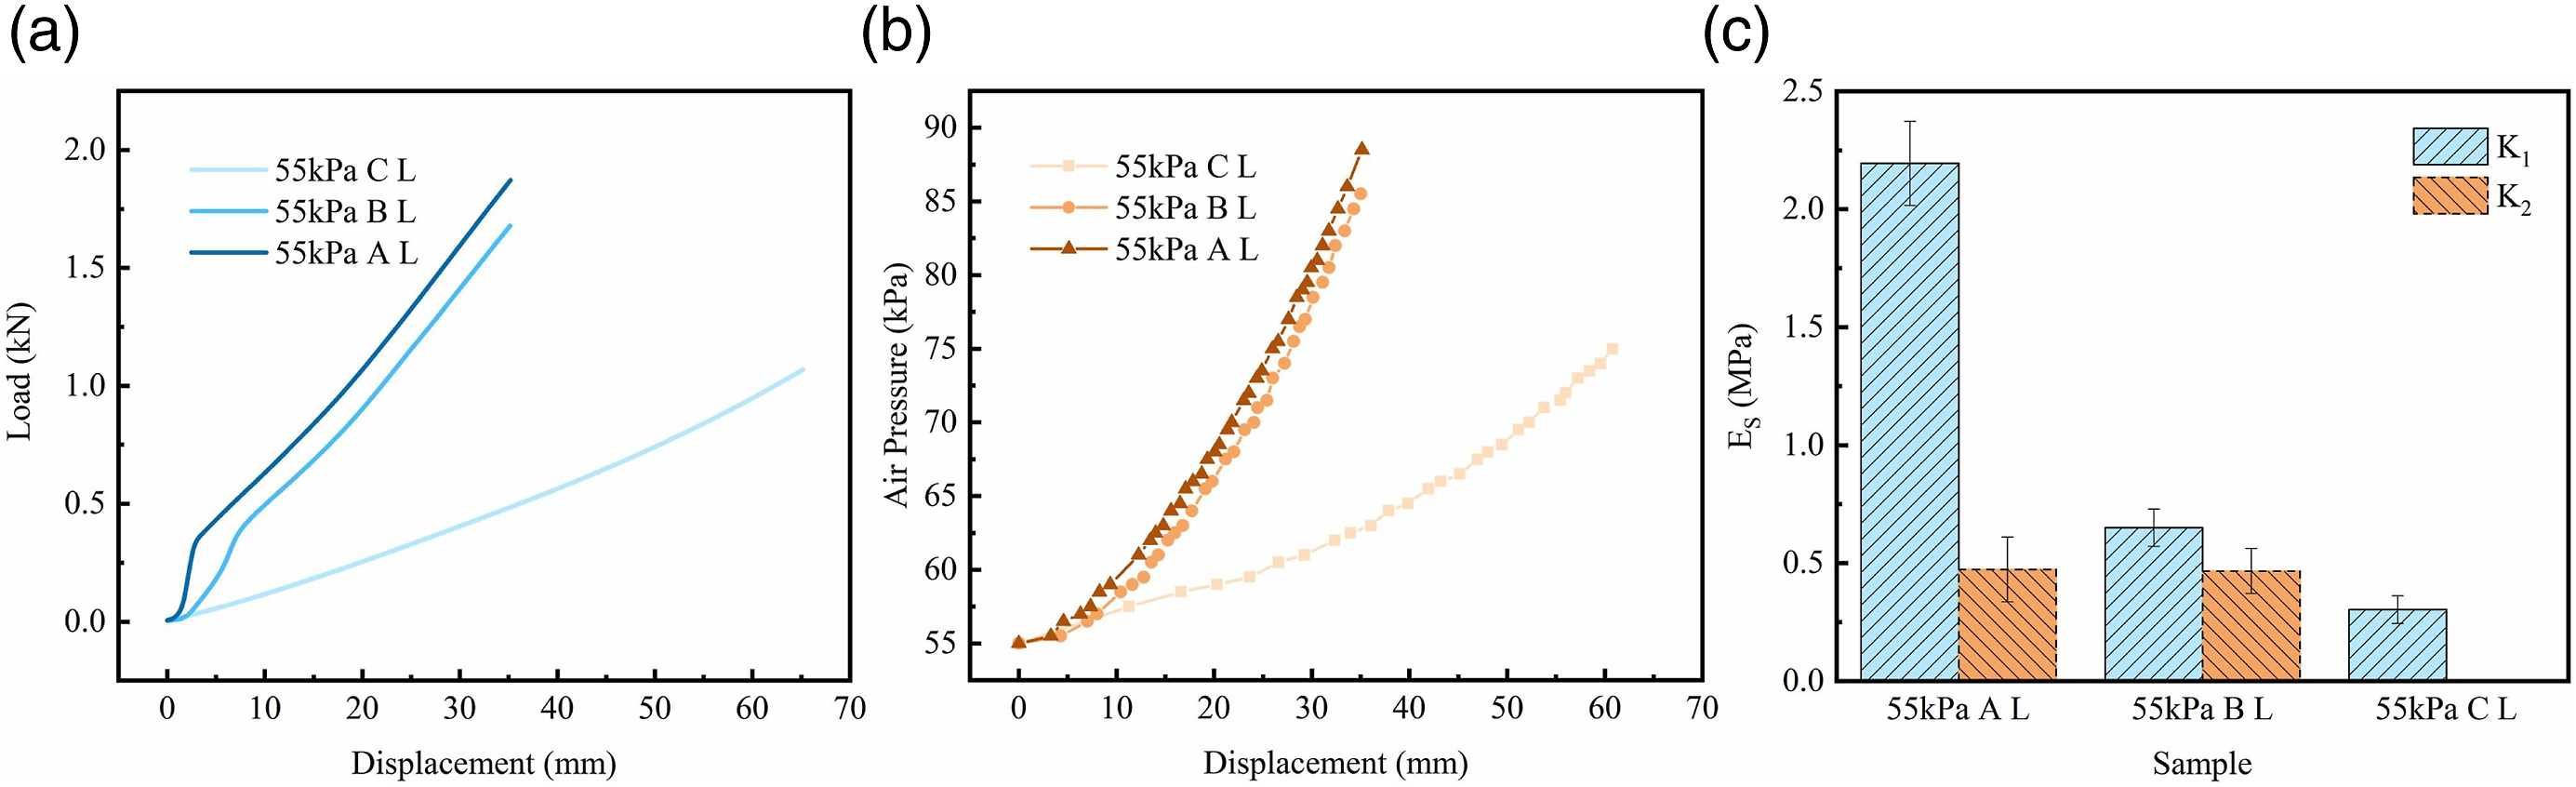
As shown in Figure 7(a), comparing the compressive load-displacement curves of samples A and B, it is found that in the stress transition stage (stage II), the slope of the curve of sample A is larger than that of sample B; at the inflection point from stage II to stage III, The load values of the A and B samples are similar, but the displacement of the B sample to the inflection point is larger than that of the A sample; in the densification stage (stage III), the slopes of the curves of the A and B samples are roughly the same. It shows that within a certain range of spacer yarn density, the HDWSFICs with smaller spacer yarn density can absorb more compression energy. Within a specific load range (load at the inflection point of the second to third stage), the greater the density of the spacer yarn, the greater the stiffness of the specimen, and the smaller the deformation under the same compressive load. After a certain load is exceeded, the stiffness of the HDWSFICs will be slightly affected by the spacer yarn density, which is caused by the lodging of a large number of spacer yarns during the densification stage (stage III). When compressing the same displacement, the compressive force required for the high-density spacer yarn sample is greater, indicating that the spacer yarn shares part of the compressive stress, and the greater the density of the spacer yarn, the more the compressive stress can be absorbed.
As shown in Figure 7(b), in the pressure displacement curve, the slopes and trends of the pressure displacement curves of samples A and B are basically the same. As the displacement increases, the pressure rises faster and faster. With the increase in compression displacement, the pressure rise speed of the C sample is also getting faster and faster, but the slope of the curve is obviously smaller than the pressure displacement curve of the A and B samples. It shows that the volume change of samples A and B is smaller than that of sample C. The existence of spacer yarn significantly enhances the shape retention of the sample, and within a certain range of spacer yarn density, the greater the spacer yarn density, the better the shape retention of the sample.
The modulus values for the different samples at different stages of compression are shown in Figure 7(c). K1 is the modulus value for the stress transition stage (stage II), and K2 is the modulus value for the densification stage (stage III). Sample C had essentially the same modulus throughout the compression process as there were no spacers. The K1 of the different samples were observed, and it was found that the density of the spacer yarns had a significant effect on K1. With the density of the spacer yarns increasing, K1 also became larger; the K1 of sample A was about 4.5 times that of sample C, and the K1 value of sample B was about 1.5 times that of sample C, indicating that the existence of the spacer yarns could greatly enhance the modulus value of stage II. Observing the K2 of different samples, it was found that the density of the spacer filaments had little effect on K2.
Effects of initial air pressure on compressive properties
As shown in Figure 8(a), in the compressive load-displacement curve, it is found that the curve shapes of the three different initial pressure samples are basically consistent with the typical curve shapes, and there are three stages. In the initial contact stage (stage I), the three load-displacement curves are basically the same. However, in the stress transition stage (stage II), the slopes of the three load-displacement curves are slightly different. The higher the initial pressure, the higher the slope. At the inflection points of the second and third stages, the larger the initial pressure is, the larger the inflection point displacement and load are. During the densification stage (stage III), the higher the initial pressure, the higher the slope of the curve. It shows that different initial air pressures have a great influence on the compressive performance of the HDWSFICs within a certain range. The higher the initial air pressure, the stiffer the sample and the higher the required load under the same compression displacement. This is because the set initial air pressure is higher than the standard atmospheric pressure. Before the compression test, the inner spacer yarn is in a stretched state, and the PVC film also bears a certain amount of tension. Prior to compression testing, spacer yarn and membrane tension increase with increasing initial air pressure. Compression data graphs for different initial air pressures: (a) Compressive load-displacement curves; (b) Internal air pressure - displacement curve; (c) Compression modulus values for different samples.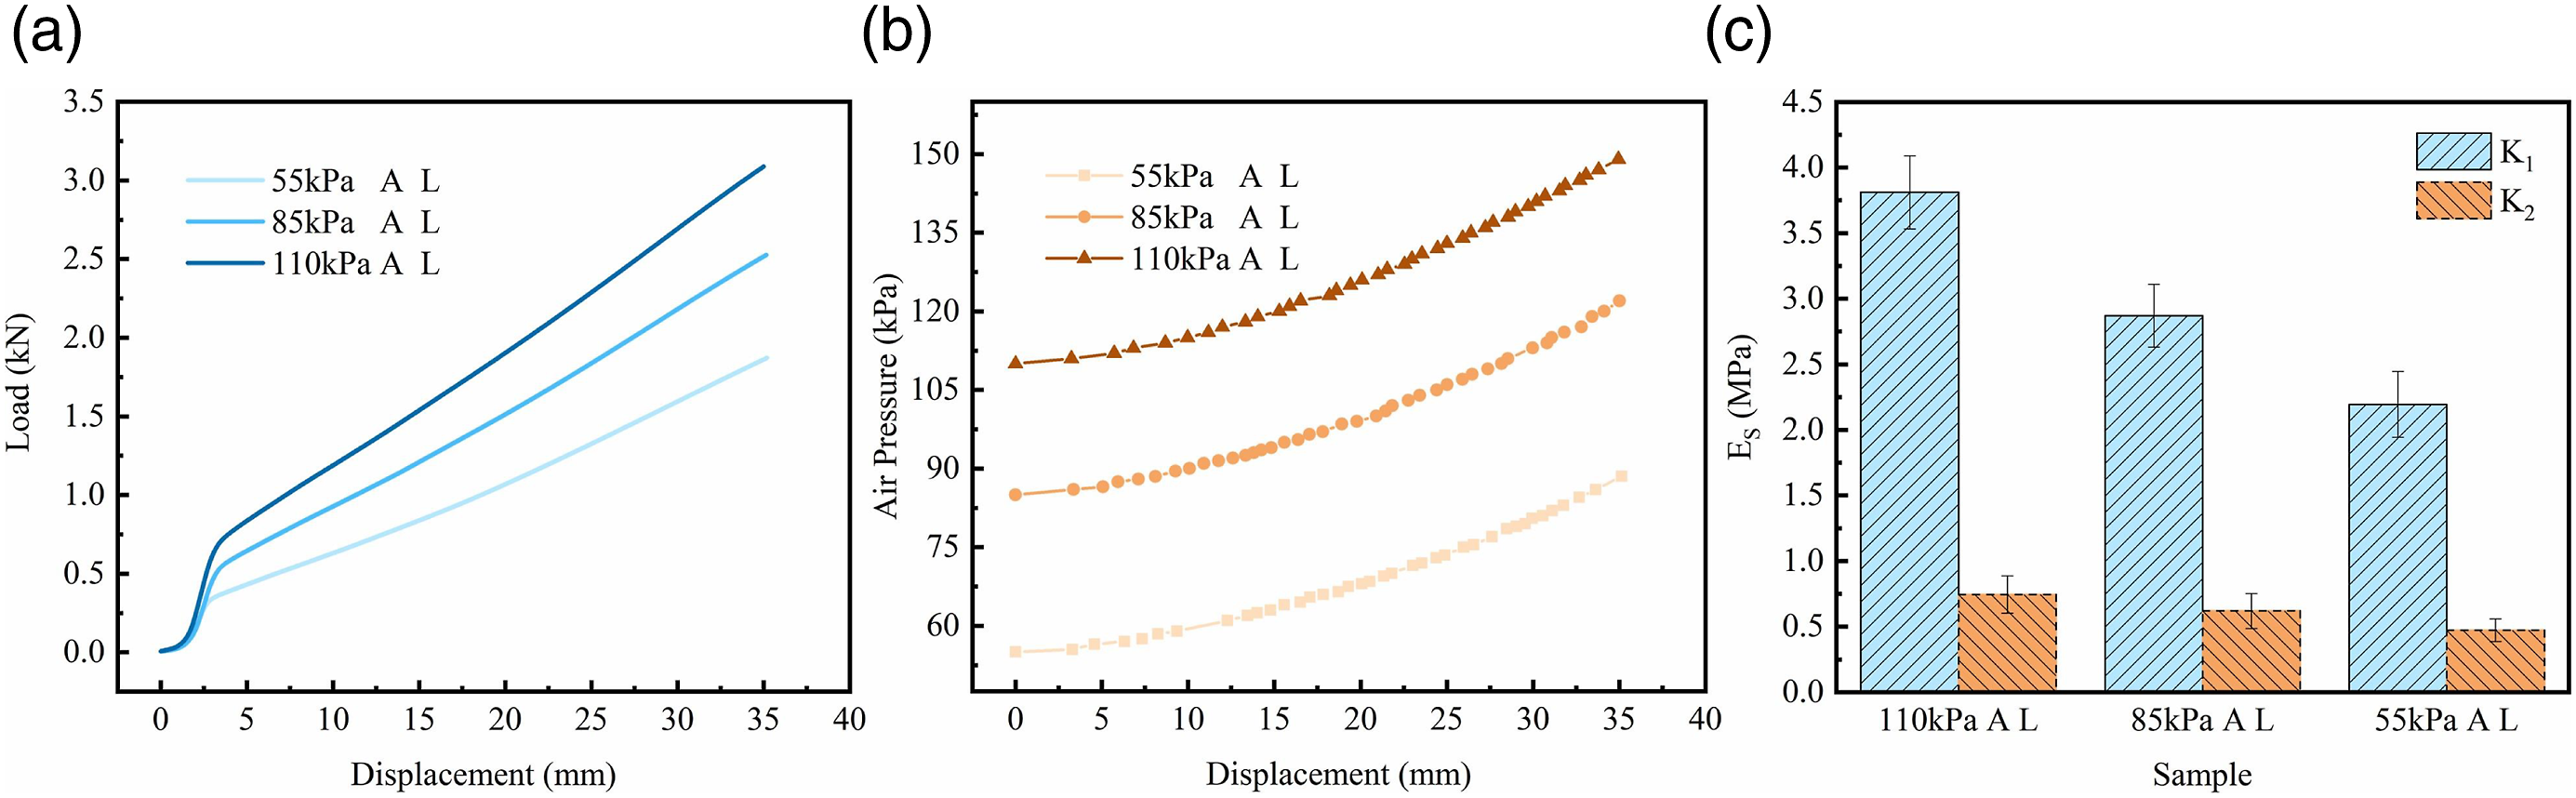
As shown in Figure 8(b), in the pressure displacement curve, the pressure displacement curves of three different initial pressures have almost the same trend. As the displacement increases, the pressure rises faster and faster, and the curve slopes are almost the same, like three parallel curves. It shows that the shape retention of the samples with different initial pressures is basically the same, and the changes in the internal pressure with the compressive displacement are almost the same.
As shown in Figure 8(c), the modulus values of different samples at different stages of compression are shown. K1 is the modulus value at the stress transition stage (stage II), and K2 is the modulus value at the densification stage (stage III). The K1 of the different samples was observed, and it was found that the initial air pressure also had a certain influence on the K1. K1 increased with the increase in the initial air pressure, but the change in K1 was not as influential as the density of the spacer yarns, indicating that the density of the spacer yarns was the main factor affecting the modulus value of stage II while the initial air pressure was a subfactor. Observing the K2 values of different samples, it was found that as the initial air pressure increased, K2 also increased, indicating that the initial air pressure was the main factor influencing the modulus values of stage III.
Effects of pressure area on compressive properties
As displayed in Figure 9(a), in the compressive load-displacement curve, it is found that the curve shape of the three different compressive contact area samples is basically consistent with the typical curve shape, and there are three stages. In the initial contact stage (stage I), the three load-displacement curves are basically the same. However, in the stress transition stage (stage II), the larger the compressive contact area, the larger the slope of the curve. At the inflection points of the second and third stages, the inflection point displacements of the samples with different compressive contact areas are roughly the same, but the larger the compressive contact area, the greater the load at the inflection point. During the densification stage (stage III), the larger the compressive contact area, the larger the slope of the curve. It shows that the compressive contact area of different sizes also affects the compressive performance of the HDWSFICs within a certain range. The larger the compressive contact area, the greater the required compressive force under the same displacement. Compression curves under different pressure areas: (a) Compressive load-displacement curves; (b) Internal air pressure - displacement curve.
As shown in Figure 9(b), in the pressure displacement curve, the trends of the pressure displacement curves of the three samples with different compressive areas are basically the same. The internal pressure of the indenter is the largest, the internal pressure of the wooden indenter of size M is the second, and the internal pressure of the wooden indenter of size S is the smallest. This is because when compressing the same displacement, the volume of the wooden indenter of size L is the largest, and the wooden indenter of size L is the largest. In the end, the size S wooden indenter is the smallest.
Conclusions
In this study, the compressive properties of HDWSFICs were parametrically investigated, and the stress transformation mechanism of the HDWSFICs has been experimentally studied for the first time. According to the experimental results and analysis, the following conclusions can be drawn: 1. The stress transformation mechanism of HDWSFICs: When the inflated HDWSFICs is subjected to external compression force, the spacer yarns in the HDWSFICs are visibly stretched, resulting the external force is transformed into the tension force exerted on the spacer yarns and the membrane, which in turn transforms the local force into the overall force. Thus, HDWSFICs can bear large compressive stresses with small deformation. 2. From the load-displacement curves, it can be obtained that the slope of the curve changed obviously in the second stage due to the stress transform phenomenon in the local compression process. This demonstrates that using high-distance woven spacer fabric as the reinforcement of inflatable composite not only has excellent mechanical strength, but also can make fully utilize of the tensile properties of the spacer yarn to improve the stability of the component structure. 3. Within a certain range, it is concluded that the modulus of the sample can be enhanced with the increasing initial inflation pressure and spacer yarn density. Which illustrates that, the HDWSFICs have variable stiffness performance and good designability. The reported results may provide some guidance for designing more suitable HDWSFICs in engineering applications.
Supplemental material
Supplemental Material - Compressive properties investigation of “stress transformer” based on high-distance woven spacer fabric design
Supplemental Material for Compressive properties investigation of “stress transformer” based on high-distance woven spacer fabric design by Ying Zhao, Yaming Jiang, Rong Jian You, Yuanjun Liu, Yong Zhao Dong, Chao Wen Li and Wei Dai in Journal of Industrial Textiles
Footnotes
Declaration of conflicting interests
The author(s) declared no potential conflicts of interest with respect to the research, authorship, and/or publication of this article.
Funding
The author(s) received no financial support for the research, authorship, and/or publication of this article.
Supplemental Material
Supplemental material for this article is available online.
References
Supplementary Material
Please find the following supplemental material available below.
For Open Access articles published under a Creative Commons License, all supplemental material carries the same license as the article it is associated with.
For non-Open Access articles published, all supplemental material carries a non-exclusive license, and permission requests for re-use of supplemental material or any part of supplemental material shall be sent directly to the copyright owner as specified in the copyright notice associated with the article.