
Abstract
The mechanical properties of yarns have a decisive effect on the performance of fiber-reinforced composite materials. Predictive simulations of the mechanical response of yarns are, thus, necessary for damage evaluation and geometric reconstruction of textiles. This paper proposed a quasi-fiber scale virtual modeling method regard to the axial tensile and transverse compressive behaviors of the twisted yarns. A stochastic properties model of the yarn was established for characterizing the statistical distribution of tensile strength. The variation of modeling parameters, including coefficient of friction, the amounts of virtual fibers per yarn and element length, versus calculation accuracy has been determined based on axial tensile and transverse compressive behavior of quartz fibers. The relationship between modeling parameters and mechanical behavior of yarn was established within the scope of this study. Axial tensile and transverse compressive behavior of yarns with different twists were predicted. The results show that balance between the modeling precision and computational efficiency can be achieved using the parameters, the COF of 0.35, virtual fiber count of 122 and Le of 0.3. This efficient modeling method is meaningful to be developed in further virtual weaving research.
Keywords
Introduction
Fiber-reinforced composites have been widely used in aerospace, aviation, maritime, biomedicine, and infrastructure, due to their excellent mechanical properties, structural designability and fatigue resistance.1–3 The study of mechanical properties of fiber-reinforced composites has become a hot topic.3–5 As a vital part of fiber-reinforced composites, the mechanical behavior of the yarn will significantly disperse the mechanical properties of the composite, such as tensile, compression and bending.6–8 Therefore, some methods for the evaluation of yarns performance are needed to develop fiber-reinforced composites with higher specific strength and specific modulus. Lamon et al. 9 investigated the flaw strength distributions of various fiber types and constructed empirical distributions of flaw strength that allow the evaluation of Weibull plot and Maximum Likelihood Estimation methods as functions of sample size and composition. Wang et al. 10 proposed an analytical model based on statistic theory to demonstrate the stochastic tensile properties of natural fiber yarns by defining crimp strain of fibers and effective elastic modulus of yarns as stochastic variable of damage indicator. A simple mechanical approach to reproduce the evolutions of width and thickness of E-glass and carbon tows during through-thickness compaction was experimentally proposed by Hemmer et al. 11 The above scholars established an analytical model applied to fiber/yarn combined with the experimental conclusions.12–14 In addition, the structure of the yarn changes during its stretching and compression. Hence, understanding and predicting the tensile and compressive behavior of yarns is crucial step for composite molding research.15,16
Based on an advance in yarn material analytical model above, a numerical simulation model based on the analytical model was gradually established. Generally, existing numerical simulation models are established by digital element, truss element and beam element. 17 Zhou et al. 18 extended a digital element approach (DEA) (developed by Wang et al. 19 in 2001) to fiber‐level, named multi‐chain digital element method. In this model, each yarn was defined as an assembly of fibers and each fiber is represented as a digital chain. Daelemans et al. 20 developed a yarn model with truss element, which can predict the mechanical response of the fabric by considering the sub-yarn behavior without the requirement for complex constitutive laws. Moustaghfir et al. 21 used a finite strain beam model to represent each fiber of the roving, focusing on studying the influence of the roving twist, tensile force and friction coefficient on the compressive behavior. These three modeling methods allow for simulation analysis and prediction. Nevertheless, the bending moments are not available in the digital element and truss elements. The beam elements with bending stiffness can realize the simulation analysis in which the contact interaction and squeezing deformation of the yarns cannot be considered under complex mechanical behavior.
To acquire a more accurate model, the internal geometry of the model was compared with Micro-CT images. Xie et al.22,23 proposed a numerical simulation of the weaving process for understanding the fiber architectures of textile composites and used Micro-CT technology to validate the accuracy of the virtual fiber structure. Few studies have focused on the mechanical behavior of yarns by numerical simulation method, except for amounts of research that established the mechanical relationship between yarn and fabric. Daelemans et al. 20 described a solution that enables predict compression simulations through hybrid virtual fibers, the compression of a woven fabric ply is simulated and experimentally validated by the Micro-CT. The high precision models of yarns can be generated using the above methods. However, a more realistic yarn model needs to take into account the damaged properties. In the previous work of Xie,24,25 the virtual fiber modeling method was used to simulate the needling process of a quartz fabric layer, where fiber deformation and damage were involved. However, the mechanisms of damage and deformation of yarns which highly depend on several fiber-level interactions which are related to COF (coefficient of friction), especially twisted yarns, have not been adequately explained.
In present study, the yarns were modeled by a flexible chain consisting of beam elements (B31 elements in Abaqus software) based on Micro-CT reconstruction results. A constitutive model with stochastic damage properties was applied according to the Weibull distribution. The axial tensile and transverse compressive behavior of the yarns were then simulated by applying appropriate displacement boundary conditions on the end of the yarns in explicit solver Abaqus\Explicit, meanwhile, the coefficient of friction, amounts of virtual fibers per yarn and element length were considered. An image analysis method was used to validate the accuracy of the yarns model. Indeed, the geometric deformation and mechanical behavior of yarns with different twists were predicted under specified boundary conditions. This modeling method provides a helpful tool for understanding the mechanical response of yarns.
Material and Experiments
Material
Parameters of yarn samples for axial tensile and transverse compressive tests.

Tensile and compressive tests
Tensile tests of yarn samples were carried out according to ISO 2062 (1993) standard on SHIMADZU (AGS-J 1 kN) test machine, as shown in Figure 1. The gauge length of the samples was 500 mm. The sample applied a pre-tension force of 30.0 ± 1.5 mN/tex and the loading rate was 200 mm/min. The compressive tests were conducted on a Bruker UMT TriboLab machine equipped with a 100 N load sensor. The yarn sample was subjected to compressive load between two platens (with the size of 50 × 30 mm2) at the rate of 1 mm/min. Twenty samples were tested in each group, during the tensile/compressive load and deformation were recorded. Mechanical tests of yarn samples: (a) Axial tensile test and (b) transverse compressive test with pre-tension.
The Micro-CT observation
The Micro-CT technology was employed to observe the deformation of the yarns during the compression, as shown in Figure 2. A P2-T150 compressed sample with a length of 50 mm was scanned by an X-ray CT test (Xradia-510 versa, Zeiss). The X-ray source emitted a cone-beam which passed through the sample and was then absorbed by the receiver platen. The radiographs were acquired with a voxel size of 5 μm, beam energy of 50 kV and a current of 80 μA. A total of 1130 projections were acquired and then stitched for the image reconstruction. The reconstructed images were imported into Dragonfly software (version 2020.1, Object Research Systems (ORS) Inc.) for segmentation, 3D visualization, and quantitative analysis. The micro-CT test of yarn sample under compression: (a) compression test, (b) yarn sample with platens and (c) Micro-CT test.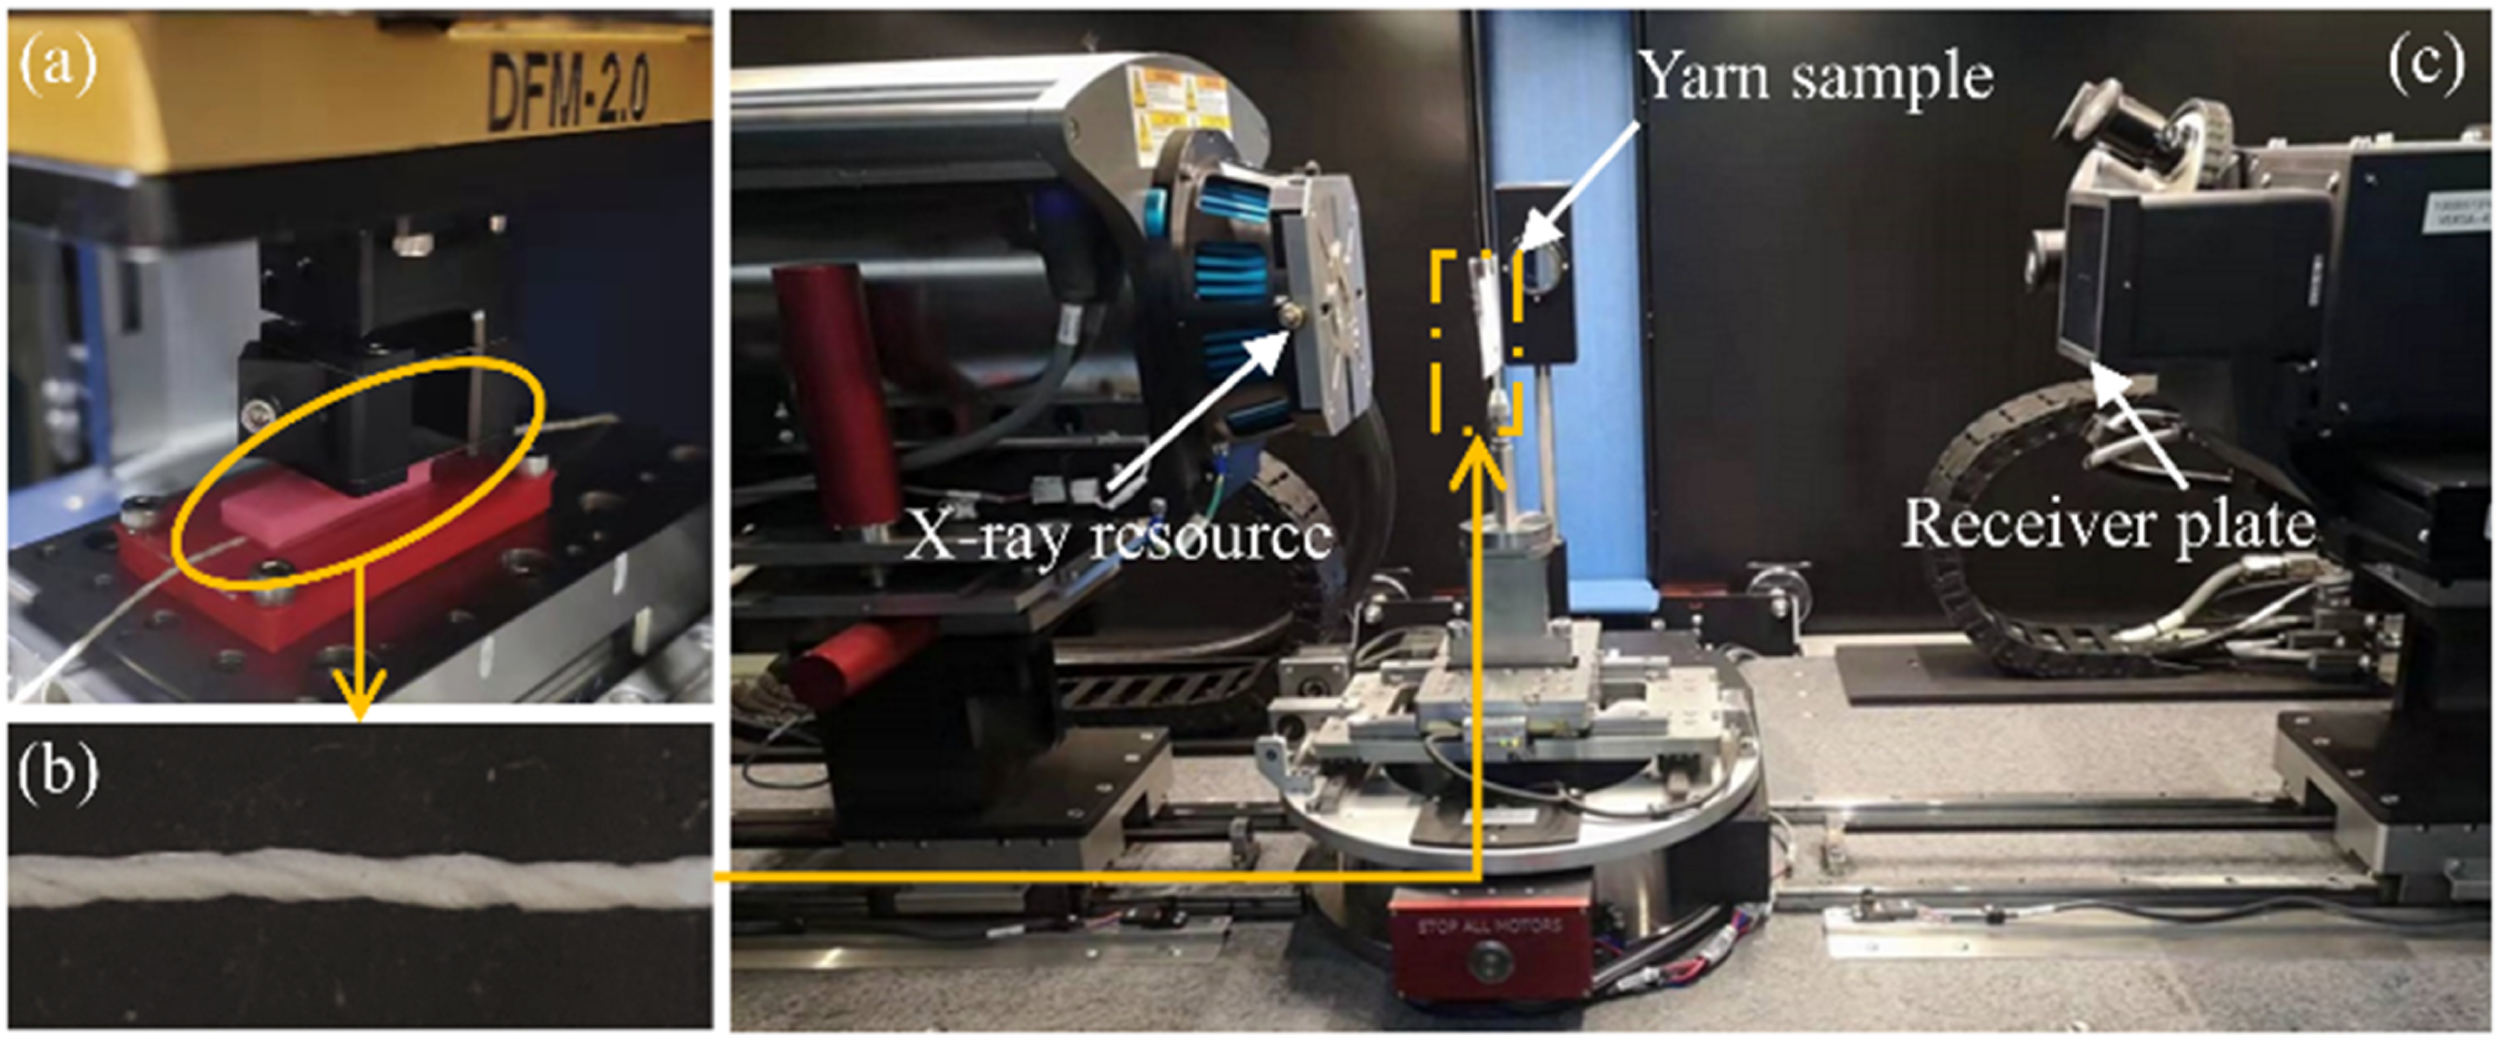
Image processing methods were utilized to observe internal details of yarn, whose key are about parameters adjustment of images. The grayscale value refers to the brightness of a single pixel, which can clarify the volume of interest. The estimated grayscale threshold was set at the beginning of reconstructed image processing to extract the volume of interest from the whole volume, which contained a gray value distribution of the air (voids), platens, and yarn. The accurate grayscale threshold (35,209–57,825) was obtained from the whole volume (0–65,535) using the histogram tool in the Dragonfly software.3,4
Virtual fiber and virtual yarns modeling
Geometry and property models
The geometric of yarns are determined by fiber arrangement at the quasi-fiber scale.21,26 In this paper, the virtual yarn was used to model the mechanical behavior of the realistic yarn. The virtual fiber is modeled by a chain of beam elements in the Abaqus software. A certain number of virtual fibers with twist angle is assembled to form a twisted yarn using the Python script and running on the Dell workstation (Precision 7820 Tower) by the following equation. As shown in Figure 3(a), large number of beam elements constitute a virtual fiber. The equations (1) and (2) reflect the constraint relationship between beam nodes. Modeling method: (a) The virtual fiber and (b) virtual yarn.


Towards exploring a more accurate mechanical response of yarn, the properties with Weibull distribution need to be assigned to each virtual fiber based on the stochastic distribution algorithm.
5
The factors with Weibull distribution of fibers -scale and shape factor-are obtained from research,9,10,26–28 probability of fiber can be obtained by equation (4).
Damage model
Based on previous research,29–31 the fiber and yarn are considered to be transversely isotropic homogeneous materials, and the damage model of the fiber is the same as that of the yarn. Initially, the yarn damage is considered to be elastic due to no significant plastic deformation. Once the ultimate strength is reached, the progression of damage is characterized by material stiffness degradation. The damage process may be explained using the damage variables as internal variables. Herein, we use the Matzenmiller damage tensor and continuum damage mechanics (CDM) theory to calculate the stiffness degradation for yarn. The expressions of the damaged and undamaged constitutive relations for yarn are as follows

The damage initiation criteria for yarns are respectively formulated as
The exponential damage degradation model (Figure 4(a)) is adopted. A linear and exponential damage evolution model (Figure 4(b)) is utilized for the longitudinal stretching of yarns. The damage factors of yarns can be expressed as Correlation analytical models: (a) the exponential damage evolution law, (b) the linear and exponential damage evolution law and (c) Weibull distribution of yarn.


The detailed derivation process of damage evolution equation can be referred to the literature.31–35 The above damage model is carried out by user subroutine VUMAT of Abaqus.
The Weibull distribution law of yarn was compared by simulation and experiment in Figure 4(c). The Weibull distribution of yarn showed a good agreement between the experimental and simulated result, which means that the assumption of the fiber Weibull parameter is appropriate.
Contact penetration of virtual fiber
The interference between the virtual fiber surfaces and their surroundings occurs frequently and is connected to contact, which will cause the virtual yarn model to deform under the mechanical effects of prominent level as revealed in Figure 5(a). Most researchers36–38 investigated virtual fiber contact by the general contact algorithm implemented in Abaqus/Explicit, which is immensely powerful at detecting colliding/contacting surfaces for beam elements. However, the penetration problem is challenging for a conventional “Hard” contact formulation, which should be replaced by penalty contact to enforce the contact constraints for quasi-fiber scale modeling. The penalty stiffness is automatically set by software. Therefore, based on research,
39
contact between the virtual fiber and their surroundings (other fibers or compression platens) is imposed on the beam elements only and is defined by penalty contact in this paper. Some specific values have proven sufficient to prohibit penetration in Figure 5(b). Effect of the element contact between neighboring fibers using (a) ‘Hard’ contact and (b) penalty contact.
Axial tensile and transverse compressive modeling
A quasi-fiber scale model of yarn tensile simulation was established in Abaqus/Explicit. The diameter of the realistic fiber is 7.5 μm and the calculated cross-sectional area is 44.2 μm2. The effective cross-sectional area of the realistic yarn is 0.0864 mm2 (approximate to).40,41 As a result, the realistic yarn contains about 2000 fibers per ply. According to the accuracy and computational efficiency of the model, appropriate amounts of virtual fibers, element length and coefficient of friction are used (see Identification of modeling parameters). The nodes at the start and end of the geometric model are coupled to points RP-1 and RP-2, which are applied same boundary condition with experiment. The coupling point RP-1 is fixed, while the RP-2 experienced deformation increased with a constant velocity, as illustrated in Figure 6(a). Boundary condition of (a) axial tensile simulation and (b) transverse compressive simulation (displacement controlled).
The simulation of compression behavior is performed under quasi-static conditions in Abaqus. The compression is simulated using two Dynamic/Explicit steps by two rigid platens (Rectangle 30×50 mm2, rigid shell elements R3D4), which move (displacement-controlled) towards yarn in between with the pre-tension in Figure 6(b). In step-1 the pre-tension was applied, while in step-2 the rigid platens moved to set displacement. The period of the two steps was both 0.5 s. To achieve balance between the modeling precision and computational efficiency and ensure the convergence of the simulation, it is necessary to use mass scaling to increase the mass of the model artificially. During the analysis, a fixed mass scaling factor of 100 was introduced to the virtual fiber model. The distance between two platens is consistent with the experiment. The displacement boundary conditions z = 0 mm was applied in step-1, and z = 0.5 mm was applied in step-2 in compression process. Similar to the tensile model, the boundary conditions are applied at the coupling point. During compression of the yarn, the reaction forces on the platens and the distance between them are used to characterize compressive behavior of yarn.
Results and discussion
Identification of modeling parameters
Each yarn comprises thousands of fibers, whose interaction is affected by COF input value. Indeed, the mechanical behavior of yarn will be directly affected. However, as the difference in the number of fibers and arrangement style, a yarn model with realistic COF is inappropriate. Re-determining the COF and fiber amount (the volume fraction is consistent) of yarn model are necessary. Besides, decreasing beam element length can enhance the yarn model more accurate, increasing the computational efficiency. Therefore, a balance between modeling precision and computational efficiency must be achieved.
Coefficient of friction
Specific frictional constant allowed in the general contact algorithm of the Abaqus/Explicit solver, which determines the interaction between all surfaces. 42 It is inaccurate to blindly use the COF, which was measured as the input of simulation. This is due to fact the fibers in realistic yarn are not parallel and straight, which results in potential contact surfaces. A P2-T150 yarn model was established to analyze the effect of different COF on the tensile and compressive response of the simulated yarn in this paper.
The tensile response of P2-T150 yarn simulation with COF - 0.2, 0.35, 0.6 and 0.8 are shown in Figure 7(a). The load is almost unchanged when the COF increases from 0.2 to 0.8 during the tensile test. In addition, the ultimate load has no significant effect on COF. It is because the friction between the fibers increases gradually as the COF increases under the same normal forces, which is far less than the ultimate load of the yarn. Effect of modeling parameters on the tensile simulation results: (a) coefficient of friction (b) amounts of virtual fibers and (c) element length.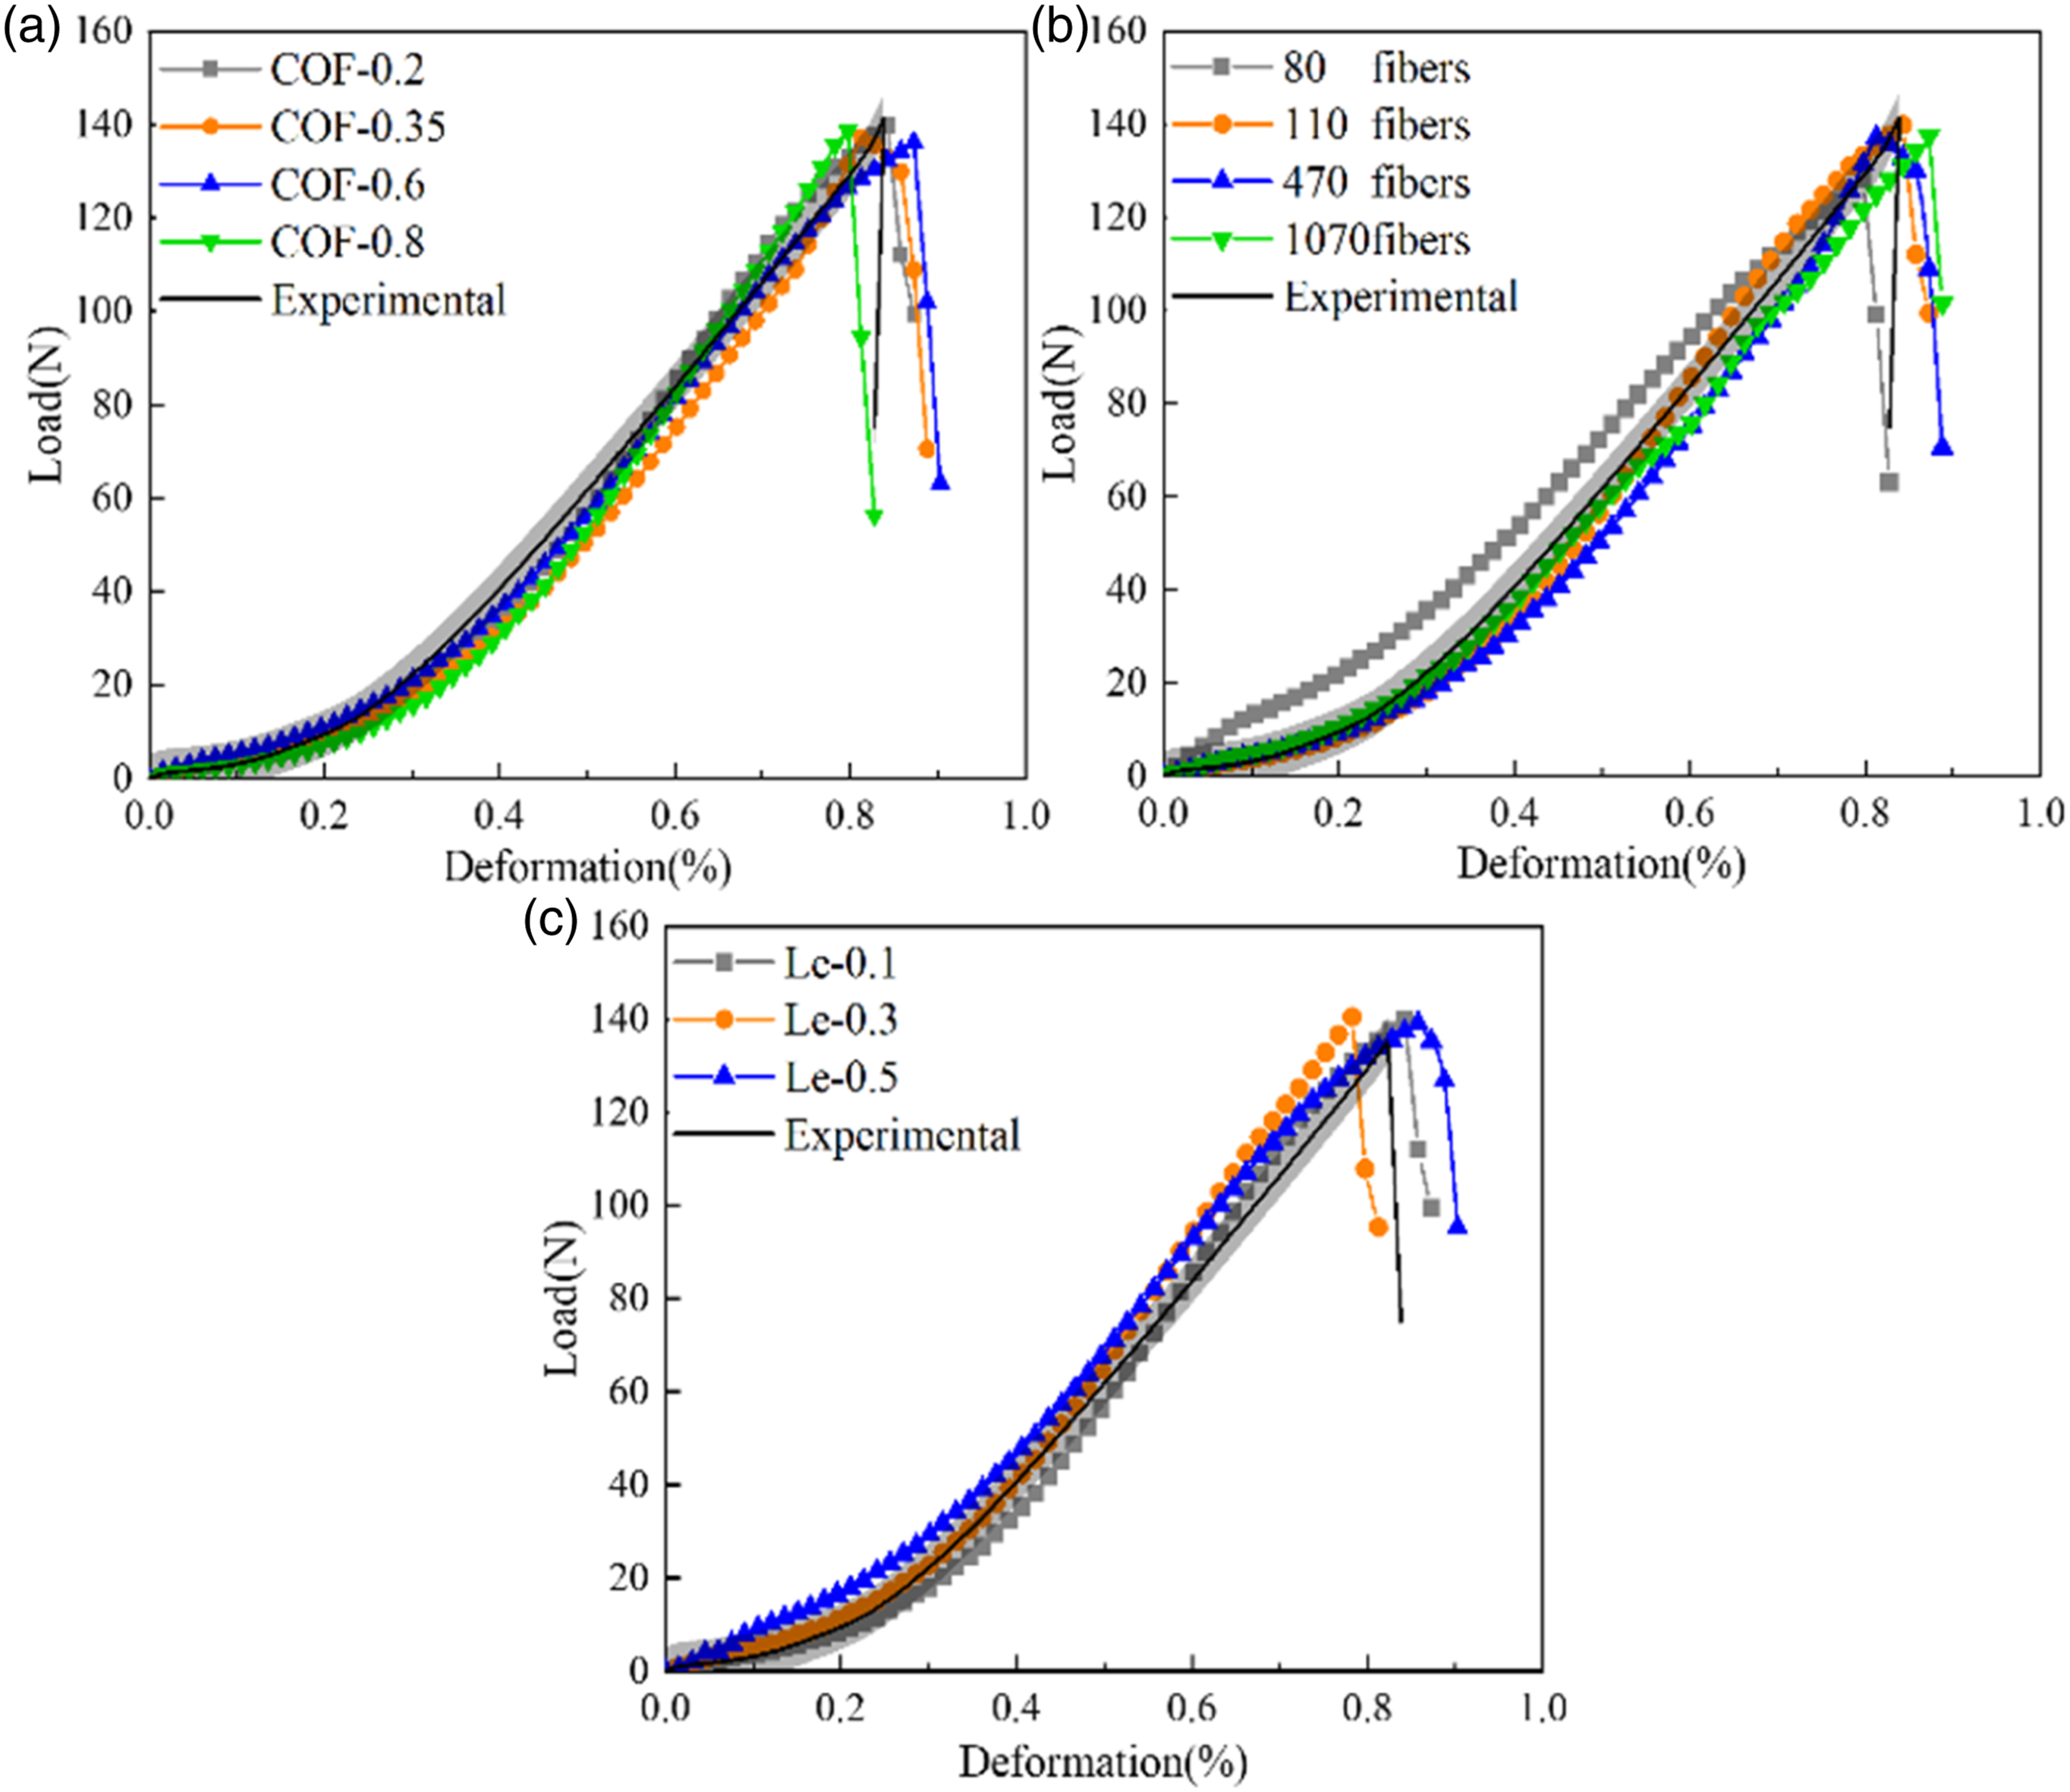
Similar to the tensile simulation of yarn, the compression responses are analyzed for a range of COF from 0.2 to 0.8, see Figure 8(a). The result shows the model with greater COF is subject to more significant compression load at the same platen displacement. Indeed, the difference between COF - 0.6 and COF - 0.8 is slight. The compression simulations of COF - 0.2 and COF - 0.35 are in good agreement with the experiment. Similarly, As the arrangement has not yet achieved steady (high volume fraction), the compressive load with different COF is same at platen displacement from 0 to 0.2 mm. When the platen displacement increased to 0.2 mm, the compressive load started to change. The amplitude of compressive load with COF - 0.8 is small when the platen displacement from 0.2 to 0.4 mm. As the platen displacement continues to increase, the compressive load is larger than the fiber friction force, and the friction force is weakened, resulting in a sharp increase in the compressive load. However, the realistic COF tends to be lower than the COF obtained by the simulation due to the influence of the contact area and arrangement of the fibers. Generally, two values of 0.35 and 0.2 are appropriate to simulate the compression behavior. Effect of modeling parameters on the compression simulation results: (a) coefficient of friction (b) amounts of virtual fibers and (c) element length.
Virtual fiber count per yarn
The virtual fibers number of per yarn affects the “fineness” of the simulation. Indeed, more virtual fibers would better represent the realistic behavior of yarn due to the increased accuracy of the yarn structure. In this paper, the tensile simulation of yarn with 80, 110, 470 and 1070 virtual fibers are carried out in Figure 9, which are about 25, 18, 4.3 and 2 times of realistic yarn, respectively. The tensile simulations with 110, 470 and 1070 virtual fibers closely agree with the experiment, as shown in Figure 7(b). The tensile simulations with 110, 470 and 1070 virtual fibers took about 31, 52 and 107 min of calculation time on the Dell workstation (Precision 7820 Tower). Hence, taking into account calculation efficiency, the model of 110 virtual fibers is more suitable for tensile simulation than other parameters. Effect of virtual fiber amount on the simulation results (pre ply): (a) 80 fibers, (b) 110 fibers, (c) 470 fibers and (d) 1070 fibers.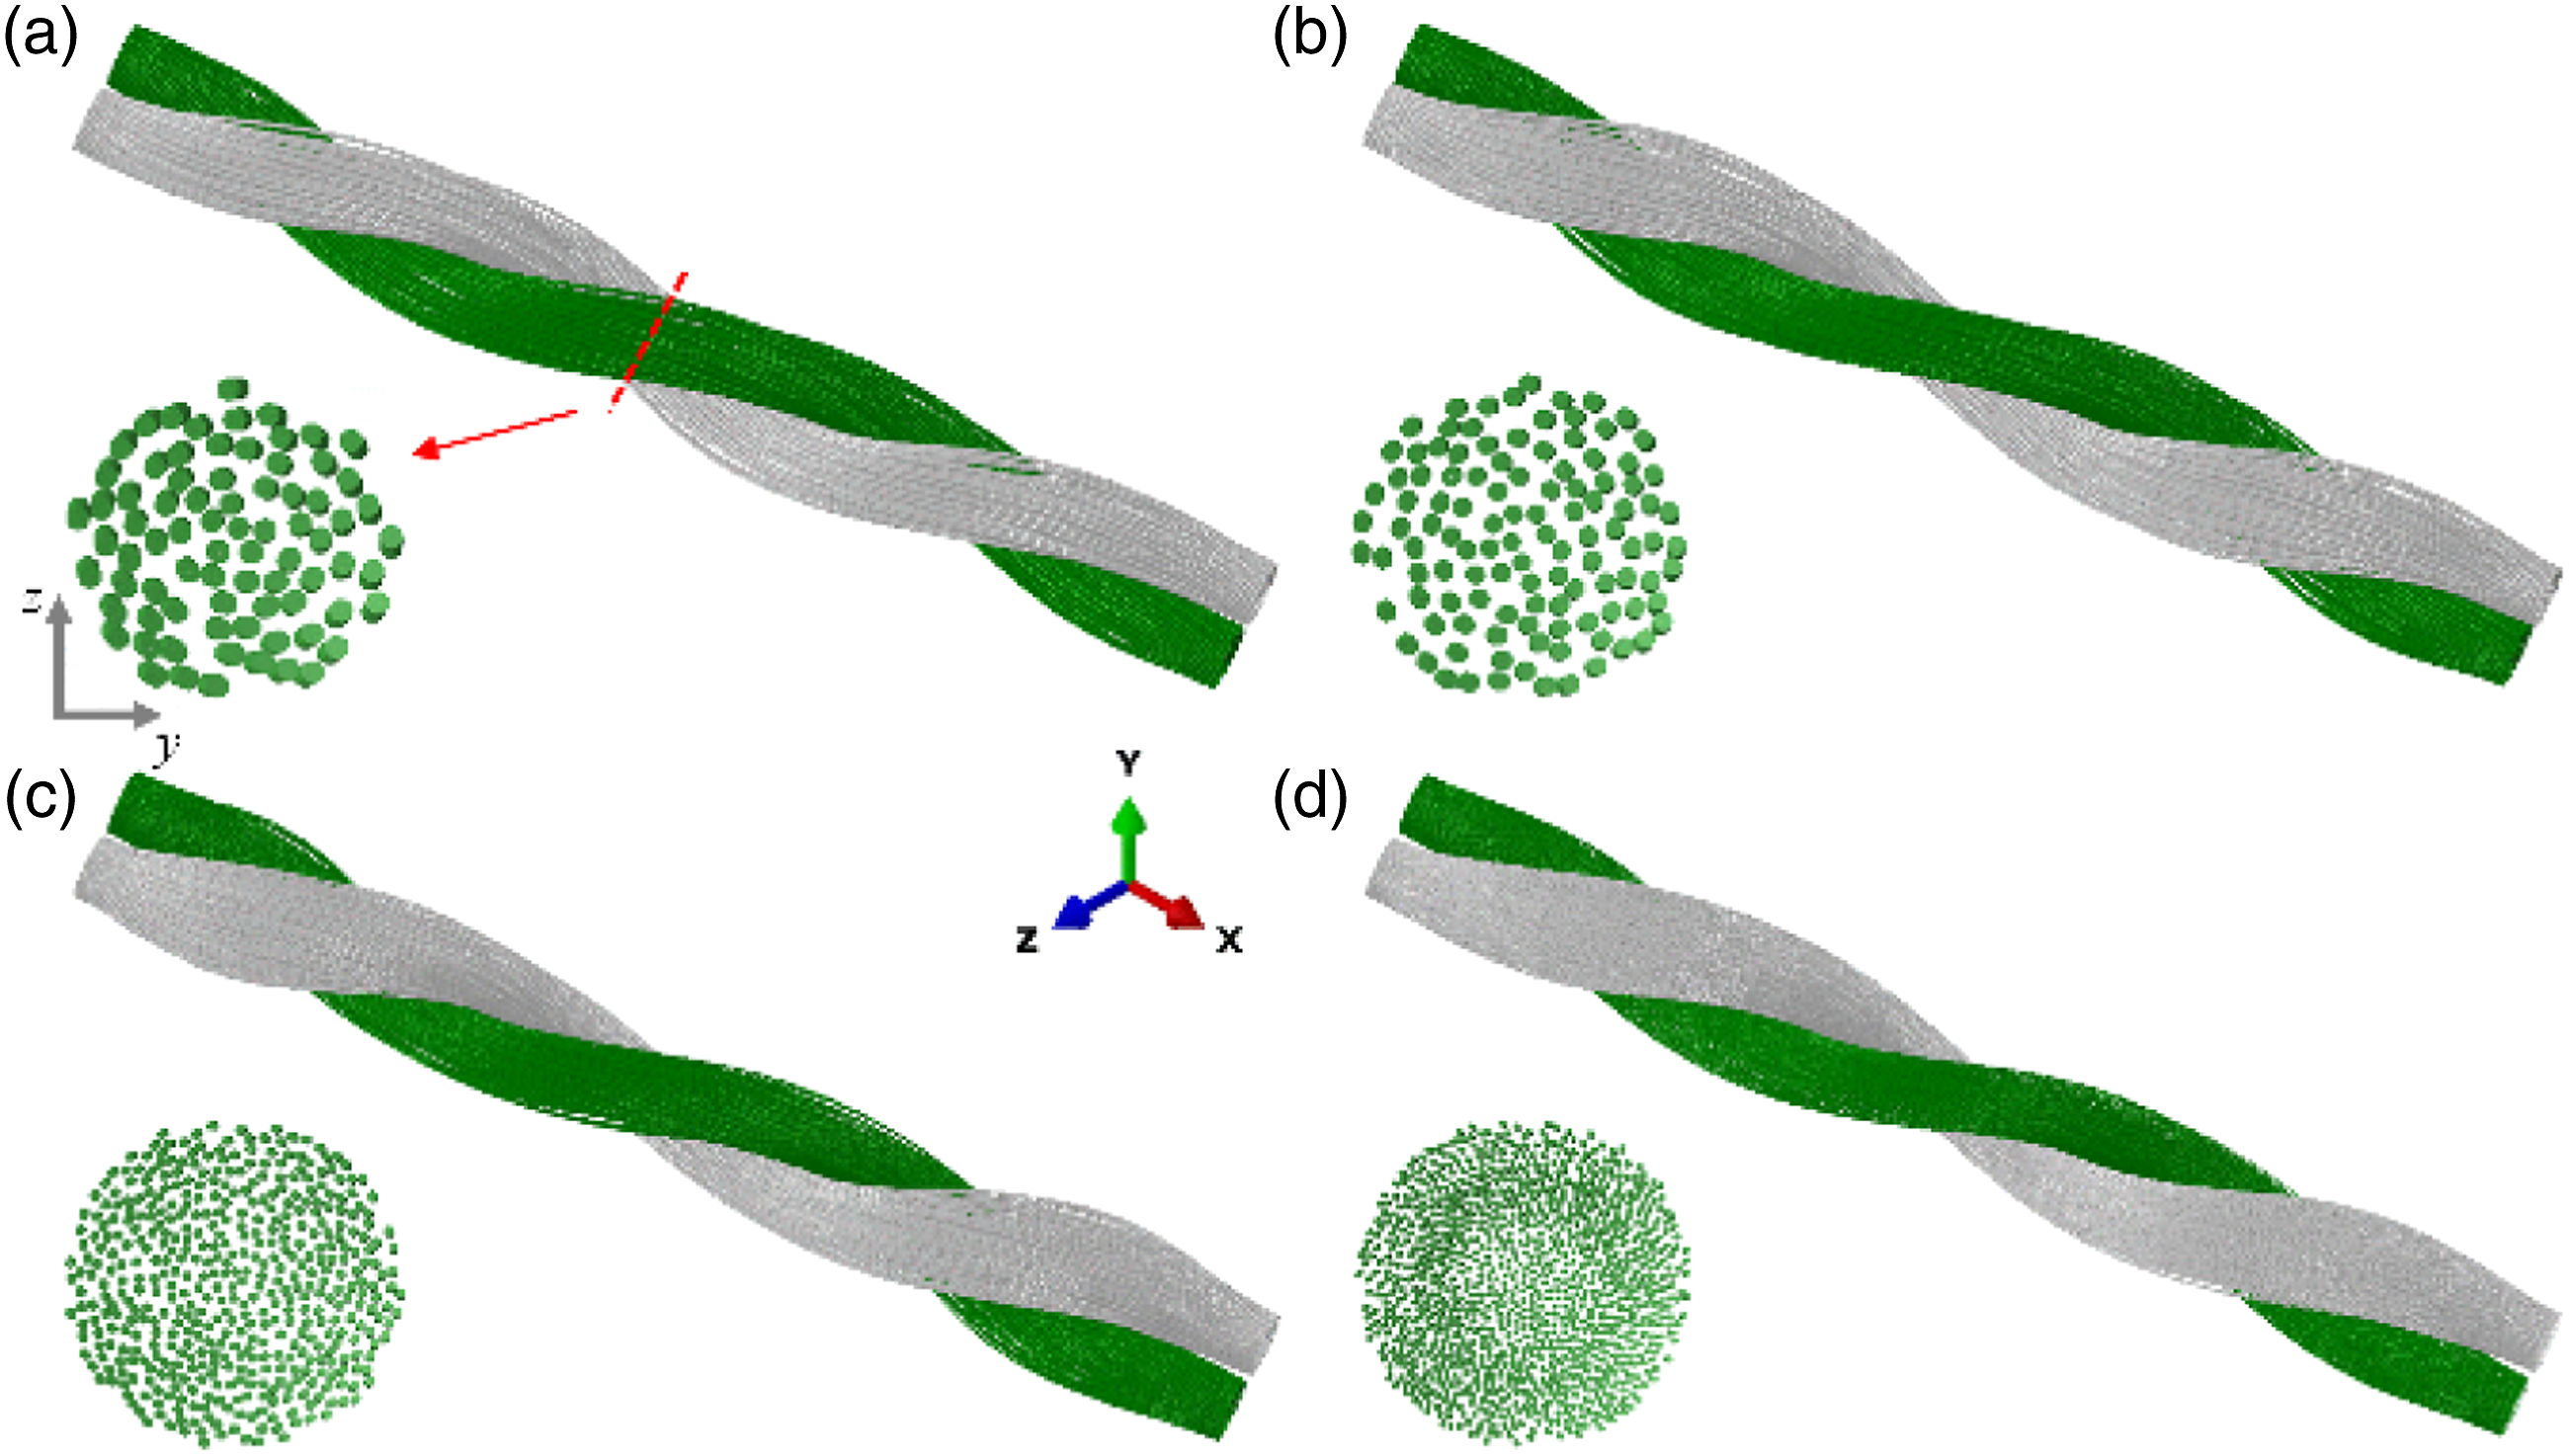
The consistency of compression response between simulation and experiment determined is superior, especially in more virtual fibers models (110,470 and 1070). It indicates that the compaction process is well characterized by the virtual fiber modeling method, even though there are differences between different virtual fiber models. The compression response with the different number of virtual fibers is highly nonlinear, the same as that with different COF, as shown in Figure 8(b). Theoretically, Compression simulation with more virtual fibers is consistent with the experimental results. However, considering the influence of the computational efficiency and accuracy, the model with 110 or 470 virtual fibers will be accepted for compression simulation as the best compromise.
Element length
The geometric models of the P2-T150 yarns are generated using three different beam element lengths (Le), Le - 0.1, 0.3 and 0.5 mm in this paper. It can be found that the yarn trajectory is relatively rough (which looks like straight line segments, see Figure 10), even though longer elements can reduce computational efficiency. Effect of element length on the simulation results: (a) Le - 0.1 mm (b) Le - 0.3 mm and (c) Le - 0.5 mm.
The tensile simulation of yarn with different element lengths was established in Figure 7(c). The load is transmitted along the axial of the fiber, and the length of element does not affect the mechanical behavior. Hence, it is vital to decrease computational efficiency for tensile simulation of yarn. It took 56, 31 and 18 min to simulate the tensile behavior of Le - 0.1, 0.3 and 0.5 mm, separately. The best compromise between computational efficiency and accuracy can be achieved using the model with a beam element length of Le - 0.3 mm.
The compression behaviors of three element lengths were simulated in Figure 8(c). Similar to other parameters analyses, the platens distance is gradually increased, and the mechanical response of the yarn is highly nonlinear. It has a good coincidence of all curves for a range of platens distance from 0 to 0.4 mm. Otherwise, the compressive load difference between element lengths is significant during the platens distance from 0.4 to 0.5 mm. The Le - 0.1 and Le - 0.3 have a good coincidence with experimental curves. The element length needs to be smaller to conform to the geometry of realistic yarn. In addition, considering the effect of computational efficiency, the model with Le - 0.3 is appropriate for compression behavior.
Simulation and optimization
The Micro-CT images of double-ply yarn with 150 tpm are shown in Figure 11(a) and (b). The numerical models of yarn under appropriate parameters (COF-0.35, 110 virtual fibers and Le - 0.3) are displayed, as shown in Figure 11(c) and (d). The simulated yarn structure is close to the observation results of the realistic yarn. Numerical models of various twists and ply numbers can be generated by the virtual fiber method. The P2-T150 model as an example was used to compare in this paper. Comparison between (a)-(b) the Micro-CT image of P2-T150, and (c)-(d) the numerical model of the P2-T150 yarn.
Deformation under tensile behavior
The tensile response of simulation and experiment of yarns are recorded, and the load - deformation curves are extracted from simulation and experiment. The captured images are shown in Figure 12, which offers the failure modes of yarn. The damage increases with increasing deformation, up to tensile failure at 140 N. When fiber breaks, the fiber suddenly loses its mechanical constraints and spreads to the surroundings. It is because pre-tension is zero after the fiber is damaged, which has a trend of breakage along the direction of untwisting. However, the pre-tension does not significantly affect the inner fibers at the moment of yarn breakage. Numerical simulation of the fracture of the yarn. (a)-(d) 10%, 50%, 80% and 100% of the ultimate load.
Deformation under transverse compressive behavior
The experiment and simulation compression response of the yarn was given in Figure 8. Overall, the curves show an exponentially increasing compressive load with increasing compressive displacement. The geometric images of yarn are shown in Figure 13 to analyze the mechanical behavior and arrangement of fibers under different compressive stages. The fibers are more tightly arranged with increasing platen displacement as expected. Figure 14 shows the cross-sectional image of the yarn model in the middle position. When the yarn is subjected to a compressive load, the fibers preferentially in contact with the platens are rearranged. There is no significant change in the cross-section while the displacement keeps increasing since a compromise between internal stress and compressive load is attained. Morphology of different stages of compression simulation. (a)-(d) 10%, 40%, 80% and 100% of the compression deformation. Image analysis method of compressive behavior: (a) realistic cross-section (5 mm), (b) simulated cross-section (5 mm) and (c) quantitative metrics.

The Micro-CT was used to capture the image of yarn during compressive tests. As a comparison, an image analysis method was used to compare section areas of experiment and simulation. Figure 14(a) and (b) represents the cross-section’s image manipulation, which shows a clear cross-sectional profile. Figure 15(a) illustrates the good agreement between the area of each cross-section of Micro-CT and simulation. Taking into account the deformation of yarn during compression, the fundamental operations in morphological image processing, erosion and dilation, were employed for section area of simulation. In addition, the section area changes periodically within a cycle of twisted yarn. When the yarns are aligned along the direction of compression (see a' from Figure 15(a)), fiber expands difficultly. The space between fibers mainly contributes to the compressive deformation, and the section area does not change significantly. Hence, the section area at plane a' is smaller than that at plane b'. Furthermore, quantitative metrics is utilized to compare the geometric similarity of simulated and realistic yarn. Figure 14(c) indicates the process of generating quantitative metrics. Two profile images under the same section are overlapped based on identical coordinate system. 100 points are collected equally on each profile based on distance-preserving functions.
43
Connecting the points with the same number in two profile images to obtain the Euclidean distance The Statistical results of (a) area and (b) accuracy of each cross-section. Optimization of parameters of yarn on the mechanical behavior.

The yarn models with more ply numbers are established to investigate the effect of ply numbers on the yarn architecture and mechanical response. Figure 16 predicts tensile and compressive behavior of P1-T80 and P2-T80 yarn considering damage to fiber. The ultimate load of tensile behavior increases with the increasing ply number (see Figure 16(a)). Note that, the change rate is not regular, which could be affected by fiber damage. In addition, P2-T80 yarn has a large axial displacement (as shown in Figure 17(a) and (b), which is involved to twist and the number of fibers. The compressive load of P1-T80 and P2-T80 were shown in Figure 16(b). P1-T80 are the same compression tendency with P2-T80, which are non-linear. There is a sharp increase during the whole compression. It is because the initial structure of the yarn is unstable, and the inner fibers are rearranged to be stable (high volume fraction), see Figure 17(d) and (e). Effect of different yarn geometries on mechanical behavior: (a) axile tensile behavior and (b) transverse compressive behavior. Axial displacement of yarn with different twists and ply: axial tensile behavior of (a) P1-T80 (b) P2-T80 (c) P2-T200 and transverse compressive behavior of (d) P1-T80 (e) P2-T80 (f) P2-T200.

It can be observed tensile load increases with increasing twist in Figure 16(a). Using the P2-T80 as the basis, there exist the change rates of 6.9% between P2-T80 and P2-T150, and the change rates of 28.3% between P2-T80 and P2-T200. The increase in load is mainly due to an interlocking mechanism, that is, the fiber is held together by radial forces and frictions (as shown in Figure 17(b) and (c)). Figure 16(b) predicts a compressive load of yarn under different twists, which shows a kinematic response. The compressive load is predominantly determined by the difficulty of rearranging the fibers into a stable structure. The compressive load only increases at high compression displacements when fiber rearrangement becomes jammed, see Figure 17(e) and (f). Unlike the effect of the ply number, the differences in compression response between the different twisted yarns are mainly focused on the higher compression levels. The ultimate load tends to be higher as the twist increases at the same displacement.
Conclusions
In this work, an efficient virtual modeling methodwith stochastic damage properties according to the Weibull distribution was used to build a high precision model of the yarn. The effect of modeling parameters on accuracy of model was investigated based on the Micro-CT technology.
The balance between the modeling precision and computational efficiency can be achieved using the parameters the COF of 0.35, virtual fiber count of 122 and Le of 0.3. The excellent agreement of the simulated and realistic mechanical response was verified based on the image analysis during axial tensile and transverse compressive behavior. An accuracy was proposed to quantitatively analyze variations of fiber based on KNN algorithm.
The influence of parameters of yarn on the axial tensile and transverse compressive behaviors was investigated. The axial tensile and transverse compressive behaviors of yarns with different parameters can be predicted by established yarn model. Also, it describes the deformation and fracture characterization applying a constitutive model with stochastic damage properties. Eventually, the relationship between modeling parameters and mechanical behavior of yarn was established. Textile composite forming involves reinforcements mechanical behavior, which is highly non-linear and depends on several yarn-level factors which is guided by fiber-level interactions. Therefore, before textile composites may develop, the mechanical behavior and deformation of yarn, in particular twist and ply, is necessary to select as sufficient conditions.
Footnotes
Declaration of conflicting interests
The author(s) declared no potential conflicts of interest with respect to the research, authorship, and/or publication of this article.
Funding
The author(s) disclosed receipt of the following financial support for the research, authorship, and/or publication of this article: The work was supported by China Scholarship Council (CSC 202108120054).